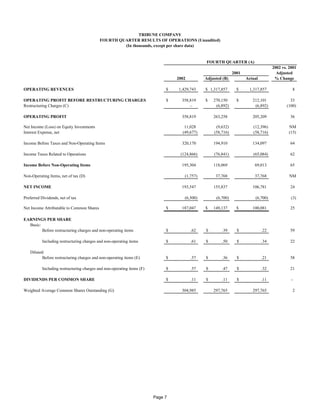
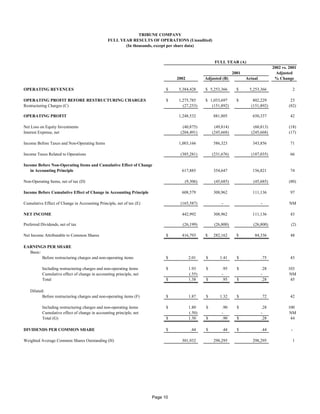
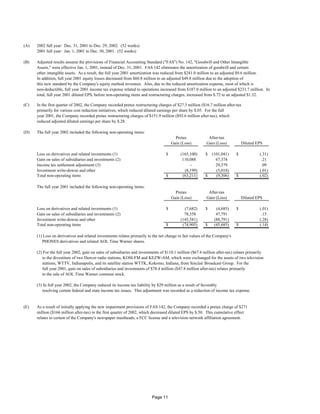
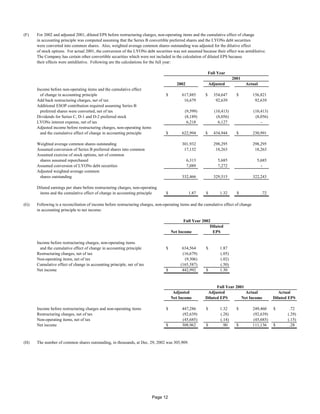
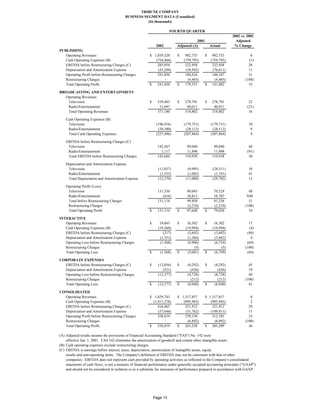
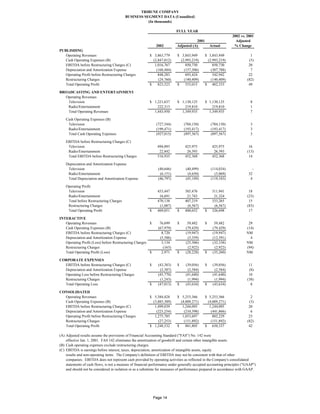
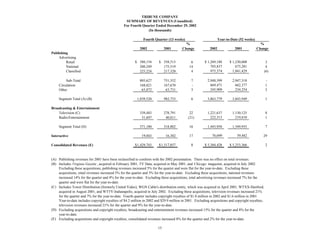
Tribune Company reported its fourth quarter and full year 2002 results. For the fourth quarter, revenues increased 8% year-over-year and net income increased 24%. Operating profit before restructuring charges increased 33% due to cost reductions. For the full year, revenues increased 2% and net income increased 43% due to restructuring initiatives and asset sales. Earnings per share increased 22% in the fourth quarter and 45% for the full year, reflecting continued improvement.
The document summarizes Tribune Company's fourth quarter and full year 2001 financial results. Some key points:
- Operating revenues and profits declined in the fourth quarter and full year 2001 compared to 2000, due to lower advertising revenues and restructuring charges.
- Non-operating items included gains from changes in fair values of investments and sales of investments, but also losses from investment write-downs.
- For the full year, net income declined 50% to $111 million, while earnings per share fell 60% to $0.28, due to lower operating results and restructuring charges.
The Tribune Company saw declines in operating revenues and income from continuing operations in the second quarter of 2007 compared to the same period in 2006. Operating revenues fell 6.8% and income from continuing operations dropped 78.2%. Expenses rose due to restructuring charges and plant closure costs. Non-operating losses also increased significantly due to losses on derivatives and investments. Net income declined 58.7% due to lower operating results and higher non-operating losses.
- Tribune Company reported lower operating revenues and profits for Q2 2006 compared to Q2 2005. Net income decreased 62.4% due to an expected loss from the sale of two television stations.
- Publishing revenues were down slightly but expenses increased, lowering operating cash flow and profit. Broadcasting revenues decreased for television but were flat overall.
- Income from continuing operations fell 29.1% while discontinued operations recorded a loss due to writing down assets of stations being sold. Earnings per share decreased across both continuing and discontinued operations.
- Tribune Company reported its second quarter and first half 2002 results, with operating revenues increasing 1% in the second quarter compared to the previous year.
- Operating profit before restructuring charges was up 16% in the second quarter and 7% in the first half compared to the previous year. However, net income declined due to losses from derivatives and investments.
- Earnings per share were lower than the previous year in the second quarter and first half due to restructuring charges, losses from investments, and a cumulative effect of a change in accounting principle related to impairments of intangible assets.
- Tribune Company reported a net loss of $138.9 million for Q3 2001 compared to net income of $79.2 million in Q3 2000. Operating revenues decreased 7% to $1.275 billion.
- Operating profit declined significantly due to restructuring charges of $130.7 million related to workforce reductions. Excluding restructuring charges, operating profit declined 37% to $148.7 million.
- Non-operating losses totaled $144.4 million, driven by losses on derivatives and investment write-downs, compared to a gain of $3.1 million in the prior year.
- Tribune Company reported third quarter 2002 revenues of $1.34 billion, up 5% from adjusted 2001 results.
- Operating profit before restructuring charges was $322.2 million in 2002 compared to $207.2 million in adjusted 2001, an increase of 56%.
- Net income for the quarter was $236.8 million compared to a net loss of $85.1 million in adjusted 2001, driven by gains on sales of subsidiaries and non-operating items.
- Tribune Company reported its second quarter and first half 2001 results, with operating revenues increasing 2% and 29% respectively compared to the same periods in 2000.
- Operating profit declined 21% and 10% for the quarter and first half respectively due to a restructuring charge of $14.3 million.
- Net income increased 92% and 36% for the quarter and first half respectively due to non-operating gains, but income from continuing operations declined 41% and 25% due to the restructuring charge and higher interest expenses.
The document summarizes Tribune Company's financial results for the third quarter and first three quarters of 2006 compared to the same periods in 2005. Some key highlights:
- Operating revenues and operating profit declined in the third quarter of 2006 compared to 2005, while operating expenses increased slightly.
- Non-operating items contributed significantly to net income in the third quarter of 2006, driven largely by gains from partnerships restructurings and asset sales.
- Income from continuing operations increased substantially, while income from discontinued operations (tv station sales) declined.
- Earnings per share increased for the third quarter and first three quarters of 2006 compared to 2005 periods.
The document summarizes Tribune Company's financial results for the third quarter and first three quarters of 2005 compared to the same periods in 2004. Key points:
- Operating revenues and operating profit increased in the third quarter of 2005 but decreased for the first three quarters compared to the prior year.
- Net income decreased significantly for the third quarter but increased for the first three quarters of 2005 versus 2004.
- Earnings per share decreased substantially for the third quarter but increased for the first three quarters compared to the previous year.
Tribune Company reported financial results for the fourth quarter of 2006 with increases in operating revenues and income from continuing operations compared to the same period in 2005. Operating revenues grew 5.4% to $1.47 billion driven by increases in publishing and broadcasting revenues. Income from continuing operations increased 76.9% to $232.1 million due to higher operating profit and non-operating gains, partially offset by higher interest expense. Net income attributable to common shares grew 80.6% to $239.1 million. Earnings per share increased significantly for both basic and diluted amounts.
The Tribune Company reported its fourth quarter and full year 2004 results. For the fourth quarter, operating revenues increased 1% to $1.48 billion while operating expenses rose 4.3% to $1.12 billion, decreasing operating profit by 7.9%. Net income declined 35.9% to $216.8 million due to lower non-operating gains. For the full year, operating revenues grew 2.4% to $6.1 billion but operating expenses increased 3.5%, reducing operating profit growth to 0.6%. Net income fell 26.5% to $849.4 million due to decreased non-operating gains.
The Tribune Company reported financial results for the first quarter of 2007. Operating revenues decreased 4.3% from the prior year to $1.2 billion due to declines in publishing and broadcasting revenues. Operating profit decreased 16.3% to $181 million due to lower revenues and a $76 million loss on derivatives and investments. Net loss was $15.6 million compared to net income of $102.8 million in the prior year, as discontinued operations had a $34.4 million loss from expected sales of newspapers. Advertising revenues declined for publishing, with national down 1.4% and classified down 16%.
The document summarizes Tribune Company's financial results for the first quarter of 2003 compared to 2002. Some key points:
- Operating revenues increased 5% to $1.29 billion driven by a 13% increase in television revenues. Operating profit before restructuring charges rose 10% to $276 million.
- Net income was $141 million compared to a net loss of $102 million in 2002. Earnings per share increased significantly.
- Publishing operating profit rose 21% to $198 million due to cost reductions. Broadcasting profit increased 25% to $90 million from higher television revenues and profits.
- Corporate losses narrowed to $11 million from restructuring charges in the prior year. The company had
This document provides non-GAAP reconciliations of Alltel Corporation's results of operations for various periods under GAAP and from current businesses. It excludes items like amortization of intangible assets from acquisitions, gains or losses from asset sales or disposals, integration expenses, adjustments to tax liabilities, and discontinued operations. Notes further explain the adjustments and excluded items, such as amortization, integration costs, gains or losses on sales of assets or securities, compensation from accelerated vesting of restricted stock, and the spin-off of Alltel's wireline business.
This document summarizes Tribune Company's fourth quarter and full year 2005 results. Key details include:
- Operating revenues decreased 4.7% in the fourth quarter and 2.3% for the full year compared to the previous year.
- Operating expenses increased 2.7% in the fourth quarter due to restructuring charges but decreased 1.3% for the full year.
- Net income decreased 38.0% in the fourth quarter and 3.8% for the full year from the previous year.
Tribune Company reported lower revenues and operating profits in the first quarter of 2008 compared to the same period in 2007. Revenues declined 7.8% to $1.1 billion due to decreases at the Publishing and Broadcasting & Entertainment segments. Overall operating profit fell 21.2% to $143.4 million due to lower profits at Publishing and higher losses at Corporate, partially offset by higher profits at Broadcasting & Entertainment. Net income increased significantly to $1.8 billion primarily due to a large non-operating tax adjustment related to a change in the company's tax status.
- Revenues increased 3% in the first quarter of 2004 compared to 2003, while operating profit decreased 1% due to higher operating expenses rising 4% compared to a 3% increase in revenues.
- Publishing revenues rose 3% due to increases in advertising, while broadcasting revenues increased 4% from growth in television advertising and acquisitions.
- Operating cash flow was flat as revenue growth was offset by higher operating expenses, and net income decreased 15% due to non-operating losses on investments.
The Tribune Company reported financial results for the first quarter of 2006, with operating revenues down 1.3% from the same period in 2005. Operating profit declined 11.6% due to higher operating expenses and non-operating losses. Net income decreased 28.1% while earnings per share fell 25%. Publishing operating profit dropped 12.2% on lower revenues, and Broadcasting/Entertainment operating profit rose 3% despite declines in some segments.
The Tribune Company saw a decline in operating revenues and profits in Q3 2007 compared to 2006. However, net income was boosted by $66.95 million in income from discontinued operations. Several non-operating items impacted net income, including $84.97 million in losses on derivatives and investments, but this was offset by $90.7 million in tax benefits. Earnings per share increased significantly year-over-year due to lower outstanding shares.
The Tribune Company reported financial results for the fourth quarter and full year of 2003. Operating revenues increased 2.8% in the fourth quarter and 3.9% for the full year compared to the prior year. Net income increased 74.8% in the fourth quarter and 101.2% for the full year due largely to gains on investments and derivatives. Earnings per share increased 73.8% in the fourth quarter on a basic basis and 75.4% on a diluted basis.
Hewlett-Packard reported financial results for the third quarter of fiscal year 2008. Net revenue was $28.03 billion, a 10% increase from the same quarter last year. Earnings from operations were $2.53 billion. After accounting for various adjustments including amortization expenses and restructuring charges, non-GAAP earnings from operations were $2.75 billion, a 20% increase over the prior year. For the nine months ended July 31, 2008, net revenue increased 11% to $84.76 billion, while non-GAAP earnings from operations grew 25% to $8.39 billion compared to the same period last year.
1. The document provides reconciliation of equity and total comprehensive income from previous GAAP to IFRS as of April 1, 2010 and for the year ended March 31, 2011 for XYZ Ltd.
2. Significant adjustments include higher property, plant, and equipment, recognition of intangible assets and financial assets at fair value, inclusion of overhead in inventory, and recognition of pension liabilities and deferred taxes.
3. Total equity increased by Rs. 538 lakhs and total comprehensive income decreased by Rs. 111 lakhs primarily due to the above adjustments.
The document provides a reconciliation of Alltel Corporation's results of operations under GAAP accounting standards versus results from current businesses on a non-GAAP basis for the six months and three months ended June 30, 2006. Key figures are provided for revenues, costs and expenses, operating income, earnings per share, and segment information from the company's wireless, wireline, and corporate operations. Certain items are excluded from the non-GAAP results of current businesses column, as described in notes to the reconciliation.
This document summarizes the financial performance of a company for the third quarter and fiscal year ending June 30, 2005 compared to the prior year. It shows that net sales increased 6% for the quarter and 5% for the year. Earnings from continuing operations were $156 million for the quarter and $517 million for the year. The company also had significant earnings from discontinued operations of $579 million for the year from the sale of a business unit.
Revenues increased from $11.5 billion in 2006 to $12.8 billion in 2007 primarily due to higher electric utility revenues. Operating income increased from $2.6 billion to $2.8 billion between 2006 and 2007. Net income increased from $1.25 billion in 2006 to $1.31 billion in 2007, while basic earnings per share increased from $3.84 to $4.27 over the same period.
- Tribune Company reported a 3.4% increase in operating revenues but a 2.5% decrease in operating profit for the third quarter of 2003 compared to the same period in 2002.
- Net income decreased 23.0% to $182.3 million due primarily to lower non-operating gains.
- For the first three quarters of 2003, operating revenues rose 4.3% while operating profit before restructuring charges increased 4.7% compared to the same period in 2002. However, net income increased significantly due to the absence of a large accounting charge in 2002.
SanDisk reported a net loss of $207.99 million for the quarter, compared to a net income of $10.96 million in the prior year, due to lower revenues and gross profits. Revenues declined by $190.5 million to $659.47 million as product revenues fell by $135.95 million. Gross loss was $1.14 million compared to a gross profit of $258.78 million previously. Non-GAAP net loss was $108.46 million, which excludes items such as share-based compensation and amortization of intangible assets. Cash and cash equivalents increased to $1.09 billion from $962.06 million at the start of the quarter.
Lexmark's annual report summarizes its strategy and performance in 2004. The company focuses exclusively on printing and develops its own printing technologies. It sells printers and supplies, with supplies driving the majority of profits. Lexmark aims to expand into growth segments, differentiate through easy-to-use products and services, and build its brand as a printing solutions company. The report highlights double-digit revenue and earnings growth in 2004 and strategic investments to support future growth.
Pitney Bowes is a global mailstream technology company that has been in business since 1920. It offers hardware, software, and services for mail and document management to over 2 million customers in 130 countries. The company has 35,000 employees and generates over $6 billion in annual revenue from its mailstream solutions and services segments. Pitney Bowes continues to grow through strategic acquisitions, having spent over $2.6 billion on acquisitions since 2001 to expand its technology and service offerings.
This document is The Hershey Company's annual report on Form 10-K filed with the SEC for the fiscal year ended December 31, 2006. It provides an overview of The Hershey Company, including that it is the largest manufacturer of chocolate and confectionery products in North America. It details the company's reportable segment, selling and marketing organization, principal product lines in various geographic regions, customers, marketing strategy, product distribution, pricing changes, and raw materials used.
lemark international ShareholderProposalDiscussionfinance47
The document discusses a shareholder proposal regarding Lexmark International adopting a policy for annual advisory votes on executive compensation. The board recommends voting against the proposal for three reasons: 1) It could put Lexmark at a competitive disadvantage for attracting and retaining talent compared to its peers who do not have such votes. 2) Advisory votes are not an effective mechanism for shareholders to convey their views to the board, as shareholders already have direct access to the board. 3) Lexmark's compensation practices, including its peer group benchmarking, alignment of pay with performance, and use of independent consultants, are in the best interests of shareholders.
Hershey Foods Corporation saw decreased sales and net income in 1999 compared to 1998. Sales declined due to the divestiture of the pasta business in early 1999 and difficulties fulfilling orders after implementing a new IT system. Net income increased due to a gain on the pasta sale, but excluding this was down 13% due to the sales decline and higher costs. The financial position remained strong with reduced debt from the pasta sale proceeds. Capital expenditures of $150-170 million annually are planned for manufacturing expansion and modernization.
Sovereign Bancorp is the parent company of Sovereign Bank, a $85 billion financial institution as of 2007. Sovereign Bank operates 750 community banking offices across the Northeast U.S. and offers retail banking, business banking, and various financial services. In 2007, Sovereign focused on building its core businesses and exiting non-core businesses to improve capital levels, reduce earnings volatility, and position itself for sustainable earnings growth going forward. Key strategies included reducing expenses by over $100 million, improving productivity, and restructuring the balance sheet by selling over $8 billion in non-core assets.
This document summarizes Tribune Company's financial results for the first quarter of 2002 compared to the first quarter of 2001. Some key points:
- Operating revenues decreased 5% to $1.23 billion due to declines in publishing advertising and classified revenues. Operating profit before restructuring charges fell 3% to $251.7 million.
- Restructuring charges of $27.3 million were recorded in the first quarter of 2002 related to cost reduction initiatives.
- Net loss was $101.6 million compared to a net income of $70.6 million in 2001, driven by non-operating losses on investments and the cumulative effect of a change in accounting principle.
- Publishing revenues fell 6
The document summarizes Tribune Company's financial results for the second quarter and first half of 2004 compared to the same periods in 2003. Key highlights include:
- Operating revenues increased 3.2% in the second quarter and 3.2% in the first half. However, operating profit declined due to higher operating expenses.
- Publishing operating cash flow declined 22.1% in the quarter and 13.4% in the first half due to a 12.8% rise in cash operating expenses.
- Broadcasting/Entertainment operating cash flow rose 7.2% in the quarter and 7.5% in the first half, led by a 7.3% and 8.3% increase in television.
Tribune Company reported first quarter results for 2005. Operating revenues decreased 1.2% compared to the same period last year. Operating profit decreased 7.8% due to higher operating expenses and non-operating losses. Net income increased 18.4% due to lower income tax expenses from resolving certain tax issues. Earnings per share increased 22.2% for basic and 25.7% for diluted.
The Tribune Company reported financial results for the second quarter and first half of 2005. For the second quarter, revenues decreased 2.3% but operating expenses fell 4.5%, leading to a 6.1% rise in operating profit. Net income increased 142.1% to $233 million due to gains from investments. Earnings per share rose 151.7% to $0.73. For the first half, revenues declined 1.8% while operating expenses fell 2.2%, keeping operating profit flat. Net income increased 73.3% to $376 million and earnings per share rose 81.5% to $1.18, helped by investment gains.
The Tribune Company reported financial results for the second quarter and first half of 2003. Operating revenues increased 5.0% in the second quarter and 4.8% in the first half compared to the prior year. Net income more than doubled in the second quarter and was significantly higher in the first half due to gains on investments. Earnings per share increased substantially in both periods. Publishing operating profit rose 4.7% in the quarter and 11.7% in the first half, while Broadcasting operating profit increased 15.0% and 16.9% respectively.
The Tribune Company reported financial results for the third quarter of 2007. Operating revenues decreased 4.1% compared to the third quarter of 2006. Net income was $152.8 million compared to $164.3 million in the prior year. Earnings per share increased due to gains from discontinued operations. Non-operating expenses included losses from derivatives and strategic transaction costs, but were partially offset by tax benefits.
- Tribune Company reported a net loss of $4.5 billion for Q2 2008 compared to net income of $36 million in Q2 2007. This was largely due to a $3.8 billion write-down of intangible assets.
- Operating revenues declined 5.7% year-over-year to $1.1 billion in Q2 2008. Operating expenses increased significantly due to the $3.8 billion write-down.
- For the first half of 2008, Tribune reported a net loss of $2.7 billion compared to net income of $13 million in the first half of 2007, again largely due to the $3.8 billion intangible asset write-down.
- Tribune Company reported a net loss of $4.5 billion for Q2 2008 compared to net income of $36 million in Q2 2007. This was largely due to a $3.8 billion write-down of intangible assets.
- Operating revenues declined 5.7% year-over-year to $1.1 billion in Q2 2008. Operating expenses increased significantly due to the $3.8 billion write-down.
- The company also sold its Newsday Media Group business and recorded a $693 million loss on the disposition in Q2 2008.
The document provides operating statistics and financial results for El Paso Corporation for the fourth quarter and full year of 2005. Some key details include:
- For the fourth quarter of 2005, El Paso reported a net loss of $162 million and a loss from continuing operations of $283 million.
- For the full year 2005, El Paso reported a net loss of $606 million and a loss from continuing operations of $702 million.
- El Paso reported earnings before interest and taxes of -$106 million for the fourth quarter and $398 million for the full year from its various business segments including pipelines, exploration and production, marketing and trading, power and field services.
This document provides operating statistics and financial results for El Paso Corporation for the fourth quarter of 2005.
Some key highlights include:
- Consolidated net loss was $162 million for Q4 2005 compared to a net loss of $542 million for Q4 2004.
- The Pipeline Group segment earned $233 million in earnings before interest and taxes for Q4 2005, down from $369 million in Q4 2004.
- Exploration & Production earned $168 million in earnings before interest and taxes for Q4 2005, down slightly from $176 million in Q4 2004.
- Marketing and Trading lost $224 million in earnings before interest and taxes for Q4 2005, an improvement from a $
Tribune Company reported lower revenues and operating profits in the first quarter of 2008 compared to the same period in 2007. Revenues declined 7.8% to $1.1 billion due to decreases in publishing and radio/entertainment revenues. Operating profit fell 21.2% to $143.4 million as profits declined across all business segments. The publishing segment saw the largest profit drop, with operating profit declining 73.9% due to lower revenues and higher severance costs.
The document summarizes Henkel's financial results for the second quarter and first half of 2004 compared to the same periods in 2003. Net sales increased 9% in the second quarter and 6% year-to-date. Earnings from continuing operations rose 26% in the second quarter and 9% year-to-date due to growth across all business segments. Discontinued operations generated a large gain of $550 million from the exchange of businesses and increased earnings from discontinued operations significantly for both periods. As a result, net earnings increased substantially.
This document summarizes the financial performance of a company for the third quarter and first six months of 2005 compared to the same periods in 2004. It shows that net sales increased 6% for both periods while earnings from continuing operations decreased 38% and 24% respectively due to higher costs. The household products division grew sales and earnings both periods, while other divisions saw mixed results.
The Tribune Company reported financial results for the third quarter and first three quarters of 2004. For the third quarter, operating revenues increased 2.0% but operating profit decreased 18.0% due to higher operating expenses. Net income attributable to common shares decreased 32.1% due to lower operating profit and higher non-operating losses. For the first three quarters, operating revenues increased 2.8% but operating profit decreased 11.5% and net income attributable to common shares decreased 37.8% due to factors similar to those impacting the third quarter results.
This document provides a reconciliation of ALLTEL Corporation's results of operations under GAAP to non-GAAP results of operations from current businesses for the twelve months and three months ended December 31, 2004. It shows revenues, costs and expenses, operating income, and net income under both GAAP and excluding certain items. Key results include total 2004 revenues of $8.2 billion, operating income of $1.97 billion, net income of $1.04 billion, and basic EPS of $3.38 under non-GAAP current business measures.
western unionCorporate Governance Guidelinesfinance47
The Board of Directors is responsible for overseeing Western Union and selecting the CEO and other executive management. The Board's primary functions are oversight, ethics and integrity, evaluating performance, reviewing strategic plans, advising management, and ensuring compliance. The Board establishes committees, evaluates itself, and plans for CEO succession to fulfill its responsibilities.
western unionRelated Person Transactions Policy finance47
The policy establishes guidelines for approving related person transactions between the company and its directors, executive officers, or significant shareholders. It requires that all related person transactions be approved or ratified by the Corporate Governance Committee or disinterested members of the Board. The committee must consider factors like the transaction's size, the related person's interest, potential conflicts, and whether comparable terms could be obtained from an unaffiliated third party. Ongoing related person transactions are also subject to annual review. All approved transactions must be disclosed as required by securities laws.
The document summarizes Western Union's 2006 annual report. It highlights that Western Union has a 150-year history of connecting people around the world through money transfers, with its brand synonymous with speed, trust, reliability and convenience. It processes nearly 150 million consumer-to-consumer transactions annually, accounting for over 80% of its revenue. It is also expanding its consumer-to-business services to allow bill payments, having recently acquired a company in Argentina, as it looks to increase diversification and growth opportunities.
Western Union had a very successful 2007 financially, with revenue, operating profit, and cash flow from operating activities all reaching record highs and growing at double-digit annual rates. The company strengthened its global network by increasing its number of agent locations worldwide to over 335,000 across more than 200 countries and territories. International consumer-to-consumer money transfers now make up 65% of Western Union's total revenue, demonstrating the company's increasing global reach and focus on serving migrant populations worldwide. Western Union aims to continue growing this business segment and meeting the evolving financial needs of global consumers.
Western Union's 2008 annual report summarizes the company's strong financial performance in 2008. The company delivered record revenue of $5.3 billion and cash flow from operations of $1.25 billion. Western Union's share of the global cross-border remittance market increased to 17% in 2008. Looking ahead, the company plans to focus on accelerating profitable growth, expanding payments services, innovating new products, and improving profitability through cost reductions.
Hershey Foods Corporation saw decreased sales and net income in 1999 compared to 1998. Sales declined due to the divestiture of the pasta business in early 1999 and difficulties fulfilling orders after implementing a new IT system. Net income increased due to a gain on the pasta sale, but excluding this was down 13% due to the sales decline and higher costs. The financial position remained strong with reduced debt from the pasta sale proceeds. Capital expenditures of $150-170 million annually are planned for manufacturing expansion and modernization.
This document provides an analysis of Hershey Foods Corporation's financial condition and results of operations. It discusses increases in net sales and gross margin from 1999 to 2000 primarily due to lower raw material costs. Selling and administrative expenses also increased from 1999 to 2000 due to higher marketing and staffing costs. In 2000, Hershey acquired Nabisco's mint and gum businesses for $135 million. The acquisition increased assets but did not materially impact 2000 results. Cash flow from operations and prior asset sales exceeded capital expenditures, share repurchases and dividends. Liquidity remains strong with continued capital investments planned.
1) Net sales for Hershey Foods Corporation increased 6% from 1999 to 2000 due to higher core confectionery and grocery product sales in North America, new product introductions, and lower returns and discounts. Net sales decreased 10% from 1998 to 1999 primarily due to the sale of the pasta business.
2) Gross margin increased from 40.7% in 1999 to 41.5% in 2000 due to lower raw material costs and returns/discounts, but was partially offset by higher distribution costs. Gross margin decreased from 40.8% in 1998 to 40.7% in 1999 due to product mix and higher distribution costs.
3) Net income decreased 27% from 1999 to 2000 due to the 1999
- Hershey Foods Corporation produces and distributes a broad line of chocolate and non-chocolate confectionery and grocery products.
- Net sales rose in 2001 primarily due to acquisitions of mint and gum businesses and new product introductions. Net sales also rose in 2000 due to increased sales of base confectionery products.
- Gross margin was unchanged at 41.5% in 2000 and 2001. Excluding one-time charges, gross margin rose to 42.6% in 2001 due to lower costs and supply chain efficiencies.
Hershey Foods Corporation manufactures and distributes confectionery and grocery products. In 2002, the company's net sales decreased from 2001 primarily due to increased promotion costs, divestitures of some brands, and the timing of sales from an acquired gum and mint business. Cost of sales also decreased in 2002 from 2001 mainly because of lower costs for raw materials. However, gross margin increased due to decreased raw material costs and supply chain efficiencies. Selling, marketing, and administrative expenses decreased slightly in 2002 driven by savings from business realignment initiatives and the elimination of goodwill amortization, partially offset by expenses to explore a possible sale of the company.
Hershey Foods Corporation manufactures and distributes confectionery and grocery products. Net sales decreased in 2002 due to increased promotion costs, divestitures, and sluggish retail conditions. Cost of sales decreased due to lower raw material costs and supply chain efficiencies. In late 2001, the company approved a business realignment plan to improve efficiency, including outsourcing manufacturing, rationalizing product lines, improving supply chain, and workforce reductions, generating $75-80 million in annual savings. Charges of $312 million were recorded for these initiatives.
- Hershey Foods Corporation manufactures and sells confectionery and grocery products. In 2003, the company saw increased net sales and net income compared to 2002 through strategies focusing on key brands, gross margin expansion, and earnings growth per share.
- The company's strategies over a three-year period resulted in increased sales, gross margins, and returns through price increases, improved sales mix, lower costs, and share repurchases. However, challenges remain in driving profitable core confectionery growth and portfolio evolution.
- Hershey Foods Corporation manufactures and sells confectionery and grocery products. In 2003, the company saw increased net sales and income compared to 2002 through strategies focused on key brands, gross margin expansion, and earnings growth per share.
- Primary challenges for 2004 and beyond include profitable sales growth in core confectionery and broader snacks, evolving the product portfolio to meet consumer trends, and balancing growth and profit in seasonal and packaged candy businesses. The company expects continued revenue growth, margin expansion, and earnings growth per share through focus on these strategies.
This document is Hershey Foods Corporation's 2003 annual report and proxy statement to shareholders. It discusses Hershey's financial performance in 2003, including 13% earnings per share growth and continued gross margin expansion. It outlines the company's strategy of investing in core brands and expanding into snack market adjacencies. Key initiatives included restructuring the US sales force, creating a US Snack Group, and launching new better-for-you snack products. The report also discusses governance improvements and leadership changes on the board and in management.
This document is Hershey Foods Corporation's 2003 annual report and proxy statement to shareholders. It discusses Hershey's financial performance in 2003, including 13% earnings per share growth and continued margin expansion. It outlines the company's strategy of investing in core brands and expanding into snack market adjacencies. Key initiatives included restructuring the US sales force, creating a US Snack Group, and launching new better-for-you snack products. The report also discusses governance improvements and leadership changes on the board and in management.
This document is a Form 10-K annual report filed by Hershey Foods Corporation with the SEC for the fiscal year ending December 31, 2004. It provides information on Hershey's business operations, products, sales, marketing strategies, distribution networks, raw material costs, and price increases. Key details include that Hershey manufactures and sells over 50 brands of confectionery, snack, refreshment and grocery products in North America and other countries. It sources cocoa beans, its primary raw material, from various global regions.
This document is a Form 10-K annual report filed by Hershey Foods Corporation with the SEC for the fiscal year ending December 31, 2004. It provides information on Hershey's business operations, products, sales, distribution, raw materials, and pricing. Key details include: Hershey manufactures and sells confectionery, snack, refreshment and grocery products worldwide; its major brands include Hershey's, Reese's, and Kit Kat; cocoa beans are its primary raw material; and it announced price increases on half its domestic confectionery line in late 2004 and early 2005.
The document is The Hershey Company's annual report filed with the SEC for the fiscal year ended December 31, 2005. It provides information on Hershey's business operations including that it manufactures, distributes and sells confectionery, snack, refreshment and grocery products. It operates in the United States, Canada and Mexico and markets over 50 brands. The report lists the company's principal product groups and brands of confectionery, snack and refreshment products sold in the US. It also discusses the acquisitions of Joseph Schmidt Confections and Scharffen Berger Chocolate Maker in 2005.
Falcon stands out as a top-tier P2P Invoice Discounting platform in India, bridging esteemed blue-chip companies and eager investors. Our goal is to transform the investment landscape in India by establishing a comprehensive destination for borrowers and investors with diverse profiles and needs, all while minimizing risk. What sets Falcon apart is the elimination of intermediaries such as commercial banks and depository institutions, allowing investors to enjoy higher yields.
Understanding how timely GST payments influence a lender's decision to approve loans, this topic explores the correlation between GST compliance and creditworthiness. It highlights how consistent GST payments can enhance a business's financial credibility, potentially leading to higher chances of loan approval.
Solution Manual For Financial Accounting, 8th Canadian Edition 2024, by Libby...Donc Test
Solution Manual For Financial Accounting, 8th Canadian Edition 2024, by Libby, Hodge, Verified Chapters 1 - 13, Complete Newest Version Solution Manual For Financial Accounting, 8th Canadian Edition by Libby, Hodge, Verified Chapters 1 - 13, Complete Newest Version Solution Manual For Financial Accounting 8th Canadian Edition Pdf Chapters Download Stuvia Solution Manual For Financial Accounting 8th Canadian Edition Ebook Download Stuvia Solution Manual For Financial Accounting 8th Canadian Edition Pdf Solution Manual For Financial Accounting 8th Canadian Edition Pdf Download Stuvia Financial Accounting 8th Canadian Edition Pdf Chapters Download Stuvia Financial Accounting 8th Canadian Edition Ebook Download Stuvia Financial Accounting 8th Canadian Edition Pdf Financial Accounting 8th Canadian Edition Pdf Download Stuvia
Independent Study - College of Wooster Research (2023-2024) FDI, Culture, Glo...AntoniaOwensDetwiler
"Does Foreign Direct Investment Negatively Affect Preservation of Culture in the Global South? Case Studies in Thailand and Cambodia."
Do elements of globalization, such as Foreign Direct Investment (FDI), negatively affect the ability of countries in the Global South to preserve their culture? This research aims to answer this question by employing a cross-sectional comparative case study analysis utilizing methods of difference. Thailand and Cambodia are compared as they are in the same region and have a similar culture. The metric of difference between Thailand and Cambodia is their ability to preserve their culture. This ability is operationalized by their respective attitudes towards FDI; Thailand imposes stringent regulations and limitations on FDI while Cambodia does not hesitate to accept most FDI and imposes fewer limitations. The evidence from this study suggests that FDI from globally influential countries with high gross domestic products (GDPs) (e.g. China, U.S.) challenges the ability of countries with lower GDPs (e.g. Cambodia) to protect their culture. Furthermore, the ability, or lack thereof, of the receiving countries to protect their culture is amplified by the existence and implementation of restrictive FDI policies imposed by their governments.
My study abroad in Bali, Indonesia, inspired this research topic as I noticed how globalization is changing the culture of its people. I learned their language and way of life which helped me understand the beauty and importance of cultural preservation. I believe we could all benefit from learning new perspectives as they could help us ideate solutions to contemporary issues and empathize with others.
Fabular Frames and the Four Ratio ProblemMajid Iqbal
Digital, interactive art showing the struggle of a society in providing for its present population while also saving planetary resources for future generations. Spread across several frames, the art is actually the rendering of real and speculative data. The stereographic projections change shape in response to prompts and provocations. Visitors interact with the model through speculative statements about how to increase savings across communities, regions, ecosystems and environments. Their fabulations combined with random noise, i.e. factors beyond control, have a dramatic effect on the societal transition. Things get better. Things get worse. The aim is to give visitors a new grasp and feel of the ongoing struggles in democracies around the world.
Stunning art in the small multiples format brings out the spatiotemporal nature of societal transitions, against backdrop issues such as energy, housing, waste, farmland and forest. In each frame we see hopeful and frightful interplays between spending and saving. Problems emerge when one of the two parts of the existential anaglyph rapidly shrinks like Arctic ice, as factors cross thresholds. Ecological wealth and intergenerational equity areFour at stake. Not enough spending could mean economic stress, social unrest and political conflict. Not enough saving and there will be climate breakdown and ‘bankruptcy’. So where does speculative design start and the gambling and betting end? Behind each fabular frame is a four ratio problem. Each ratio reflects the level of sacrifice and self-restraint a society is willing to accept, against promises of prosperity and freedom. Some values seem to stabilise a frame while others cause collapse. Get the ratios right and we can have it all. Get them wrong and things get more desperate.
Economic Risk Factor Update: June 2024 [SlideShare]Commonwealth
May’s reports showed signs of continued economic growth, said Sam Millette, director, fixed income, in his latest Economic Risk Factor Update.
For more market updates, subscribe to The Independent Market Observer at https://blog.commonwealth.com/independent-market-observer.
Optimizing Net Interest Margin (NIM) in the Financial Sector (With Examples).pdfshruti1menon2
NIM is calculated as the difference between interest income earned and interest expenses paid, divided by interest-earning assets.
Importance: NIM serves as a critical measure of a financial institution's profitability and operational efficiency. It reflects how effectively the institution is utilizing its interest-earning assets to generate income while managing interest costs.
OJP data from firms like Vicinity Jobs have emerged as a complement to traditional sources of labour demand data, such as the Job Vacancy and Wages Survey (JVWS). Ibrahim Abuallail, PhD Candidate, University of Ottawa, presented research relating to bias in OJPs and a proposed approach to effectively adjust OJP data to complement existing official data (such as from the JVWS) and improve the measurement of labour demand.
"Does Foreign Direct Investment Negatively Affect Preservation of Culture in the Global South? Case Studies in Thailand and Cambodia."
Do elements of globalization, such as Foreign Direct Investment (FDI), negatively affect the ability of countries in the Global South to preserve their culture? This research aims to answer this question by employing a cross-sectional comparative case study analysis utilizing methods of difference. Thailand and Cambodia are compared as they are in the same region and have a similar culture. The metric of difference between Thailand and Cambodia is their ability to preserve their culture. This ability is operationalized by their respective attitudes towards FDI; Thailand imposes stringent regulations and limitations on FDI while Cambodia does not hesitate to accept most FDI and imposes fewer limitations. The evidence from this study suggests that FDI from globally influential countries with high gross domestic products (GDPs) (e.g. China, U.S.) challenges the ability of countries with lower GDPs (e.g. Cambodia) to protect their culture. Furthermore, the ability, or lack thereof, of the receiving countries to protect their culture is amplified by the existence and implementation of restrictive FDI policies imposed by their governments.
My study abroad in Bali, Indonesia, inspired this research topic as I noticed how globalization is changing the culture of its people. I learned their language and way of life which helped me understand the beauty and importance of cultural preservation. I believe we could all benefit from learning new perspectives as they could help us ideate solutions to contemporary issues and empathize with others.
1. Elemental Economics - Introduction to mining.pdfNeal Brewster
After this first you should: Understand the nature of mining; have an awareness of the industry’s boundaries, corporate structure and size; appreciation the complex motivations and objectives of the industries’ various participants; know how mineral reserves are defined and estimated, and how they evolve over time.
Tdasx: In-Depth Analysis of Cryptocurrency Giveaway Scams and Security Strate...
tribune earnings_q4_02_tables
1. TRIBUNE COMPANY
FOURTH QUARTER RESULTS OF OPERATIONS (Unaudited)
(In thousands, except per share data)
FOURTH QUARTER (A)
2002 vs. 2001
2001 Adjusted
2002 Adjusted (B) Actual % Change
OPERATING REVENUES $ 1,429,743 $ 1,317,857 $ 1,317,857 8
OPERATING PROFIT BEFORE RESTRUCTURING CHARGES $ 358,819 $ 270,150 $ 212,101 33
Restructuring Charges (C) - (6,892) (6,892) (100)
OPERATING PROFIT 358,819 263,258 205,209 36
Net Income (Loss) on Equity Investments 11,028 (9,632) (12,396) NM
Interest Expense, net (49,677) (58,716) (58,716) (15)
Income Before Taxes and Non-Operating Items 320,170 194,910 134,097 64
Income Taxes Related to Operations (124,866) (76,841) (65,084) 62
Income Before Non-Operating Items 195,304 118,069 69,013 65
Non-Operating Items, net of tax (D) (1,757) 37,768 37,768 NM
NET INCOME 193,547 155,837 106,781 24
Preferred Dividends, net of tax (6,500) (6,700) (6,700) (3)
Net Income Attributable to Common Shares $ 187,047 $ 149,137 $ 100,081 25
EARNINGS PER SHARE
Basic:
Before restructuring charges and non-operating items $ .62 $ .39 $ .22 59
Including restructuring charges and non-operating items $ .61 $ .50 $ .34 22
Diluted:
Before restructuring charges and non-operating items (E) $ .57 $ .36 $ .21 58
Including restructuring charges and non-operating items (F) $ .57 $ .47 $ .32 21
DIVIDENDS PER COMMON SHARE $ .11 $ .11 $ .11 -
Weighted Average Common Shares Outstanding (G) 304,985 297,765 297,765 2
Page 7
2. (A) 2002 quarter: Sept. 30, 2002 to Dec. 29, 2002. (13 weeks)
2001 quarter: Oct. 1, 2001 to Dec. 30, 2001. (13 weeks)
(B) Adjusted results assume the provisions of Financial Accounting Standard (quot;FASquot;) No. 142, quot;Goodwill and Other Intangible
Assets,quot; were effective Jan. 1, 2001, instead of Dec. 31, 2001. FAS 142 eliminates the amortization of goodwill and certain
other intangible assets. As a result, fourth quarter 2001 amortization was reduced from $60.6 million to an adjusted $2.6 million.
In addition, fourth quarter 2001 equity losses decreased from $12.4 million to an adjusted $9.6 million due to the adoption of
this new standard by the Company's equity method investees. Also, due to the reduced amortization expense, most of which is
non-deductible, fourth quarter 2001 income tax expense related to operations increased from $65.1 million to an adjusted $76.8 million.
In total, fourth quarter 2001 diluted EPS, before restructuring charges and non-operating items, increased from $.21 to an adjusted $.36.
(C) In the fourth quarter of 2001, the Company recorded pretax restructuring charges of $6.9 million ($4.2 million after-tax)
primarily for various cost reduction initiatives, which reduced diluted earnings per share by $.01.
(D) The fourth quarter of 2002 included the following non-operating items:
Pretax After-tax
Gain (Loss) Gain (Loss) Diluted EPS
Loss on derivatives and related investments (1) $ (42,299) $ (25,887) $ (.07)
Gain on sales of investments 541 331 -
Income tax settlement adjustment (2) - 26,376 .08
Investment write-downs and other (4,210) (2,577) (.01)
Total non-operating items $ (45,968) $ (1,757) $ -
The fourth quarter of 2001 included the following non-operating items:
Pretax After-tax
Gain (Loss) Gain (Loss) Diluted EPS
Gain on derivatives and related investments (1) $ 41,805 $ 25,497 $ .08
Gain on sales of investments (3) 75,380 45,974 .14
Investment write-downs and other (55,260) (33,703) (.10)
Total non-operating items $ 61,925 $ 37,768 $ .12
(1) Gain (loss) on derivatives and related investments relates primarily to the net change in fair values of the Company's
PHONES derivatives and related AOL Time Warner shares.
(2) In the fourth quarter of 2002, the Company reduced its income tax liability by $26 million as a result of
favorably resolving certain federal income tax issues. This adjustment was recorded as a reduction of income tax expense.
(3) For the fourth quarter of 2001, gain on sales of investments of $75.4 million ($46.0 million after-tax) relates primarily
to the sale of AOL Time Warner common stock.
Page 8
3. (E) Diluted EPS before restructuring charges and non-operating items was computed assuming that the Series B convertible
preferred shares and the LYONs debt securities were converted into common shares. Also, weighted average common
shares outstanding was adjusted for the dilutive effect of stock options. The Company has certain other convertible securities
which were not included in the calculation of diluted EPS because their effects were antidilutive. Following are the
calculations for the fourth quarter:
Fourth Quarter
2001
2002 Adjusted Actual
Income before non-operating items $ 195,304 $ 118,069 $ 69,013
Add back restructuring charges, net of tax - 4,203 4,203
Additional ESOP contribution required assuming Series B
preferred shares were converted, net of tax (2,476) (2,670) (2,670)
Dividends for Series C, D-1 and D-2 preferred stock (2,047) (2,014) (2,014)
LYONs interest expense, net of tax 1,552 1,550 1,550
Adjusted income before restructuring charges and non-operating items $ 192,333 $ 119,138 $ 70,082
Weighted average common shares outstanding 304,985 297,765 297,765
Assumed conversion of Series B preferred shares into common 16,751 18,263 18,263
Assumed exercise of stock options, net of common
shares assumed repurchased 6,999 3,962 3,962
Assumed conversion of LYONs debt securities 6,988 7,272 7,272
Adjusted weighted average common
shares outstanding 335,723 327,262 327,262
Diluted earnings per share before restructuring charges
and non-operating items $ .57 $ .36 $ .21
(F) Following is a reconciliation of income before restructuring charges and non-operating items to net income:
Fourth Quarter 2002
Diluted
Net Income EPS
Income before non-operating items $ 195,304 $ .57
Non-operating items, net of tax (1,757) -
Net income $ 193,547 $ .57
Fourth Quarter 2001
Adjusted Adjusted Actual Actual
Net Income Diluted EPS Net Income Diluted EPS
Income before restructuring charges and non-operating items $ 122,272 $ .36 $ 73,216 $ .21
Restructuring charges, net of tax (4,203) (.01) (4,203) (.01)
Non-operating items, net of tax 37,768 .12 37,768 .12
Net income $ 155,837 $ .47 $ 106,781 $ .32
(G) The number of common shares outstanding, in thousands, at Dec. 29, 2002 was 305,909.
Page 9
4. TRIBUNE COMPANY
FULL YEAR RESULTS OF OPERATIONS (Unaudited)
(In thousands, except per share data)
FULL YEAR (A)
2002 vs. 2001
2001 Adjusted
2002 Adjusted (B) Actual % Change
OPERATING REVENUES $ 5,384,428 $ 5,253,366 $ 5,253,366 2
OPERATING PROFIT BEFORE RESTRUCTURING CHARGES $ 1,275,785 $ 1,033,697 $ 802,229 23
Restructuring Charges (C) (27,253) (151,892) (151,892) (82)
OPERATING PROFIT 1,248,532 881,805 650,337 42
Net Loss on Equity Investments (40,875) (49,814) (60,813) (18)
Interest Expense, net (204,491) (245,668) (245,668) (17)
Income Before Taxes and Non-Operating Items 1,003,166 586,323 343,856 71
Income Taxes Related to Operations (385,281) (231,676) (187,035) 66
Income Before Non-Operating Items and Cumulative Effect of Change
in Accounting Principle 617,885 354,647 156,821 74
Non-Operating Items, net of tax (D) (9,306) (45,685) (45,685) (80)
Income Before Cumulative Effect of Change in Accounting Principle 608,579 308,962 111,136 97
Cumulative Effect of Change in Accounting Principle, net of tax (E) (165,587) - - NM
NET INCOME 442,992 308,962 111,136 43
Preferred Dividends, net of tax (26,199) (26,800) (26,800) (2)
Net Income Attributable to Common Shares $ 416,793 $ 282,162 $ 84,336 48
EARNINGS PER SHARE
Basic:
Before restructuring charges and non-operating items $ 2.01 $ 1.41 $ .75 43
Including restructuring charges and non-operating items $ 1.93 $ .95 $ .28 103
Cumulative effect of change in accounting principle, net (.55) - - NM
Total $ 1.38 $ .95 $ .28 45
Diluted:
Before restructuring charges and non-operating items (F) $ 1.87 $ 1.32 $ .72 42
Including restructuring charges and non-operating items $ 1.80 $ .90 $ .28 100
Cumulative effect of change in accounting principle, net (.50) - - NM
Total (G) $ 1.30 $ .90 $ .28 44
DIVIDENDS PER COMMON SHARE $ .44 $ .44 $ .44 -
Weighted Average Common Shares Outstanding (H) 301,932 298,295 298,295 1
Page 10
5. (A) 2002 full year: Dec. 31, 2001 to Dec. 29, 2002. (52 weeks)
2001 full year: Jan. 1, 2001 to Dec. 30, 2001. (52 weeks)
(B) Adjusted results assume the provisions of Financial Accounting Standard (quot;FASquot;) No. 142, quot;Goodwill and Other Intangible
Assets,quot; were effective Jan. 1, 2001, instead of Dec. 31, 2001. FAS 142 eliminates the amortization of goodwill and certain
other intangible assets. As a result, the full year 2001 amortization was reduced from $241.0 million to an adjusted $9.6 million.
In addition, full year 2001 equity losses decreased from $60.8 million to an adjusted $49.8 million due to the adoption of
this new standard by the Company's equity method investees. Also, due to the reduced amortization expense, most of which is
non-deductible, full year 2001 income tax expense related to operations increased from $187.0 million to an adjusted $231.7 million. In
total, full year 2001 diluted EPS, before non-operating items and restructuring charges, increased from $.72 to an adjusted $1.32.
(C) In the first quarter of 2002, the Company recorded pretax restructuring charges of $27.3 million ($16.7 million after-tax)
primarily for various cost reduction initiatives, which reduced diluted earnings per share by $.05. For the full
year 2001, the Company recorded pretax restructuring charges of $151.9 million ($92.6 million after-tax), which
reduced adjusted diluted earnings per share by $.28.
(D) The full year 2002 included the following non-operating items:
Pretax After-tax
Gain (Loss) Gain (Loss) Diluted EPS
Loss on derivatives and related investments (1) $ (165,100) $ (101,041) $ (.31)
Gain on sales of subsidiaries and investments (2) 110,088 67,374 .21
Income tax settlement adjustment (3) - 29,379 .09
Investment write-downs and other (8,199) (5,018) (.01)
Total non-operating items $ (63,211) $ (9,306) $ (.02)
The full year 2001 included the following non-operating items:
Pretax After-tax
Gain (Loss) Gain (Loss) Diluted EPS
Loss on derivatives and related investments (1) $ (7,682) $ (4,685) $ (.01)
Gain on sales of subsidiaries and investments (2) 78,358 47,791 .15
Investment write-downs and other (145,581) (88,791) (.28)
Total non-operating items $ (74,905) $ (45,685) $ (.14)
(1) Loss on derivatives and related investments relates primarily to the net change in fair values of the Company's
PHONES derivatives and related AOL Time Warner shares.
(2) For the full year 2002, gain on sales of subsidiaries and investments of $110.1 million ($67.4 million after-tax) relates primarily
to the divestiture of two Denver radio stations, KOSI-FM and KEZW-AM, which were exchanged for the assets of two television
stations, WTTV, Indianapolis, and its satellite station WTTK, Kokomo, Indiana, from Sinclair Broadcast Group. For the
full year 2001, gain on sales of subsidiaries and investments of $78.4 million ($47.8 million after-tax) relates primarily
to the sale of AOL Time Warner common stock.
(3) In full year 2002, the Company reduced its income tax liability by $29 million as a result of favorably
resolving certain federal and state income tax issues. This adjustment was recorded as a reduction of income tax expense.
(E) As a result of initially applying the new impairment provisions of FAS 142, the Company recorded a pretax charge of $271
million ($166 million after-tax) in the first quarter of 2002, which decreased diluted EPS by $.50. This cumulative effect
relates to certain of the Company's newspaper mastheads, a FCC license and a television network affiliation agreement.
Page 11
6. (F) For 2002 and adjusted 2001, diluted EPS before restructuring charges, non-operating items and the cumulative effect of change
in accounting principle was computed assuming that the Series B convertible preferred shares and the LYONs debt securities
were converted into common shares. Also, weighted average common shares outstanding was adjusted for the dilutive effect
of stock options. For actual 2001, the conversion of the LYONs debt securities was not assumed because their effect was antidilutive.
The Company has certain other convertible securities which were not included in the calculation of diluted EPS because
their effects were antidilutive. Following are the calculations for the full year:
Full Year
2001
2002 Adjusted Actual
Income before non-operating items and the cumulative effect
of change in accounting principle $ 617,885 $ 354,647 $ 156,821
Add back restructuring charges, net of tax 16,679 92,639 92,639
Additional ESOP contribution required assuming Series B
preferred shares were converted, net of tax (9,599) (10,413) (10,413)
Dividends for Series C, D-1 and D-2 preferred stock (8,189) (8,056) (8,056)
LYONs interest expense, net of tax 6,218 6,127 -
Adjusted income before restructuring charges, non-operating items
and the cumulative effect of change in accounting principle $ 622,994 $ 434,944 $ 230,991
Weighted average common shares outstanding 301,932 298,295 298,295
Assumed conversion of Series B preferred shares into common 17,132 18,263 18,263
Assumed exercise of stock options, net of common
shares assumed repurchased 6,313 5,685 5,685
Assumed conversion of LYONs debt securities 7,089 7,272 -
Adjusted weighted average common
shares outstanding 332,466 329,515 322,243
Diluted earnings per share before restructuring charges, non-operating
items and the cumulative effect of change in accounting principle $ 1.87 $ 1.32 $ .72
(G) Following is a reconciliation of income before restructuring charges, non-operating items and the cumulative effect of change
in accounting principle to net income:
Full Year 2002
Diluted
Net Income EPS
Income before restructuring charges, non-operating items
and the cumulative effect of change in accounting principle $ 634,564 $ 1.87
Restructuring charges, net of tax (16,679) (.05)
Non-operating items, net of tax (9,306) (.02)
Cumulative effect of change in accounting principle, net of tax (165,587) (.50)
Net income $ 442,992 $ 1.30
Full Year 2001
Adjusted Adjusted Actual Actual
Net Income Diluted EPS Net Income Diluted EPS
Income before restructuring charges and non-operating items $ 447,286 $ 1.32 $ 249,460 $ .72
Restructuring charges, net of tax (92,639) (.28) (92,639) (.29)
Non-operating items, net of tax (45,685) (.14) (45,685) (.15)
Net income $ 308,962 $ .90 $ 111,136 $ .28
(H) The number of common shares outstanding, in thousands, at Dec. 29, 2002 was 305,909.
Page 12
7. TRIBUNE COMPANY
BUSINESS SEGMENT DATA (Unaudited)
(In thousands)
FOURTH QUARTER
2002 vs. 2001
2001 Adjusted
2002 Adjusted (A) Actual % Change
PUBLISHING
Operating Revenues $ 1,039,520 $ 982,753 $ 982,753 6
Cash Operating Expenses (B) (754,466) (759,795) (759,795) (1)
EBITDA before Restructuring Charges (C) 285,054 222,958 222,958 28
Depreciation and Amortization Expense (43,204) (38,942) (76,611) 11
Operating Profit before Restructuring Charges 241,850 184,016 146,347 31
Restructuring Charges - (4,465) (4,465) (100)
Total Operating Profit $ 241,850 $ 179,551 $ 141,882 35
BROADCASTING AND ENTERTAINMENT
Operating Revenues
Television $ 339,483 $ 278,791 $ 278,791 22
Radio/Entertainment 31,697 40,011 40,011 (21)
Total Operating Revenues 371,180 318,802 318,802 16
Cash Operating Expenses (B)
Television (196,916) (179,751) (179,751) 10
Radio/Entertainment (30,580) (28,113) (28,113) 9
Total Cash Operating Expenses (227,496) (207,864) (207,864) 9
EBITDA before Restructuring Charges (C)
Television 142,567 99,040 99,040 44
Radio/Entertainment 1,117 11,898 11,898 (91)
Total EBITDA before Restructuring Charges 143,684 110,938 110,938 30
Depreciation and Amortization Expense
Television (11,037) (9,995) (28,511) 10
Radio/Entertainment (1,533) (1,085) (1,191) 41
Total Depreciation and Amortization Expense (12,570) (11,080) (29,702) 13
Operating Profit (Loss)
Television 131,530 89,045 70,529 48
Radio/Entertainment (416) 10,813 10,707 NM
Total before Restructuring Charges 131,114 99,858 81,236 31
Restructuring Charges - (2,210) (2,210) (100)
Total Operating Profit $ 131,114 $ 97,648 $ 79,026 34
INTERACTIVE
Operating Revenues $ 19,043 $ 16,302 $ 16,302 17
Cash Operating Expenses (B) (19,260) (19,994) (19,994) (4)
EBITDA before Restructuring Charges (C) (217) (3,692) (3,692) (94)
Depreciation and Amortization Expense (1,351) (1,304) (3,062) 4
Operating Loss before Restructuring Charges (1,568) (4,996) (6,754) (69)
Restructuring Charges - (5) (5) (100)
Total Operating Loss $ (1,568) $ (5,001) $ (6,759) (69)
CORPORATE EXPENSES
EBITDA before Restructuring Charges (C) $ (12,056) $ (8,292) $ (8,292) 45
Depreciation and Amortization Expense (521) (436) (436) 19
Operating Loss before Restructuring Charges (12,577) (8,728) (8,728) 44
Restructuring Charges - (212) (212) (100)
Total Operating Loss $ (12,577) $ (8,940) $ (8,940) 41
CONSOLIDATED
Operating Revenues $ 1,429,743 $ 1,317,857 $ 1,317,857 8
Cash Operating Expenses (B) (1,013,278) (995,945) (995,945) 2
EBITDA before Restructuring Charges (C) 416,465 321,912 321,912 29
Depreciation and Amortization Expense (57,646) (51,762) (109,811) 11
Operating Profit before Restructuring Charges 358,819 270,150 212,101 33
Restructuring Charges - (6,892) (6,892) (100)
Total Operating Profit $ 358,819 $ 263,258 $ 205,209 36
(A) Adjusted results assume the provisions of Financial Accounting Standard (quot;FASquot;) No. 142 were
effective Jan. 1, 2001. FAS 142 eliminates the amortization of goodwill and certain other intangible assets.
(B) Cash operating expenses exclude restructuring charges.
(C) EBITDA is earnings before interest, taxes, depreciation, amortization of intangible assets, equity
results and non-operating items. The Company's definition of EBITDA may not be consistent with that of other
companies. EBITDA does not represent cash provided by operating activities as reflected in the Company's consolidated
statements of cash flows, is not a measure of financial performance under generally accepted accounting principles (quot;GAAPquot;)
and should not be considered in isolation or as a substitute for measures of performance prepared in accordance with GAAP.
Page 13
8. TRIBUNE COMPANY
BUSINESS SEGMENT DATA (Unaudited)
(In thousands)
FULL YEAR
2002 vs. 2001
2001 Adjusted
2002 Adjusted (A) Actual % Change
PUBLISHING
Operating Revenues $ 3,863,779 $ 3,843,949 $ 3,843,949 1
Cash Operating Expenses (B) (2,847,012) (2,993,219) (2,993,219) (5)
EBITDA before Restructuring Charges (C) 1,016,767 850,730 850,730 20
Depreciation and Amortization Expense (168,484) (157,306) (307,788) 7
Operating Profit before Restructuring Charges 848,283 693,424 542,942 22
Restructuring Charges (24,760) (140,409) (140,409) (82)
Total Operating Profit $ 823,523 $ 553,015 $ 402,533 49
BROADCASTING AND ENTERTAINMENT
Operating Revenues
Television $ 1,221,637 $ 1,130,125 $ 1,130,125 8
Radio/Entertainment 222,313 219,810 219,810 1
Total Operating Revenues 1,443,950 1,349,935 1,349,935 7
Cash Operating Expenses (B)
Television (727,544) (704,150) (704,150) 3
Radio/Entertainment (199,471) (193,417) (193,417) 3
Total Cash Operating Expenses (927,015) (897,567) (897,567) 3
EBITDA before Restructuring Charges (C)
Television 494,093 425,975 425,975 16
Radio/Entertainment 22,842 26,393 26,393 (13)
Total EBITDA before Restructuring Charges 516,935 452,368 452,368 14
Depreciation and Amortization Expense
Television (40,646) (40,499) (114,034) -
Radio/Entertainment (6,151) (4,650) (5,069) 32
Total Depreciation and Amortization Expense (46,797) (45,149) (119,103) 4
Operating Profit
Television 453,447 385,476 311,941 18
Radio/Entertainment 16,691 21,743 21,324 (23)
Total before Restructuring Charges 470,138 407,219 333,265 15
Restructuring Charges (1,087) (6,567) (6,567) (83)
Total Operating Profit $ 469,051 $ 400,652 $ 326,698 17
INTERACTIVE
Operating Revenues $ 76,699 $ 59,482 $ 59,482 29
Cash Operating Expenses (B) (67,979) (79,429) (79,429) (14)
EBITDA before Restructuring Charges (C) 8,720 (19,947) (19,947) NM
Depreciation and Amortization Expense (5,586) (5,359) (12,391) 4
Operating Profit (Loss) before Restructuring Charges 3,134 (25,306) (32,338) NM
Restructuring Charges (163) (2,922) (2,922) (94)
Total Operating Profit (Loss) $ 2,971 $ (28,228) $ (35,260) NM
CORPORATE EXPENSES
EBITDA before Restructuring Charges (C) $ (43,383) $ (39,056) $ (39,056) 11
Depreciation and Amortization Expense (2,387) (2,584) (2,584) (8)
Operating Loss before Restructuring Charges (45,770) (41,640) (41,640) 10
Restructuring Charges (1,243) (1,994) (1,994) (38)
Total Operating Loss $ (47,013) $ (43,634) $ (43,634) 8
CONSOLIDATED
Operating Revenues $ 5,384,428 $ 5,253,366 $ 5,253,366 2
Cash Operating Expenses (B) (3,885,389) (4,009,271) (4,009,271) (3)
EBITDA before Restructuring Charges (C) 1,499,039 1,244,095 1,244,095 20
Depreciation and Amortization Expense (223,254) (210,398) (441,866) 6
Operating Profit before Restructuring Charges 1,275,785 1,033,697 802,229 23
Restructuring Charges (27,253) (151,892) (151,892) (82)
Total Operating Profit $ 1,248,532 $ 881,805 $ 650,337 42
(A) Adjusted results assume the provisions of Financial Accounting Standard (quot;FASquot;) No. 142 were
effective Jan. 1, 2001. FAS 142 eliminates the amortization of goodwill and certain other intangible assets.
(B) Cash operating expenses exclude restructuring charges.
(C) EBITDA is earnings before interest, taxes, depreciation, amortization of intangible assets, equity
results and non-operating items. The Company's definition of EBITDA may not be consistent with that of other
companies. EBITDA does not represent cash provided by operating activities as reflected in the Company's consolidated
statements of cash flows, is not a measure of financial performance under generally accepted accounting principles (quot;GAAPquot;)
and should not be considered in isolation or as a substitute for measures of performance prepared in accordance with GAAP.
Page 14
9. TRIBUNE COMPANY
SUMMARY OF REVENUES (Unaudited)
For Fourth Quarter Ended December 29, 2002
(In thousands)
Fourth Quarter (13 weeks) Year-to-Date (52 weeks)
% %
2002 2001 Change 2002 2001 Change
Publishing
Advertising
$ 380,154 $ 358,513 $ 1,269,188 $ 1,230,608
Retail 6 3
703,837 675,281
National 200,249 175,519 14 4
975,374 1,041,429
Classified 225,224 217,320 4 (6)
805,627 751,352 2,948,399 2,947,318
Sub-Total 7 -
669,471 662,377
Circulation 168,021 167,670 - 1
245,909 234,254
Other 65,872 63,731 3 5
Segment Total (A) (B) 1,039,520 982,753 6 3,863,779 3,843,949 1
Broadcasting & Entertainment
1,221,637 1,130,125
Television (C) 339,483 278,791 22 8
222,313 219,810
Radio/Entertainment 31,697 40,011 (21) 1
Segment Total (D) 371,180 318,802 16 1,443,950 1,349,935 7
76,699 59,482
19,043 16,302 17 29
Interactive
$ 1,429,743 $ 1,317,857 8 $ 5,384,428 $ 5,253,366 2
Consolidated Revenues (E)
(A) Publishing revenues for 2001 have been reclassified to conform with the 2002 presentation. There was no effect on total revenues.
(B) Includes Virginia Gazette , acquired in February 2001, TV Data, acquired in May 2001, and Chicago magazine, acquired in July 2002.
Excluding these acquisitions, publishing revenues increased 5% for the quarter and were flat for the year-to-date. Excluding these
acquisitions, retail revenues increased 5% for the quarter and 3% for the year-to-date. Excluding these acquisitions, national revenues
increased 14% for the quarter and 4% for the year-to-date. Excluding these acquisitions, total advertising revenues increased 7% for the
quarter and were flat for the year-to-date.
(C) Includes Tower Distribution (formerly United Video), WGN Cable's distribution entity, which was acquired in April 2001, WTXX-Hartford,
acquired in August 2001, and WTTV-Indianapolis, acquired in July 2002. Excluding these acquisitions, television revenues increased 21%
for the quarter and 7% for the year-to-date. Fourth quarter includes copyright royalties of $1.0 million in 2002 and $1.6 million in 2001.
Year-to-date includes copyright royalties of $4.2 million in 2002 and $29.9 million in 2001. Excluding acquisitions and copyright royalties,
television revenues increased 21% for the quarter and 9% for the year-to-date.
(D) Excluding acquisitions and copyright royalties, broadcasting and entertainment revenues increased 15% for the quarter and 8% for the
year-to-date.
(E) Excluding acquisitions and copyright royalties, consolidated revenues increased 8% for the quarter and 2% for the year-to-date.
15
10. TRIBUNE COMPANY
SUMMARY OF NEWSPAPER ADVERTISING VOLUME (Unaudited) (A)
For Fourth Quarter Ended December 29, 2002
(In thousands)
Fourth Quarter (13 weeks) Year-to-Date (52 weeks)
% %
2002 2001 Change 2002 2001 Change
Full Run
737 707 2,587 2,677
L.A. Times 4 (3)
616 553 2,191 2,169
Chicago Tribune 11 1
396 423 1,588 1,683
Newsday (6) (6)
3,556 3,587 13,514 13,905
Other Daily Newspapers (B) (1) (3)
5,305 5,270 19,880 20,434
Total 1 (3)
Part Run
1,485 1,411 5,687 5,201
L.A. Times 5 9
1,383 1,337 5,475 5,545
Chicago Tribune 3 (1)
459 430 1,711 1,650
Newsday 7 4
1,508 1,481 6,056 6,033
Other Daily Newspapers (B) 2 -
4,835 4,659 18,929 18,429
Total 4 3
Total Advertising Inches
Full Run
1,861 1,917 6,258 6,580
Retail (3) (5)
972 874 3,406 3,347
National 11 2
2,472 2,479 10,216 10,507
Classified - (3)
5,305 5,270 19,880 20,434
Sub-Total 1 (3)
Part Run 4,835 4,659 4 18,929 18,429 3
Total 10,140 9,929 2 38,809 38,863 -
Preprint Pieces
605,700 584,402 1,985,563 1,882,891
L.A. Times 4 5
933,758 774,547 3,138,907 2,718,692
Chicago Tribune 21 15
828,932 757,073 2,823,513 2,713,323
Newsday 9 4
1,086,226 1,008,104 3,700,712 3,433,500
Other Daily Newspapers (B) 8 8
3,454,616 3,124,126
Total 11 11,648,695 10,748,406 8
(A) Volume for 2001 has been modified to conform with the 2002 presentation. Volume is based on preliminary internal data,
which may be updated in subsequent reports. Advertising volume is presented only for daily newspapers.
(B) Other daily newspapers include The Baltimore Sun, South Florida Sun-Sentinel, Orlando Sentinel, The Hartford Courant, The
Morning Call, Daily Press, The Advocate and Greenwich Time.
16
11. TRIBUNE COMPANY
SUMMARY OF REVENUES (Unaudited)
For Period 12 Ended December 29, 2002
(In thousands)
Period 12 (5 weeks) Year-to-Date (52 weeks)
% %
2002 2001 Change 2002 2001 Change
Publishing
Advertising
$ 167,949 $ 146,134 $ 1,269,188 $ 1,230,608
Retail 15 3
703,837 675,281
National 79,289 68,061 16 4
975,374 1,041,429
Classified 72,612 70,667 3 (6)
319,850 284,862 2,948,399 2,947,318
Sub-Total 12 -
63,758 63,401 669,471 662,377
Circulation 1 1
245,909 234,254
Other 23,880 22,859 4 5
Segment Total (A) (B) 407,488 371,122 10 3,863,779 3,843,949 1
Broadcasting & Entertainment
122,200 97,859 1,221,637 1,130,125
Television (C) 25 8
12,441 15,134 222,313 219,810
Radio/Entertainment (18) 1
Segment Total (D) 134,641 112,993 19 1,443,950 1,349,935 7
76,699 59,482
6,131 5,573 10 29
Interactive
$ 548,260 $ 489,688 12 $ 5,384,428 $ 5,253,366 2
Consolidated Revenues (E)
(A) Publishing revenues for 2001 have been reclassified to conform with the 2002 presentation. There was no effect on total revenues.
(B) Includes Virginia Gazette , acquired in February 2001, TV Data, acquired in May 2001, and Chicago magazine, acquired in July 2002.
Excluding these acquisitions, publishing revenues increased 9% for the period and were flat for the year-to-date. Excluding these
acquisitions, retail revenues increased 14% for the period and 3% for the year-to-date. Excluding these acquisitions, national revenues
increased 16% for the period and 4% for the year-to-date. Excluding these acquisitions, total advertising revenues increased 12% for the
period and were flat for the year-to-date.
(C) Includes Tower Distribution (formerly United Video), WGN Cable's distribution entity, which was acquired in April 2001, WTXX-Hartford,
acquired in August 2001, and WTTV-Indianapolis, acquired in July 2002. Excluding these acquisitions, television revenues increased 23%
for the period and 7% for the year-to-date. Period 12 includes copyright royalties of $0.4 million in 2002 and $1.0 million in 2001.
Year-to-date includes copyright royalties of $4.2 million in 2002 and $29.9 million in 2001. Excluding acquisitions and copyright royalties,
television revenues increased 24% for the period and 9% for the year-to-date.
(D) Excluding acquisitions and copyright royalties, broadcasting and entertainment revenues increased 18% for the period and 8% for the
year-to-date.
(E) Excluding acquisitions and copyright royalties, consolidated revenues increased 11% for the period and 2% for the year-to-date.
17
12. TRIBUNE COMPANY
SUMMARY OF NEWSPAPER ADVERTISING VOLUME (Unaudited) (A)
For Period 12 Ended December 29, 2002
(In thousands)
Period 12 (5 weeks) Year-to-Date (52 weeks)
% %
2002 2001 Change 2002 2001 Change
Full Run
329 295 2,587 2,677
L.A. Times 12 (3)
246 206 2,191 2,169
Chicago Tribune 19 1
144 152 1,588 1,683
Newsday (5) (6)
1,381 1,323 13,514 13,905
Other Daily Newspapers (B) 4 (3)
2,100 1,976 19,880 20,434
Total 6 (3)
Part Run
562 527 5,687 5,201
L.A. Times 7 9
465 433 5,475 5,545
Chicago Tribune 7 (1)
160 155 1,711 1,650
Newsday 3 4
553 553 6,056 6,033
Other Daily Newspapers (B) - -
1,740 1,668 18,929 18,429
Total 4 3
Total Advertising Inches
Full Run
840 788 6,258 6,580
Retail 7 (5)
392 335 3,406 3,347
National 17 2
868 853 10,216 10,507
Classified 2 (3)
2,100 1,976 19,880 20,434
Sub-Total 6 (3)
Part Run 1,740 1,668 4 18,929 18,429 3
Total 3,840 3,644 5 38,809 38,863 -
Preprint Pieces
283,148 252,304 1,985,563 1,882,891
L.A. Times 12 5
396,610 305,144 3,138,907 2,718,692
Chicago Tribune 30 15
352,261 298,518 2,823,513 2,713,323
Newsday 18 4
471,079 407,691 3,700,712 3,433,500
Other Daily Newspapers (B) 16 8
1,503,098 1,263,657
Total 19 11,648,695 10,748,406 8
(A) Volume for 2001 has been modified to conform with the 2002 presentation. Volume is based on preliminary internal data,
which may be updated in subsequent reports. Advertising volume is presented only for daily newspapers.
(B) Other daily newspapers include The Baltimore Sun, South Florida Sun-Sentinel, Orlando Sentinel, The Hartford Courant, The
Morning Call, Daily Press, The Advocate and Greenwich Time.
18