call girls in Nand Nagri (DELHI) 🔝 >༒9953330565🔝 genuine Escort Service 🔝✔️✔️
tribune earnings_q2_05_tables
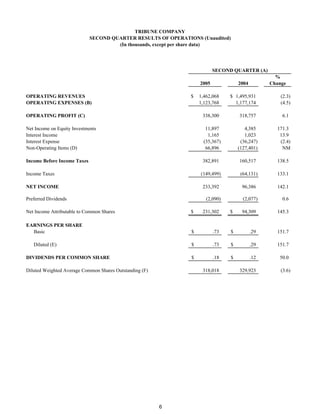
1. TRIBUNE COMPANY
SECOND QUARTER RESULTS OF OPERATIONS (Unaudited)
(In thousands, except per share data)
SECOND QUARTER (A)
%
2005 2004 Change
OPERATING REVENUES $ 1,462,068 $ 1,495,931 (2.3)
OPERATING EXPENSES (B) 1,123,768 1,177,174 (4.5)
OPERATING PROFIT (C) 338,300 318,757 6.1
Net Income on Equity Investments 11,897 4,385 171.3
Interest Income 1,165 1,023 13.9
Interest Expense (35,367) (36,247) (2.4)
Non-Operating Items (D) 66,896 (127,401) NM
Income Before Income Taxes 382,891 160,517 138.5
Income Taxes (149,499) (64,131) 133.1
NET INCOME 233,392 96,386 142.1
Preferred Dividends (2,090) (2,077) 0.6
Net Income Attributable to Common Shares $ 231,302 $ 94,309 145.3
EARNINGS PER SHARE
Basic $ .73 $ .29 151.7
Diluted (E) $ .73 $ .29 151.7
DIVIDENDS PER COMMON SHARE $ .18 $ .12 50.0
Diluted Weighted Average Common Shares Outstanding (F) 318,018 329,923 (3.6)
6
2. (A) 2005 second quarter: March 28, 2005 to June 26, 2005 (13 weeks)
2004 second quarter: March 29, 2004 to June 27, 2004 (13 weeks)
(B) Operating expenses for the second quarter of 2004 included a charge of $17 million, or $.03 per diluted share,
for the elimination of 375 positions in the publishing group and a charge of $35 million, or $.06 per diluted share,
as the initial estimate of the cost to settle with advertisers regarding misstated circulation at Newsday
and Hoy , New York.
(C) Operating profit excludes interest income and expense, equity income and losses, non-operating items and income
taxes.
(D) The second quarter of 2005 included the following non-operating items:
Pretax After-tax
Gain Gain Diluted EPS
Gain on derivatives and related investments (1) $ 61,803 $ 37,700 $ .12
Other, net 5,093 3,107 .01
Total non-operating items $ 66,896 $ 40,807 $ .13
The second quarter of 2004 included the following non-operating items:
Pretax After-tax
Gain (Loss) Gain (Loss) Diluted EPS
Gain on derivatives and related investments (1) $ 20,229 $ 12,340 $ .04
Loss on early debt retirement (2) (140,506) (87,549) (.26)
Other, net (7,124) (4,346) (.02)
Total non-operating items $ (127,401) $ (79,555) $ (.24)
(1) Gain on derivatives and related investments represents the net change in fair values of the Company's PHONES
derivatives and related Time Warner shares.
(2) Loss on early debt retirement resulted from the retirement of $620 million of debt in the second quarter of 2004 at a cash
premium of $137 million.
(E) For the second quarters of 2005 and 2004, weighted average common shares outstanding used in the calculation of diluted
earnings per share (quot;EPSquot;) were adjusted for the dilutive effect of stock options. The Company's Series C, D-1 and D-2
convertible preferred shares were not included in the calculation of diluted EPS for the second quarter of either year because
their effects were antidilutive. Following are the calculations for the second quarter:
Second Quarter
2005 2004
Net income $ 233,392 $ 96,386
Dividends for Series C, D-1 and D-2 preferred stock (2,090) (2,077)
Net income attributable to common shares $ 231,302 $ 94,309
Weighted average common shares outstanding 315,466 324,296
Assumed exercise of stock options, net of common
shares assumed repurchased 2,552 5,627
Adjusted weighted average common
shares outstanding 318,018 329,923
Diluted earnings per share $ .73 $ .29
(F) The number of common shares outstanding, in thousands, at June 26, 2005 was 312,619.
7
3. TRIBUNE COMPANY
FIRST HALF RESULTS OF OPERATIONS (Unaudited)
(In thousands, except per share data)
FIRST HALF (A)
%
2005 2004 Change
OPERATING REVENUES $ 2,777,812 $ 2,828,248 (1.8)
OPERATING EXPENSES (B) 2,187,455 2,236,216 (2.2)
OPERATING PROFIT (C) 590,357 592,032 (0.3)
Net Income on Equity Investments 12,368 12 NM
Interest Income 2,247 2,299 (2.3)
Interest Expense (70,458) (82,925) (15.0)
Non-Operating Items (D) 63,052 (153,980) NM
Income Before Income Taxes 597,566 357,438 67.2
Income Taxes (D) (221,329) (140,372) 57.7
NET INCOME 376,237 217,066 73.3
Preferred Dividends (4,180) (4,154) 0.6
Net Income Attributable to Common Shares $ 372,057 $ 212,912 74.7
EARNINGS PER SHARE
Basic $ 1.18 $ .65 81.5
Diluted (E) $ 1.17 $ .64 82.8
DIVIDENDS PER COMMON SHARE $ .36 $ .24 50.0
Diluted Weighted Average Common Shares Outstanding (F) 319,169 333,005 (4.2)
8
4. (A) 2005 first half: Dec. 27, 2004 to June 26, 2005 (26 weeks)
2004 first half: Dec. 29, 2003 to June 27, 2004 (26 weeks)
(B) Operating expenses for the first half of 2004 included a charge of $17 million, or $.03 per diluted share, for the elimination
of 375 positions in the publishing group and a charge of $35 million, or $.06 per diluted share, as the initial estimate of the
cost to settle with advertisers regarding misstated circulation at Newsday and Hoy , New York.
(C) Operating profit excludes interest income and expense, equity income and losses, non-operating items and income
taxes.
(D) The first half of 2005 included the following non-operating items:
Pretax After-tax
Gain Gain Diluted EPS
Gain on derivatives and related investments (1) $ 59,551 $ 36,326 $ .12
Other, net 3,501 2,136 .01
Income tax settlement adjustments (2) - 11,829 .03
Total non-operating items $ 63,052 $ 50,291 $ .16
The first half of 2004 included the following non-operating items:
Pretax After-tax
Gain (Loss) Gain (Loss) Diluted EPS
Loss on derivatives and related investments (1) $ (25,272) $ (15,416) $ (.04)
Loss on early debt retirement (3) (140,506) (87,549) (.26)
Gain on sales of subsidiaries and investments, net (4) 18,874 11,513 .03
Other, net (7,076) (4,316) (.02)
Total non-operating items $ (153,980) $ (95,768) $ (.29)
(1) Gain (loss) on derivatives and related investments represents the net change in fair values of the Company's PHONES
derivatives and related Time Warner shares.
(2) In the first quarter of 2005, the Company reduced its income tax expense and liabilities by a total of $12 million as
a result of favorably resolving certain federal income tax issues.
(3) Loss on early debt retirement resulted from the retirement of $620 million of debt in the second quarter of 2004 at a cash
premium of $137 million.
(4) In the first half of 2004, gain on sales of subsidiaries and investments related primarily to the sale of the
Company's 50% interest in La Opinion .
9
5. (E) For the first halves of 2005 and 2004, weighted average common shares outstanding used in the calculation of diluted
earnings per share (quot;EPSquot;) were adjusted for the dilutive effect of stock options. The Company's Series C, D-1 and D-2
convertible preferred shares were not included in the calculation of diluted EPS for the first half of either year because
their effects were antidilutive. Following are the calculations for the first half:
First Half
2005 2004
Net income $ 376,237 $ 217,066
Dividends for Series C, D-1 and D-2 preferred stock (4,180) (4,154)
Net income attributable to common shares $ 372,057 $ 212,912
Weighted average common shares outstanding 316,387 326,799
Assumed exercise of stock options, net of common
shares assumed repurchased 2,782 6,206
Adjusted weighted average common
shares outstanding 319,169 333,005
Diluted earnings per share $ 1.17 $ .64
(F) The number of common shares outstanding, in thousands, at June 26, 2005 was 312,619.
10
7. (A) The Company uses cash operating expenses to evaluate internal performance. The Company has presented cash operating expenses because
it is a common measure used by rating agencies, financial analysts and investors. Cash operating expense is not a measure of financial
performance under generally accepted accounting principles (quot;GAAPquot;) and should not be considered in isolation or as a substitute for
measures of performance prepared in accordance with GAAP.
Following is a reconciliation of operating expenses to cash operating expenses for the second quarter of 2005:
Broadcasting and
Publishing Entertainment Corporate Consolidated
Operating expenses $ 820,973 $ 289,323 $ 13,472 $ 1,123,768
Less: depreciation and amortization expense 45,210 12,485 406 58,101
Cash operating expenses $ 775,763 $ 276,838 $ 13,066 $ 1,065,667
Following is a reconciliation of operating expenses to cash operating expenses for the second quarter of 2004:
Broadcasting and
Publishing Entertainment Corporate Consolidated
Operating expenses $ 874,813 $ 289,656 $ 12,705 $ 1,177,174
Less: depreciation and amortization expense 46,148 13,257 408 59,813
Cash operating expenses $ 828,665 $ 276,399 $ 12,297 $ 1,117,361
Following is a reconciliation of operating expenses to cash operating expenses for the first half of 2005:
Broadcasting and
Publishing Entertainment Corporate Consolidated
Operating expenses $ 1,627,946 $ 532,589 $ 26,920 $ 2,187,455
Less: depreciation and amortization expense 89,856 25,331 807 115,994
Cash operating expenses $ 1,538,090 $ 507,258 $ 26,113 $ 2,071,461
Following is a reconciliation of operating expenses to cash operating expenses for the first half of 2004:
Broadcasting and
Publishing Entertainment Corporate Consolidated
Operating expenses $ 1,688,848 $ 521,771 $ 25,597 $ 2,236,216
Less: depreciation and amortization expense 91,241 26,353 829 118,423
Cash operating expenses $ 1,597,607 $ 495,418 $ 24,768 $ 2,117,793
(B) Publishing cash operating expenses for both the second quarter and first half of 2004 included a charge of $17 million for the elimination of
375 positions and a charge of $35 million as the initial estimate of the cost to settle with advertisers regarding misstated circulation aNewsday
and Hoy , New York.
(C) Operating cash flow is defined as operating profit before depreciation and amortization. The Company uses operating cash flow along with
operating profit and other measures to evaluate the financial performance of the Company's business segments. The Company has
presented operating cash flow because it is a common alternative measure of financial performance used by rating agencies, financial analysts
and investors. These groups use operating cash flow along with other measures as a way to estimate the value of a company. The
Company's definition of operating cash flow may not be consistent with that of other companies. Operating cash flow does not represent
cash provided by operating activities as reflected in the Company's consolidated statements of cash flows, is not a measure of financial
performance under GAAP and should not be considered in isolation or as a substitute for measures of performance prepared in accordance
with GAAP.
12
8. (D) Operating profit for each segment excludes interest income and expense, equity income and losses, non-operating items and income taxes.
Following is a reconciliation of operating profit (loss) to operating cash flow for the second quarter of 2005:
Broadcasting and
Publishing Entertainment Corporate Consolidated
Operating profit (loss) $ 217,651 $ 134,121 $ (13,472) $ 338,300
Add back: depreciation and amortization expense 45,210 12,485 406 58,101
Operating cash flow $ 262,861 $ 146,606 $ (13,066) $ 396,401
Following is a reconciliation of operating profit (loss) to operating cash flow for the second quarter of 2004:
Broadcasting and
Publishing Entertainment Corporate Consolidated
Operating profit (loss) $ 171,051 $ 160,411 $ (12,705) $ 318,757
Add back: depreciation and amortization expense 46,148 13,257 408 59,813
Operating cash flow $ 217,199 $ 173,668 $ (12,297) $ 378,570
Following is a reconciliation of operating profit (loss) to operating cash flow for the first half of 2005:
Broadcasting and
Publishing Entertainment Corporate Consolidated
Operating profit (loss) $ 416,190 $ 201,087 $ (26,920) $ 590,357
Add back: depreciation and amortization expense 89,856 25,331 807 115,994
Operating cash flow $ 506,046 $ 226,418 $ (26,113) $ 706,351
Following is a reconciliation of operating profit (loss) to operating cash flow for the first half of 2004:
Broadcasting and
Publishing Entertainment Corporate Consolidated
Operating profit (loss) $ 360,599 $ 257,030 $ (25,597) $ 592,032
Add back: depreciation and amortization expense 91,241 26,353 829 118,423
Operating cash flow $ 451,840 $ 283,383 $ (24,768) $ 710,455
13
9. TRIBUNE COMPANY
SUMMARY OF REVENUES (Unaudited)
For Period 6 and Second Quarter Ended June 26, 2005
(In thousands)
Period 6 (5 weeks) Second Quarter (13 weeks) Year-to-Date (26 weeks)
% % %
2005 2004 Change 2005 2004 Change 2005 2004 Change
Publishing
Advertising
$ 129,511 $ 132,124 $ 331,637 $ 335,572 $ 635,821 $ 630,901
Retail (2.0) (1.2) 0.8
National 75,242 75,386 (0.2) 190,256 197,765 (3.8) 390,770 401,600 (2.7)
Classified 113,046 108,570 4.1 301,037 284,508 5.8 583,808 559,704 4.3
317,799 316,080 822,930 817,845 1,610,399 1,592,205
Sub-Total 0.5 0.6 1.1
56,777 62,571
Circulation (9.3) 149,918 165,006 (9.1) 301,634 330,909 (8.8)
Other 23,914 23,355 2.4 65,776 63,013 4.4 132,103 126,333 4.6
Segment Total (A) 398,490 402,006 (0.9) 1,038,624 1,045,864 (0.7) 2,044,136 2,049,447 (0.3)
Broadcasting & Entertainment
128,406 145,548
Television (11.8) 334,505 367,928 (9.1) 624,594 674,367 (7.4)
39,840 34,391
Radio/Entertainment 15.8 88,939 82,139 8.3 109,082 104,434 4.5
168,246 179,939 423,444 450,067 733,676 778,801
Segment Total (6.5) (5.9) (5.8)
$ 566,736 $ 581,945 (2.6) $ 1,462,068 $ 1,495,931 (2.3) $ 2,777,812 $ 2,828,248 (1.8)
Consolidated Revenues
(A) Publishing advertising and other revenues for 2004 have been reclassified to conform with the 2005 presentation. There was no effect on total revenues.
14
10. TRIBUNE COMPANY
SUMMARY OF NEWSPAPER ADVERTISING VOLUME (Unaudited) (A)
For Period 6 and Second Quarter Ended June 26, 2005
(In thousands)
Period 6 (5 weeks) Second Quarter (13 weeks) Year-to-Date (26 weeks)
% % %
2005 2004 Change 2005 2004 Change 2005 2004 Change
Full Run
215 243 540 603 1,120 1,221
L.A. Times (11.5) (10.4) (8.3)
204 224 519 578 1,021 1,123
Chicago Tribune (8.9) (10.2) (9.1)
165 171 414 418 764 774
Newsday (3.5) (1.0) (1.3)
1,375 1,431 3,548 3,681 6,848 7,205
Other Daily Newspapers (B) (3.9) (3.6) (5.0)
1,959 2,069 5,021 5,280 9,753 10,323
Total (5.3) (4.9) (5.5)
Part Run
552 600 1,357 1,462 2,669 2,907
L.A. Times (8.0) (7.2) (8.2)
715 656 1,807 1,678 3,479 3,231
Chicago Tribune 9.0 7.7 7.7
216 205 568 524 1,029 950
Newsday 5.4 8.4 8.3
605 603 1,660 1,594 3,237 3,134
Other Daily Newspapers (B) 0.3 4.1 3.3
2,088 2,064 5,392 5,258 10,414 10,222
Total 1.2 2.5 1.9
Total Advertising Inches
Full Run
581 610 1,494 1,559 2,879 2,937
Retail (4.8) (4.2) (2.0)
362 386 922 996 1,888 1,990
National (6.2) (7.4) (5.1)
1,016 1,073 2,605 2,725 4,986 5,396
Classified (5.3) (4.4) (7.6)
1,959 2,069 5,021 5,280 9,753 10,323
Sub-Total (5.3) (4.9) (5.5)
10,414 10,222
Part Run 2,088 2,064 1.2 5,392 5,258 2.5 1.9
4,047 4,133 10,413 10,538 20,167 20,545
Total (2.1) (1.2) (1.8)
Preprint Pieces
377,224 356,511 947,042 884,310 1,837,938 1,640,073
L.A. Times 5.8 7.1 12.1
402,578 393,370 1,050,468 994,477 1,957,675 1,871,227
Chicago Tribune 2.3 5.6 4.6
265,029 281,287 715,628 720,813 1,395,516 1,370,263
Newsday (5.8) (0.7) 1.8
393,583 391,820 1,013,152 1,010,244 2,006,911 2,002,447
Other Daily Newspapers (B) 0.4 0.3 0.2
3,726,290 3,609,844 7,198,040 6,884,010
Total 1,438,414 1,422,988 1.1 3.2 4.6
(A) Volume for 2004 has been modified to conform with the 2005 presentation. Volume is based on preliminary internal data,
which may be updated in subsequent reports. Advertising volume is presented only for daily newspapers.
(B) Other daily newspapers include The Baltimore Sun, South Florida Sun-Sentinel, Orlando Sentinel, The Hartford Courant,
The Morning Call, Daily Press, The Advocate, Greenwich Time, Hoy, New York, Hoy, Chicago, and Hoy, Los Angeles.
15