This document summarizes Tribune Company's fourth quarter and full year 2005 results. Key details include:
- Operating revenues decreased 4.7% in the fourth quarter and 2.3% for the full year compared to the previous year.
- Operating expenses increased 2.7% in the fourth quarter due to restructuring charges but decreased 1.3% for the full year.
- Net income decreased 38.0% in the fourth quarter and 3.8% for the full year from the previous year.
The Tribune Company reported its fourth quarter and full year 2004 results. For the fourth quarter, operating revenues increased 1% to $1.48 billion while operating expenses rose 4.3% to $1.12 billion, decreasing operating profit by 7.9%. Net income declined 35.9% to $216.8 million due to lower non-operating gains. For the full year, operating revenues grew 2.4% to $6.1 billion but operating expenses increased 3.5%, reducing operating profit growth to 0.6%. Net income fell 26.5% to $849.4 million due to decreased non-operating gains.
Tribune Company reported financial results for the fourth quarter of 2006 with increases in operating revenues and income from continuing operations compared to the same period in 2005. Operating revenues grew 5.4% to $1.47 billion driven by increases in publishing and broadcasting revenues. Income from continuing operations increased 76.9% to $232.1 million due to higher operating profit and non-operating gains, partially offset by higher interest expense. Net income attributable to common shares grew 80.6% to $239.1 million. Earnings per share increased significantly for both basic and diluted amounts.
The document summarizes Tribune Company's financial results for the third quarter and first three quarters of 2005 compared to the same periods in 2004. Key points:
- Operating revenues and operating profit increased in the third quarter of 2005 but decreased for the first three quarters compared to the prior year.
- Net income decreased significantly for the third quarter but increased for the first three quarters of 2005 versus 2004.
- Earnings per share decreased substantially for the third quarter but increased for the first three quarters compared to the previous year.
Tribune Company reported its fourth quarter and full year 2002 results. For the fourth quarter, revenues increased 8% year-over-year and net income increased 24%. Operating profit before restructuring charges increased 33% due to cost reductions. For the full year, revenues increased 2% and net income increased 43% due to restructuring initiatives and asset sales. Earnings per share increased 22% in the fourth quarter and 45% for the full year, reflecting continued improvement.
The document summarizes Tribune Company's financial results for the third quarter and first three quarters of 2006 compared to the same periods in 2005. Some key highlights:
- Operating revenues and operating profit declined in the third quarter of 2006 compared to 2005, while operating expenses increased slightly.
- Non-operating items contributed significantly to net income in the third quarter of 2006, driven largely by gains from partnerships restructurings and asset sales.
- Income from continuing operations increased substantially, while income from discontinued operations (tv station sales) declined.
- Earnings per share increased for the third quarter and first three quarters of 2006 compared to 2005 periods.
Tribune Company reported first quarter results for 2005. Operating revenues decreased 1.2% compared to the same period last year. Operating profit decreased 7.8% due to higher operating expenses and non-operating losses. Net income increased 18.4% due to lower income tax expenses from resolving certain tax issues. Earnings per share increased 22.2% for basic and 25.7% for diluted.
- Tribune Company reported lower operating revenues and profits for Q2 2006 compared to Q2 2005. Net income decreased 62.4% due to an expected loss from the sale of two television stations.
- Publishing revenues were down slightly but expenses increased, lowering operating cash flow and profit. Broadcasting revenues decreased for television but were flat overall.
- Income from continuing operations fell 29.1% while discontinued operations recorded a loss due to writing down assets of stations being sold. Earnings per share decreased across both continuing and discontinued operations.
The document summarizes Tribune Company's fourth quarter and full year 2001 financial results. Some key points:
- Operating revenues and profits declined in the fourth quarter and full year 2001 compared to 2000, due to lower advertising revenues and restructuring charges.
- Non-operating items included gains from changes in fair values of investments and sales of investments, but also losses from investment write-downs.
- For the full year, net income declined 50% to $111 million, while earnings per share fell 60% to $0.28, due to lower operating results and restructuring charges.
- Revenues increased 3% in the first quarter of 2004 compared to 2003, while operating profit decreased 1% due to higher operating expenses rising 4% compared to a 3% increase in revenues.
- Publishing revenues rose 3% due to increases in advertising, while broadcasting revenues increased 4% from growth in television advertising and acquisitions.
- Operating cash flow was flat as revenue growth was offset by higher operating expenses, and net income decreased 15% due to non-operating losses on investments.
The Tribune Company saw declines in operating revenues and income from continuing operations in the second quarter of 2007 compared to the same period in 2006. Operating revenues fell 6.8% and income from continuing operations dropped 78.2%. Expenses rose due to restructuring charges and plant closure costs. Non-operating losses also increased significantly due to losses on derivatives and investments. Net income declined 58.7% due to lower operating results and higher non-operating losses.
The Tribune Company reported financial results for the first quarter of 2006, with operating revenues down 1.3% from the same period in 2005. Operating profit declined 11.6% due to higher operating expenses and non-operating losses. Net income decreased 28.1% while earnings per share fell 25%. Publishing operating profit dropped 12.2% on lower revenues, and Broadcasting/Entertainment operating profit rose 3% despite declines in some segments.
The Tribune Company reported financial results for the third quarter and first three quarters of 2004. For the third quarter, operating revenues increased 2.0% but operating profit decreased 18.0% due to higher operating expenses. Net income attributable to common shares decreased 32.1% due to lower operating profit and higher non-operating losses. For the first three quarters, operating revenues increased 2.8% but operating profit decreased 11.5% and net income attributable to common shares decreased 37.8% due to factors similar to those impacting the third quarter results.
- Tribune Company reported a net loss of $138.9 million for Q3 2001 compared to net income of $79.2 million in Q3 2000. Operating revenues decreased 7% to $1.275 billion.
- Operating profit declined significantly due to restructuring charges of $130.7 million related to workforce reductions. Excluding restructuring charges, operating profit declined 37% to $148.7 million.
- Non-operating losses totaled $144.4 million, driven by losses on derivatives and investment write-downs, compared to a gain of $3.1 million in the prior year.
The document summarizes Tribune Company's financial results for the second quarter and first half of 2004 compared to the same periods in 2003. Key highlights include:
- Operating revenues increased 3.2% in the second quarter and 3.2% in the first half. However, operating profit declined due to higher operating expenses.
- Publishing operating cash flow declined 22.1% in the quarter and 13.4% in the first half due to a 12.8% rise in cash operating expenses.
- Broadcasting/Entertainment operating cash flow rose 7.2% in the quarter and 7.5% in the first half, led by a 7.3% and 8.3% increase in television.
Tribune Company reported lower revenues and operating profits in the first quarter of 2008 compared to the same period in 2007. Revenues declined 7.8% to $1.1 billion due to decreases at the Publishing and Broadcasting & Entertainment segments. Overall operating profit fell 21.2% to $143.4 million due to lower profits at Publishing and higher losses at Corporate, partially offset by higher profits at Broadcasting & Entertainment. Net income increased significantly to $1.8 billion primarily due to a large non-operating tax adjustment related to a change in the company's tax status.
The Tribune Company saw a decline in operating revenues and profits in Q3 2007 compared to 2006. However, net income was boosted by $66.95 million in income from discontinued operations. Several non-operating items impacted net income, including $84.97 million in losses on derivatives and investments, but this was offset by $90.7 million in tax benefits. Earnings per share increased significantly year-over-year due to lower outstanding shares.
- Tribune Company reported a 3.4% increase in operating revenues but a 2.5% decrease in operating profit for the third quarter of 2003 compared to the same period in 2002.
- Net income decreased 23.0% to $182.3 million due primarily to lower non-operating gains.
- For the first three quarters of 2003, operating revenues rose 4.3% while operating profit before restructuring charges increased 4.7% compared to the same period in 2002. However, net income increased significantly due to the absence of a large accounting charge in 2002.
1) Aetna reported total revenue of $6.2 billion for Q1 2006, up from $5.4 billion in Q1 2005. Health care premium revenue increased 16.7% to $4.7 billion.
2) Net income was $401.7 million, up 3.1% from $389.3 million in Q1 2005. Income from continuing operations was $385.6 million compared to $389.3 million the year before.
3) The Health Care segment saw a 17% increase in total revenue to $5.5 billion but operating earnings excluding prior period development fell from $286.5 million to $360.6 million due to no favorable development in
The document summarizes Tribune Company's financial results for the first quarter of 2003 compared to 2002. Some key points:
- Operating revenues increased 5% to $1.29 billion driven by a 13% increase in television revenues. Operating profit before restructuring charges rose 10% to $276 million.
- Net income was $141 million compared to a net loss of $102 million in 2002. Earnings per share increased significantly.
- Publishing operating profit rose 21% to $198 million due to cost reductions. Broadcasting profit increased 25% to $90 million from higher television revenues and profits.
- Corporate losses narrowed to $11 million from restructuring charges in the prior year. The company had
The Tribune Company reported financial results for the second quarter and first half of 2005. For the second quarter, revenues decreased 2.3% but operating expenses fell 4.5%, leading to a 6.1% rise in operating profit. Net income increased 142.1% to $233 million due to gains from investments. Earnings per share rose 151.7% to $0.73. For the first half, revenues declined 1.8% while operating expenses fell 2.2%, keeping operating profit flat. Net income increased 73.3% to $376 million and earnings per share rose 81.5% to $1.18, helped by investment gains.
- Tribune Company reported a net loss of $4.5 billion for Q2 2008 compared to net income of $36 million in Q2 2007. This was largely due to a $3.8 billion write-down of intangible assets.
- Operating revenues declined 5.7% year-over-year to $1.1 billion in Q2 2008. Operating expenses increased significantly due to the $3.8 billion write-down.
- For the first half of 2008, Tribune reported a net loss of $2.7 billion compared to net income of $13 million in the first half of 2007, again largely due to the $3.8 billion intangible asset write-down.
The Tribune Company reported financial results for the first quarter of 2007. Operating revenues decreased 4.3% from the prior year to $1.2 billion due to declines in publishing and broadcasting revenues. Operating profit decreased 16.3% to $181 million due to lower revenues and a $76 million loss on derivatives and investments. Net loss was $15.6 million compared to net income of $102.8 million in the prior year, as discontinued operations had a $34.4 million loss from expected sales of newspapers. Advertising revenues declined for publishing, with national down 1.4% and classified down 16%.
Tribune Company reported a significant decline in net income for the fourth quarter of 2007 compared to the same period in 2006. Operating revenues decreased 12.4% while operating expenses rose 10.5%, resulting in a 91.8% drop in operating profit. Additionally, the company reported a net loss of $78.8 million for the quarter compared to net income of $239.1 million in the prior year, a decline of 133%. The results were negatively impacted by impairment charges and costs associated with the company's going-private transaction in December 2007.
- Tribune Company reported its second quarter and first half 2001 results, with operating revenues increasing 2% and 29% respectively compared to the same periods in 2000.
- Operating profit declined 21% and 10% for the quarter and first half respectively due to a restructuring charge of $14.3 million.
- Net income increased 92% and 36% for the quarter and first half respectively due to non-operating gains, but income from continuing operations declined 41% and 25% due to the restructuring charge and higher interest expenses.
- Aetna reported total revenue of $5.4 billion for Q1 2005, up 12.6% from $4.8 billion in Q1 2004. Net income increased 16.2% to $424 million.
- Health care premium revenue increased 13.7% to $4.1 billion, driven by growth in commercial and Medicare membership. However, medical costs ratios improved as prior period estimates were favorable.
- Operating margins increased both pre-tax and after-tax due to higher premium revenue and lower than estimated medical costs. Overall operating expenses decreased as a percentage of revenue.
- Total medical membership grew 7.3% to 14.4 million members, with strong growth across all product lines
The Tribune Company reported financial results for the fourth quarter and full year of 2003. Operating revenues increased 2.8% in the fourth quarter and 3.9% for the full year compared to the prior year. Net income increased 74.8% in the fourth quarter and 101.2% for the full year due largely to gains on investments and derivatives. Earnings per share increased 73.8% in the fourth quarter on a basic basis and 75.4% on a diluted basis.
- Tribune Company reported its second quarter and first half 2002 results, with operating revenues increasing 1% in the second quarter compared to the previous year.
- Operating profit before restructuring charges was up 16% in the second quarter and 7% in the first half compared to the previous year. However, net income declined due to losses from derivatives and investments.
- Earnings per share were lower than the previous year in the second quarter and first half due to restructuring charges, losses from investments, and a cumulative effect of a change in accounting principle related to impairments of intangible assets.
Tribune Company reported lower revenues and operating profits in the first quarter of 2008 compared to the same period in 2007. Revenues declined 7.8% to $1.1 billion due to decreases in publishing and radio/entertainment revenues. Operating profit fell 21.2% to $143.4 million as profits declined across all business segments. The publishing segment saw the largest profit drop, with operating profit declining 73.9% due to lower revenues and higher severance costs.
This document summarizes Tribune Company's financial results for the first quarter of 2002 compared to the first quarter of 2001. Some key points:
- Operating revenues decreased 5% to $1.23 billion due to declines in publishing advertising and classified revenues. Operating profit before restructuring charges fell 3% to $251.7 million.
- Restructuring charges of $27.3 million were recorded in the first quarter of 2002 related to cost reduction initiatives.
- Net loss was $101.6 million compared to a net income of $70.6 million in 2001, driven by non-operating losses on investments and the cumulative effect of a change in accounting principle.
- Publishing revenues fell 6
- Tribune Company reported a net loss of $4.5 billion for Q2 2008 compared to net income of $36 million in Q2 2007. This was largely due to a $3.8 billion write-down of intangible assets.
- Operating revenues declined 5.7% year-over-year to $1.1 billion in Q2 2008. Operating expenses increased significantly due to the $3.8 billion write-down.
- The company also sold its Newsday Media Group business and recorded a $693 million loss on the disposition in Q2 2008.
- Motorola reported net earnings of $933 million for Q2 2005 compared to a net loss of $203 million in Q2 2004, driven by higher sales and gains on investments.
- Net sales increased 17% to $8.825 billion in Q2 2005 from $7.541 billion in Q2 2004, with mobile devices sales growing 24%.
- Earnings per share for continuing operations were $0.38 in Q2 2005 compared to $0.26 in Q2 2004.
This document provides a reconciliation of ALLTEL Corporation's results of operations under GAAP to non-GAAP results of operations from current businesses for the twelve months and three months ended December 31, 2004. It shows revenues, costs and expenses, operating income, and net income under both GAAP and excluding certain items. Key results include total 2004 revenues of $8.2 billion, operating income of $1.97 billion, net income of $1.04 billion, and basic EPS of $3.38 under non-GAAP current business measures.
This document provides a reconciliation of ALLTEL Corporation's results of operations under GAAP (Generally Accepted Accounting Principles) to non-GAAP results of operations from current businesses for the twelve months and three months ended December 31, 2004. It shows revenues, costs, expenses, operating income, and earnings per share under both GAAP and excluding certain items to present results from current businesses only. Key figures include total revenues of $8.2 billion for the twelve months under both measures. Operating income was $1.97 billion excluding items versus $1.92 billion under GAAP.
This document provides a reconciliation of ALLTEL Corporation's results of operations under GAAP to non-GAAP results of operations from current businesses for the twelve months and three months ended December 31, 2004. It shows revenues, costs and expenses, operating income, and net income under both GAAP and excluding certain items. Key results include total 2004 revenues of $8.2 billion, operating income of $1.97 billion, net income of $1.04 billion, and basic EPS of $3.38 under non-GAAP current business measures.
This document provides a reconciliation of ALLTEL Corporation's results of operations under GAAP accounting standards to results from its current businesses, excluding certain items, for the twelve months and three quarters ending in 2004. Key points:
- For the full year, net income was $1.038 billion under current business results vs. $1.046 billion under GAAP due to excluded integration, restructuring, and other charges.
- By quarter, current business net income was $270 million for Q4, $284 million for Q3, and $263 million for Q2, compared to GAAP results.
This document provides a reconciliation of ALLTEL Corporation's results of operations under GAAP accounting standards to results from its current businesses, excluding certain items, for the twelve months and three quarters ending in 2004. Key points:
- For the full year, net income was $1.038 billion under current businesses vs. $1.046 billion under GAAP due to excluded integration, restructuring, and other charges.
- By quarter, results were also similar under the two measures, differing by less than $40 million each quarter.
This document provides a reconciliation of ALLTEL Corporation's results of operations under GAAP accounting standards to results from its current businesses, excluding certain items, for the twelve months and three quarters ending in 2004. Key points:
- For the full year, net income was $1.038 billion under current business results vs. $1.046 billion under GAAP due to excluded integration, restructuring, and other charges.
- By quarter, current business net income was $270 million for Q4, $284 million for Q3, and $263 million for Q2, compared to GAAP results.
This document provides a reconciliation of ALLTEL Corporation's results of operations under GAAP accounting standards to results from its current businesses, excluding certain items, for the twelve months and three quarters ending in 2004. Key points:
- For the full year, net income was $1.038 billion under current businesses vs. $1.046 billion under GAAP due to excluded integration, restructuring, and other charges.
- By quarter, results were also similar under the two measures, differing by less than $40 million each quarter.
This document provides a reconciliation of Alltel Corporation's results of operations under GAAP accounting standards versus results from current businesses, excluding certain items, for the twelve months and three months ended December 31, 2004. It shows revenues, costs, expenses and income for Alltel's wireless, wireline, communications support and corporate operations segments. Certain integration, restructuring and other charges were excluded from the non-GAAP results of current businesses. Income from discontinued operations was also excluded from the non-GAAP results.
western unionCorporate Governance Guidelinesfinance47
The Board of Directors is responsible for overseeing Western Union and selecting the CEO and other executive management. The Board's primary functions are oversight, ethics and integrity, evaluating performance, reviewing strategic plans, advising management, and ensuring compliance. The Board establishes committees, evaluates itself, and plans for CEO succession to fulfill its responsibilities.
western unionRelated Person Transactions Policy finance47
The policy establishes guidelines for approving related person transactions between the company and its directors, executive officers, or significant shareholders. It requires that all related person transactions be approved or ratified by the Corporate Governance Committee or disinterested members of the Board. The committee must consider factors like the transaction's size, the related person's interest, potential conflicts, and whether comparable terms could be obtained from an unaffiliated third party. Ongoing related person transactions are also subject to annual review. All approved transactions must be disclosed as required by securities laws.
The document summarizes Western Union's 2006 annual report. It highlights that Western Union has a 150-year history of connecting people around the world through money transfers, with its brand synonymous with speed, trust, reliability and convenience. It processes nearly 150 million consumer-to-consumer transactions annually, accounting for over 80% of its revenue. It is also expanding its consumer-to-business services to allow bill payments, having recently acquired a company in Argentina, as it looks to increase diversification and growth opportunities.
Western Union had a very successful 2007 financially, with revenue, operating profit, and cash flow from operating activities all reaching record highs and growing at double-digit annual rates. The company strengthened its global network by increasing its number of agent locations worldwide to over 335,000 across more than 200 countries and territories. International consumer-to-consumer money transfers now make up 65% of Western Union's total revenue, demonstrating the company's increasing global reach and focus on serving migrant populations worldwide. Western Union aims to continue growing this business segment and meeting the evolving financial needs of global consumers.
Western Union's 2008 annual report summarizes the company's strong financial performance in 2008. The company delivered record revenue of $5.3 billion and cash flow from operations of $1.25 billion. Western Union's share of the global cross-border remittance market increased to 17% in 2008. Looking ahead, the company plans to focus on accelerating profitable growth, expanding payments services, innovating new products, and improving profitability through cost reductions.
Hershey Foods Corporation saw decreased sales and net income in 1999 compared to 1998. Sales declined due to the divestiture of the pasta business in early 1999 and difficulties fulfilling orders after implementing a new IT system. Net income increased due to a gain on the pasta sale, but excluding this was down 13% due to the sales decline and higher costs. The financial position remained strong with reduced debt from the pasta sale proceeds. Capital expenditures of $150-170 million annually are planned for manufacturing expansion and modernization.
This document provides an analysis of Hershey Foods Corporation's financial condition and results of operations. It discusses increases in net sales and gross margin from 1999 to 2000 primarily due to lower raw material costs. Selling and administrative expenses also increased from 1999 to 2000 due to higher marketing and staffing costs. In 2000, Hershey acquired Nabisco's mint and gum businesses for $135 million. The acquisition increased assets but did not materially impact 2000 results. Cash flow from operations and prior asset sales exceeded capital expenditures, share repurchases and dividends. Liquidity remains strong with continued capital investments planned.
1) Net sales for Hershey Foods Corporation increased 6% from 1999 to 2000 due to higher core confectionery and grocery product sales in North America, new product introductions, and lower returns and discounts. Net sales decreased 10% from 1998 to 1999 primarily due to the sale of the pasta business.
2) Gross margin increased from 40.7% in 1999 to 41.5% in 2000 due to lower raw material costs and returns/discounts, but was partially offset by higher distribution costs. Gross margin decreased from 40.8% in 1998 to 40.7% in 1999 due to product mix and higher distribution costs.
3) Net income decreased 27% from 1999 to 2000 due to the 1999
- Hershey Foods Corporation produces and distributes a broad line of chocolate and non-chocolate confectionery and grocery products.
- Net sales rose in 2001 primarily due to acquisitions of mint and gum businesses and new product introductions. Net sales also rose in 2000 due to increased sales of base confectionery products.
- Gross margin was unchanged at 41.5% in 2000 and 2001. Excluding one-time charges, gross margin rose to 42.6% in 2001 due to lower costs and supply chain efficiencies.
Hershey Foods Corporation manufactures and distributes confectionery and grocery products. In 2002, the company's net sales decreased from 2001 primarily due to increased promotion costs, divestitures of some brands, and the timing of sales from an acquired gum and mint business. Cost of sales also decreased in 2002 from 2001 mainly because of lower costs for raw materials. However, gross margin increased due to decreased raw material costs and supply chain efficiencies. Selling, marketing, and administrative expenses decreased slightly in 2002 driven by savings from business realignment initiatives and the elimination of goodwill amortization, partially offset by expenses to explore a possible sale of the company.
Hershey Foods Corporation manufactures and distributes confectionery and grocery products. Net sales decreased in 2002 due to increased promotion costs, divestitures, and sluggish retail conditions. Cost of sales decreased due to lower raw material costs and supply chain efficiencies. In late 2001, the company approved a business realignment plan to improve efficiency, including outsourcing manufacturing, rationalizing product lines, improving supply chain, and workforce reductions, generating $75-80 million in annual savings. Charges of $312 million were recorded for these initiatives.
- Hershey Foods Corporation manufactures and sells confectionery and grocery products. In 2003, the company saw increased net sales and net income compared to 2002 through strategies focusing on key brands, gross margin expansion, and earnings growth per share.
- The company's strategies over a three-year period resulted in increased sales, gross margins, and returns through price increases, improved sales mix, lower costs, and share repurchases. However, challenges remain in driving profitable core confectionery growth and portfolio evolution.
- Hershey Foods Corporation manufactures and sells confectionery and grocery products. In 2003, the company saw increased net sales and income compared to 2002 through strategies focused on key brands, gross margin expansion, and earnings growth per share.
- Primary challenges for 2004 and beyond include profitable sales growth in core confectionery and broader snacks, evolving the product portfolio to meet consumer trends, and balancing growth and profit in seasonal and packaged candy businesses. The company expects continued revenue growth, margin expansion, and earnings growth per share through focus on these strategies.
This document is Hershey Foods Corporation's 2003 annual report and proxy statement to shareholders. It discusses Hershey's financial performance in 2003, including 13% earnings per share growth and continued gross margin expansion. It outlines the company's strategy of investing in core brands and expanding into snack market adjacencies. Key initiatives included restructuring the US sales force, creating a US Snack Group, and launching new better-for-you snack products. The report also discusses governance improvements and leadership changes on the board and in management.
This document is Hershey Foods Corporation's 2003 annual report and proxy statement to shareholders. It discusses Hershey's financial performance in 2003, including 13% earnings per share growth and continued margin expansion. It outlines the company's strategy of investing in core brands and expanding into snack market adjacencies. Key initiatives included restructuring the US sales force, creating a US Snack Group, and launching new better-for-you snack products. The report also discusses governance improvements and leadership changes on the board and in management.
This document is a Form 10-K annual report filed by Hershey Foods Corporation with the SEC for the fiscal year ending December 31, 2004. It provides information on Hershey's business operations, products, sales, marketing strategies, distribution networks, raw material costs, and price increases. Key details include that Hershey manufactures and sells over 50 brands of confectionery, snack, refreshment and grocery products in North America and other countries. It sources cocoa beans, its primary raw material, from various global regions.
This document is a Form 10-K annual report filed by Hershey Foods Corporation with the SEC for the fiscal year ending December 31, 2004. It provides information on Hershey's business operations, products, sales, distribution, raw materials, and pricing. Key details include: Hershey manufactures and sells confectionery, snack, refreshment and grocery products worldwide; its major brands include Hershey's, Reese's, and Kit Kat; cocoa beans are its primary raw material; and it announced price increases on half its domestic confectionery line in late 2004 and early 2005.
13 Jun 24 ILC Retirement Income Summit - slides.pptxILC- UK
ILC's Retirement Income Summit was hosted by M&G and supported by Canada Life. The event brought together key policymakers, influencers and experts to help identify policy priorities for the next Government and ensure more of us have access to a decent income in retirement.
Contributors included:
Jo Blanden, Professor in Economics, University of Surrey
Clive Bolton, CEO, Life Insurance M&G Plc
Jim Boyd, CEO, Equity Release Council
Molly Broome, Economist, Resolution Foundation
Nida Broughton, Co-Director of Economic Policy, Behavioural Insights Team
Jonathan Cribb, Associate Director and Head of Retirement, Savings, and Ageing, Institute for Fiscal Studies
Joanna Elson CBE, Chief Executive Officer, Independent Age
Tom Evans, Managing Director of Retirement, Canada Life
Steve Groves, Chair, Key Retirement Group
Tish Hanifan, Founder and Joint Chair of the Society of Later life Advisers
Sue Lewis, ILC Trustee
Siobhan Lough, Senior Consultant, Hymans Robertson
Mick McAteer, Co-Director, The Financial Inclusion Centre
Stuart McDonald MBE, Head of Longevity and Democratic Insights, LCP
Anusha Mittal, Managing Director, Individual Life and Pensions, M&G Life
Shelley Morris, Senior Project Manager, Living Pension, Living Wage Foundation
Sarah O'Grady, Journalist
Will Sherlock, Head of External Relations, M&G Plc
Daniela Silcock, Head of Policy Research, Pensions Policy Institute
David Sinclair, Chief Executive, ILC
Jordi Skilbeck, Senior Policy Advisor, Pensions and Lifetime Savings Association
Rt Hon Sir Stephen Timms, former Chair, Work & Pensions Committee
Nigel Waterson, ILC Trustee
Jackie Wells, Strategy and Policy Consultant, ILC Strategic Advisory Board
How Poonawalla Fincorp and IndusInd Bank’s Co-Branded RuPay Credit Card Cater...beulahfernandes8
The eLITE RuPay Platinum Credit Card, a strategic collaboration between Poonawalla Fincorp and IndusInd Bank, represents a significant advancement in India's digital financial landscape. Spearheaded by Abhay Bhutada, MD of Poonawalla Fincorp, the card leverages deep customer insights to offer tailored features such as no joining fees, movie ticket offers, and rewards on UPI transactions. IndusInd Bank's solid banking infrastructure and digital integration expertise ensure seamless service delivery in today's fast-paced digital economy. With a focus on meeting the growing demand for digital financial services, the card aims to cater to tech-savvy consumers and differentiate itself through unique features and superior customer service, ultimately poised to make a substantial impact in India's digital financial services space.
University of North Carolina at Charlotte degree offer diploma Transcripttscdzuip
办理美国UNCC毕业证书制作北卡大学夏洛特分校假文凭定制Q微168899991做UNCC留信网教留服认证海牙认证改UNCC成绩单GPA做UNCC假学位证假文凭高仿毕业证GRE代考如何申请北卡罗莱纳大学夏洛特分校University of North Carolina at Charlotte degree offer diploma Transcript
“Amidst Tempered Optimism” Main economic trends in May 2024 based on the results of the New Monthly Enterprises Survey, #NRES
On 12 June 2024 the Institute for Economic Research and Policy Consulting (IER) held an online event “Economic Trends from a Business Perspective (May 2024)”.
During the event, the results of the 25-th monthly survey of business executives “Ukrainian Business during the war”, which was conducted in May 2024, were presented.
The field stage of the 25-th wave lasted from May 20 to May 31, 2024. In May, 532 companies were surveyed.
The enterprise managers compared the work results in May 2024 with April, assessed the indicators at the time of the survey (May 2024), and gave forecasts for the next two, three, or six months, depending on the question. In certain issues (where indicated), the work results were compared with the pre-war period (before February 24, 2022).
✅ More survey results in the presentation.
✅ Video presentation: https://youtu.be/4ZvsSKd1MzE
The Rise and Fall of Ponzi Schemes in America.pptxDiana Rose
Ponzi schemes, a notorious form of financial fraud, have plagued America’s investment landscape for decades. Named after Charles Ponzi, who orchestrated one of the most infamous schemes in the early 20th century, these fraudulent operations promise high returns with little or no risk, only to collapse and leave investors with significant losses. This article explores the nature of Ponzi schemes, notable cases in American history, their impact on victims, and measures to prevent falling prey to such scams.
Understanding Ponzi Schemes
A Ponzi scheme is an investment scam where returns are paid to earlier investors using the capital from newer investors, rather than from legitimate profit earned. The scheme relies on a constant influx of new investments to continue paying the promised returns. Eventually, when the flow of new money slows down or stops, the scheme collapses, leaving the majority of investors with substantial financial losses.
Historical Context: Charles Ponzi and His Legacy
Charles Ponzi is the namesake of this deceptive practice. In the 1920s, Ponzi promised investors in Boston a 50% return within 45 days or 100% return in 90 days through arbitrage of international reply coupons. Initially, he paid returns as promised, not from profits, but from the investments of new participants. When his scheme unraveled, it resulted in losses exceeding $20 million (equivalent to about $270 million today).
Notable American Ponzi Schemes
1. Bernie Madoff: Perhaps the most notorious Ponzi scheme in recent history, Bernie Madoff’s fraud involved $65 billion. Madoff, a well-respected figure in the financial industry, promised steady, high returns through a secretive investment strategy. His scheme lasted for decades before collapsing in 2008, devastating thousands of investors, including individuals, charities, and institutional clients.
2. Allen Stanford: Through his company, Stanford Financial Group, Allen Stanford orchestrated a $7 billion Ponzi scheme, luring investors with fraudulent certificates of deposit issued by his offshore bank. Stanford promised high returns and lavish lifestyle benefits to his investors, which ultimately led to a 110-year prison sentence for the financier in 2012.
3. Tom Petters: In a scheme that lasted more than a decade, Tom Petters ran a $3.65 billion Ponzi scheme, using his company, Petters Group Worldwide. He claimed to buy and sell consumer electronics, but in reality, he used new investments to pay off old debts and fund his extravagant lifestyle. Petters was convicted in 2009 and sentenced to 50 years in prison.
4. Eric Dalius and Saivian: Eric Dalius, a prominent figure behind Saivian, a cashback program promising high returns, is under scrutiny for allegedly orchestrating a Ponzi scheme. Saivian enticed investors with promises of up to 20% cash back on everyday purchases. However, investigations suggest that the returns were paid using new investments rather than legitimate profits. The collapse of Saivian l
Dr. Alyce Su Cover Story - China's Investment Leadermsthrill
In World Expo 2010 Shanghai – the most visited Expo in the World History
https://www.britannica.com/event/Expo-Shanghai-2010
China’s official organizer of the Expo, CCPIT (China Council for the Promotion of International Trade https://en.ccpit.org/) has chosen Dr. Alyce Su as the Cover Person with Cover Story, in the Expo’s official magazine distributed throughout the Expo, showcasing China’s New Generation of Leaders to the World.
How to Invest in Cryptocurrency for Beginners: A Complete GuideDaniel
Cryptocurrency is digital money that operates independently of a central authority, utilizing cryptography for security. Unlike traditional currencies issued by governments (fiat currencies), cryptocurrencies are decentralized and typically operate on a technology called blockchain. Each cryptocurrency transaction is recorded on a public ledger, ensuring transparency and security.
Cryptocurrencies can be used for various purposes, including online purchases, investment opportunities, and as a means of transferring value globally without the need for intermediaries like banks.
An accounting information system (AIS) refers to tools and systems designed for the collection and display of accounting information so accountants and executives can make informed decisions.
Madhya Pradesh, the "Heart of India," boasts a rich tapestry of culture and heritage, from ancient dynasties to modern developments. Explore its land records, historical landmarks, and vibrant traditions. From agricultural expanses to urban growth, Madhya Pradesh offers a unique blend of the ancient and modern.
Discovering Delhi - India's Cultural Capital.pptxcosmo-soil
Delhi, the heartbeat of India, offers a rich blend of history, culture, and modernity. From iconic landmarks like the Red Fort to bustling commercial hubs and vibrant culinary scenes, Delhi's real estate landscape is dynamic and diverse. Discover the essence of India's capital, where tradition meets innovation.
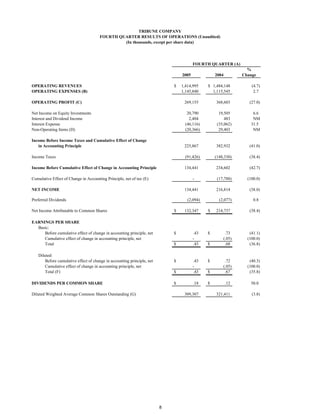
1. TRIBUNE COMPANY
FOURTH QUARTER RESULTS OF OPERATIONS (Unaudited)
(In thousands, except per share data)
FOURTH QUARTER (A)
%
2005 2004 Change
OPERATING REVENUES $ 1,414,995 $ 1,484,148 (4.7)
OPERATING EXPENSES (B) 1,145,840 1,115,545 2.7
OPERATING PROFIT (C) 269,155 368,603 (27.0)
Net Income on Equity Investments 20,790 19,505 6.6
Interest and Dividend Income 2,404 483 NM
Interest Expense (46,116) (35,062) 31.5
Non-Operating Items (D) (20,366) 29,403 NM
Income Before Income Taxes and Cumulative Effect of Change
in Accounting Principle 225,867 382,932 (41.0)
Income Taxes (91,426) (148,330) (38.4)
Income Before Cumulative Effect of Change in Accounting Principle 134,441 234,602 (42.7)
Cumulative Effect of Change in Accounting Principle, net of tax (E) - (17,788) (100.0)
NET INCOME 134,441 216,814 (38.0)
Preferred Dividends (2,094) (2,077) 0.8
Net Income Attributable to Common Shares $ 132,347 $ 214,737 (38.4)
EARNINGS PER SHARE
Basic:
Before cumulative effect of change in accounting principle, net $ .43 $ .73 (41.1)
Cumulative effect of change in accounting principle, net - (.05) (100.0)
Total $ .43 $ .68 (36.8)
Diluted:
Before cumulative effect of change in accounting principle, net $ .43 $ .72 (40.3)
Cumulative effect of change in accounting principle, net - (.05) (100.0)
Total (F) $ .43 $ .67 (35.8)
DIVIDENDS PER COMMON SHARE $ .18 $ .12 50.0
Diluted Weighted Average Common Shares Outstanding (G) 309,307 321,411 (3.8)
8
2. (A) 2005 fourth quarter: Sept. 26, 2005 to Dec. 25, 2005. (13 weeks)
2004 fourth quarter: Sept. 27, 2004 to Dec. 26, 2004. (13 weeks)
(B) Operating expenses for 2005 included a charge of $22 million, or $.04 per diluted share, related to the announced shutdown of the Los Angeles
Times San Fernando Valley printing facility, a charge of $45 million, or $.09 per diluted share, ($43 million at publishing, $1 million a
broadcasting & entertainment and $1 million at corporate) related to the elimination of approximately 900 positions, and a pension
curtailment gain of $18 million, or $.03 per diluted share ($13 million at publishing, $1 million at broadcasting & entertainment and
$4 million at corporate). Operating expenses for 2004 included a charge of $24 million, or $.05 per diluted share, related to the
elimination of approximately 230 positions in the publishing group.
(C) Operating profit excludes interest and dividend income, interest expense, equity income and losses, non-operating items
and income taxes.
(D) The fourth quarter of 2005 included the following non-operating items:
Pretax After-tax
Gain (Loss) Gain (Loss) Diluted EPS
Loss on derivatives and related investments (1) $ (24,486) $ (14,937) $ (.05)
Gain on sales of subsidiaries and investments, net 3,885 2,370 .01
Other, net 235 143 -
Total non-operating items $ (20,366) $ (12,424) $ (.04)
The fourth quarter of 2004 included the following non-operating items:
Pretax After-tax
Gain Gain Diluted EPS
Gain on derivatives and related investments (1) $ 27,614 $ 16,844 $ .06
Gain on sales of subsidiaries and investments, net 1,711 1,044 -
Other, net 78 48 -
Total non-operating items $ 29,403 $ 17,936 $ .06
(1) Gain (loss) on derivatives and related investments represents the net change in fair values of the derivative component of the
Company's PHONES and the related Time Warner shares.
(E) As a result of adopting the provisions of the Financial Accounting Standards Board's Emerging Issues Task Force Topic No. D-108,
which requires the use of a direct valuation method for intangible assets such as FCC licenses, the Company recorded a one-time
pretax charge of $29 million ($18 million after tax, or $.05 per diluted share) in the fourth quarter of 2004 as a cumulative effect of a
change in accounting principle in the consolidated income statement.
9
3. (F) For the fourth quarters of 2005 and 2004, weighted average common shares outstanding used in the calculation of diluted
earnings per share (quot;EPSquot;) were adjusted for the dilutive effect of stock options. The Company's Series C, D-1 and D-2
convertible preferred shares were not included in the calculations of diluted EPS for the fourth quarter of either year because
their effects were antidilutive. Following are the calculations for the fourth quarter:
Fourth Quarter
2005 2004
Net income $ 134,441 $ 216,814
Dividends for Series C, D-1 and D-2 preferred stock (2,094) (2,077)
Net income attributable to common shares $ 132,347 $ 214,737
Weighted average common shares outstanding 307,402 317,715
Assumed exercise of stock options, net of common
shares assumed repurchased 1,905 3,696
Adjusted weighted average common
shares outstanding 309,307 321,411
Diluted earnings per share $ .43 $ .67
(G) The number of common shares outstanding, in thousands, at Dec. 25, 2005 was 306,680.
10
4. TRIBUNE COMPANY
FULL YEAR RESULTS OF OPERATIONS (Unaudited)
(In thousands, except per share data)
FULL YEAR (A)
%
2005 2004 Change
OPERATING REVENUES $ 5,595,617 $ 5,726,247 (2.3)
OPERATING EXPENSES (B) 4,448,794 4,507,958 (1.3)
OPERATING PROFIT (C) 1,146,823 1,218,289 (5.9)
Net Income on Equity Investments 41,209 17,931 129.8
Interest and Dividend Income 7,539 3,053 146.9
Interest Expense (155,191) (153,118) 1.4
Non-Operating Items (D) 69,861 (145,044) NM
Income Before Income Taxes and Cumulative Effect of Change
in Accounting Principle 1,110,241 941,111 18.0
Income Taxes (D) (575,552) (367,787) 56.5
Income Before Cumulative Effect of Change in Accounting Principle 534,689 573,324 (6.7)
Cumulative Effect of Change in Accounting Principle, net of tax (E) - (17,788) (100.0)
NET INCOME 534,689 555,536 (3.8)
Preferred Dividends (8,364) (8,308) 0.7
Net Income Attributable to Common Shares $ 526,325 $ 547,228 (3.8)
EARNINGS PER SHARE
Basic:
Before cumulative effect of change in accounting principle, net $ 1.68 $ 1.75 (4.0)
Cumulative effect of change in accounting principle, net - (.05) (100.0)
Total $ 1.68 $ 1.70 (1.2)
Diluted:
Before cumulative effect of change in accounting principle, net $ 1.67 $ 1.72 (2.9)
Cumulative effect of change in accounting principle, net - (.05) (100.0)
Total (F) $ 1.67 $ 1.67 -
DIVIDENDS PER COMMON SHARE $ .72 $ .48 50.0
Diluted Weighted Average Common Shares Outstanding (G) 315,338 327,237 (3.6)
11
5. (A) 2005 full year: Dec. 27, 2004 to Dec. 25, 2005. (52 weeks)
2004 full year: Dec. 29, 2003 to Dec. 26, 2004. (52 weeks)
(B) Operating expenses for 2005 included a charge of $22 million, or $.04 per diluted share, related to the announced shutdown of theLos Angeles
Times San Fernando Valley printing facility, a charge of $45 million, or $.09 per diluted share, ($43 million at publishing, $1 million a
broadcasting & entertainment and $1 million at corporate) related to the elimination of appoximately 900 positions, and a pension
curtailment gain of $18 million, or $.03 per diluted share ($13 million at publishing, $1 million at broadcasting & entertainment and
$4 million at corporate). Operating expenses for 2004 included a charge of $41 million, or $.07 per diluted share, for the elimination of
approximately 600 positions in the publishing group and a charge of $90 million, or $.17 per diluted share, related to the anticipated
settlement with advertisers regarding misstated circulation atNewsday and Hoy, New York.
(C) Operating profit excludes interest and dividend income, interest expense, equity income and losses, non-operating items and income
taxes.
(D) The full year 2005 included the following non-operating items:
Pretax After-tax
Gain Gain (Loss) Diluted EPS
Gain on derivatives and related investments (1) $ 62,184 $ 37,932 $ .12
Gain on sales of subsidiaries and investments, net 6,780 4,136 .01
Other, net 897 547 .01
Income tax adjustments (2) - (138,664) (.44)
Total non-operating items $ 69,861 $ (96,049) $ (.30)
The full year 2004 included the following non-operating items:
Pretax After-tax
Gain (Loss) Gain (Loss) Diluted EPS
Loss on derivatives and related investments (1) $ (18,497) $ (11,283) $ (.03)
Loss on early debt retirement (3) (140,506) (87,549) (.26)
Gain on sales of subsidiaries and investments, net (4) 20,347 12,412 .03
Loss on investment write-downs and other, net (6,388) (3,897) (.02)
Total non-operating items $ (145,044) $ (90,317) $ (.28)
(1) Gain (loss) on derivatives and related investments represents the net change in fair values of the derivative component of the
Company's PHONES and the related Time Warner shares.
(2) On September 27, 2005, the United States Tax Court issued an opinion disallowing the 1998 tax-free reorganization of
Matthew Bender, a former subsidiary of The Times Mirror Company. Tribune acquired Times Mirror in June 2000, and
inherited the preexisting tax dispute at that time. Taxes and related interest for both the Matthew Bender transaction and a
similar transaction completed by Times Mirror for its Mosby subsidiary in the same year total approximately $1 billion.
Over time, deductions for state taxes and interest will reduce the net cash outlay to approximately $837 million.
The Company had a tax reserve of $228 million, net of tax, related to the litigation. As a result of the Tax Court
ruling, the Company increased its tax reserve by $609 million by recording additional income tax expense
of $150 million and goodwill of $459 million in the third quarter of 2005. In the first quarter of 2005, the Company
reduced its income tax expense and liabilities by a total of $12 million as a result of favorably resolving
certain federal income tax issues.
(3) Loss on early debt retirement related to the retirement of $620 million of debt in the second quarter of 2004 at a cash
premium of $137 million.
(4) In 2004, gain on sales of subsidiaries and investments related primarily to the sale of the Company's 50% interest in La Opinion .
(E) As a result of adopting the provisions of the Financial Accounting Standards Board's Emerging Issues Task Force Topic No. D-108,
which requires the use of a direct valuation method for intangible assets such as FCC licenses, the Company recorded a one-time
pretax charge of $29 million ($18 million after tax, or $.05 per diluted share) in the fourth quarter of 2004 as a cumulative effect of a
change in accounting principle in the consolidated income statement.
12
6. (F) For the full year 2005 and 2004, weighted average common shares outstanding used in the calculation of diluted
earnings per share (quot;EPSquot;) were adjusted for the dilutive effect of stock options. The Company's Series C, D-1 and D-2
convertible preferred shares were not included in the calculations of diluted EPS for either year because their effects were antidilutive.
Following are the calculations for the full year:
Full Year
2005 2004
Net income $ 534,689 $ 555,536
Dividends for Series C, D-1 and D-2 preferred stock (8,364) (8,308)
Net income attributable to common shares $ 526,325 $ 547,228
Weighted average common shares outstanding 312,880 322,420
Assumed exercise of stock options, net of common
shares assumed repurchased 2,458 4,817
Adjusted weighted average common
shares outstanding 315,338 327,237
Diluted earnings per share $ 1.67 $ 1.67
(G) The number of common shares outstanding, in thousands, at Dec. 25, 2005 was 306,680.
13
8. (A) The Company uses cash operating expenses to evaluate internal performance. The Company has presented cash operating expenses because
it is a common measure used by rating agencies, financial analysts and investors. Cash operating expense is not a measure of financial
performance under generally accepted accounting principles (quot;GAAPquot;) and should not be considered in isolation or as a substitute for
measures of performance prepared in accordance with GAAP.
Following is a reconciliation of operating expenses to cash operating expenses for the fourth quarter of 2005:
Broadcasting and
Publishing Entertainment Corporate Consolidated
Operating expenses $ 898,567 $ 237,888 $ 9,385 $ 1,145,840
Less: depreciation and amortization expense 58,772 13,020 409 72,201
Cash operating expenses $ 839,795 $ 224,868 $ 8,976 $ 1,073,639
Following is a reconciliation of operating expenses to cash operating expenses for the fourth quarter of 2004:
Broadcasting and
Publishing Entertainment Corporate Consolidated
Operating expenses $ 865,118 $ 236,287 $ 14,140 $ 1,115,545
Less: depreciation and amortization expense 45,319 12,950 402 58,671
Cash operating expenses $ 819,799 $ 223,337 $ 13,738 $ 1,056,874
Following is a reconciliation of operating expenses to cash operating expenses for the full year 2005:
Broadcasting and
Publishing Entertainment Corporate Consolidated
Operating expenses $ 3,337,137 $ 1,062,244 $ 49,413 $ 4,448,794
Less: depreciation and amortization expense 190,926 51,264 1,630 243,820
Cash operating expenses $ 3,146,211 $ 1,010,980 $ 47,783 $ 4,204,974
Following is a reconciliation of operating expenses to cash operating expenses for the full year 2004:
Broadcasting and
Publishing Entertainment Corporate Consolidated
Operating expenses $ 3,403,643 $ 1,052,097 $ 52,218 $ 4,507,958
Less: depreciation and amortization expense 179,029 52,425 1,635 233,089
Cash operating expenses $ 3,224,614 $ 999,672 $ 50,583 $ 4,274,869
(B) Cash operating expenses for the fourth quarter and full year 2005 included a charge of $6 million related to the announced shutdown
of the Los Angeles Times San Fernando Valley printing facility, a charge of $45 million ($43 million at publishing, $1 million at
broadcasting & entertainment and $1 million at corporate) related to the elimination of approximately 900 positions, and a
pension curtailment gain of $18 million ($13 million at publishing, $1 million at broadcasting & entertainment and $4 million
at corporate). Publishing cash operating expenses for the fourth quarter and full year 2004 included charges of $24 million
and $41 million, respectively, for the elimination of approximately 230 and 600 positions, respectively, in the publishing group.
Publishing cash operating expenses for the full year 2004 also included a charge of $90 million related to the anticipated
settlement with advertisers regarding misstated circulation atNewsday and Hoy , New York.
(C) Operating cash flow is defined as operating profit before depreciation and amortization. The Company uses operating cash flow along with
operating profit and other measures to evaluate the financial performance of the Company's business segments. The Company has
presented operating cash flow because it is a common alternative measure of financial performance used by rating agencies, financial analysts
and investors. These groups use operating cash flow along with other measures as a way to estimate the value of a company. The
Company's definition of operating cash flow may not be consistent with that of other companies. Operating cash flow does not represent
cash provided by operating activities as reflected in the Company's consolidated statements of cash flows, is not a measure of financial
performance under GAAP and should not be considered in isolation or as a substitute for measures of performance prepared in accordance
with GAAP.
15
9. (D) Operating profit for each segment excludes interest and dividend income, interest expense, equity income and losses, non-operating items and
income taxes.
Following is a reconciliation of operating profit (loss) to operating cash flow for the fourth quarter of 2005:
Broadcasting and
Publishing Entertainment Corporate Consolidated
Operating profit (loss) $ 173,793 $ 104,747 $ (9,385) $ 269,155
Add back: depreciation and amortization expense 58,772 13,020 409 72,201
Operating cash flow $ 232,565 $ 117,767 $ (8,976) $ 341,356
Following is a reconciliation of operating profit (loss) to operating cash flow for the fourth quarter of 2004:
Broadcasting and
Publishing Entertainment Corporate Consolidated
Operating profit (loss) $ 233,828 $ 148,915 $ (14,140) $ 368,603
Add back: depreciation and amortization expense 45,319 12,950 402 58,671
Operating cash flow $ 279,147 $ 161,865 $ (13,738) $ 427,274
Following is a reconciliation of operating profit (loss) to operating cash flow for the full year 2005:
Broadcasting and
Publishing Entertainment Corporate Consolidated
Operating profit (loss) $ 759,713 $ 436,523 $ (49,413) $ 1,146,823
Add back: depreciation and amortization expense 190,926 51,264 1,630 243,820
Operating cash flow $ 950,639 $ 487,787 $ (47,783) $ 1,390,643
Following is a reconciliation of operating profit (loss) to operating cash flow for the full year 2004:
Broadcasting and
Publishing Entertainment Corporate Consolidated
Operating profit (loss) $ 726,207 $ 544,300 $ (52,218) $ 1,218,289
Add back: depreciation and amortization expense 179,029 52,425 1,635 233,089
Operating cash flow $ 905,236 $ 596,725 $ (50,583) $ 1,451,378
(E) Depreciation and amortization expense for the fourth quarter and full year 2005 included $16 million of accelerated depreciation expense related
to the announced shutdown of the Los Angeles Times San Fernando Valley printing facility
16
10. TRIBUNE COMPANY
SUMMARY OF REVENUES (Unaudited)
(In thousands)
Period 12 (5 Weeks) Fourth Quarter (13 Weeks) Year-to-Date (52 Weeks)
% % %
2005 2004 Change 2005 2004 Change 2005 2004 Change
Publishing
Advertising
Retail $ 166,216 $ 175,415 (5.2) $ 380,497 $ 395,575 (3.8) $ 1,323,547 $ 1,330,951 (0.6)
National 81,575 90,270 (9.6) 211,433 222,759 (5.1) 774,093 802,530 (3.5)
Classified 85,434 83,323 2.5 268,458 260,710 3.0 1,146,460 1,095,012 4.7
Sub-Total 333,225 349,008 (4.5) 860,388 879,044 (2.1) 3,244,100 3,228,493 0.5
Circulation 56,418 58,479 (3.5) 148,057 154,766 (4.3) 596,163 643,947 (7.4)
Other 23,371 23,694 (1.4) 63,915 65,136 (1.9) 256,587 257,410 (0.3)
Segment Total (A) 413,014 431,181 (4.2) 1,072,360 1,098,946 (2.4) 4,096,850 4,129,850 (0.8)
Broadcasting & Entertainment
Television 119,920 133,383 (10.1) 318,912 352,437 (9.5) 1,250,155 1,353,618 (7.6)
Radio/Entertainment 6,056 9,661 (37.3) 23,723 32,765 (27.6) 248,612 242,779 2.4
Segment Total 125,976 143,044 (11.9) 342,635 385,202 (11.1) 1,498,767 1,596,397 (6.1)
Consolidated Revenues $ 538,990 $ 574,225 (6.1) $ 1,414,995 $ 1,484,148 (4.7) $ 5,595,617 $ 5,726,247 (2.3)
(A) Publishing advertising and other revenues for 2004 have been reclassified to conform with the 2005 presentation. There was no effect on total revenues.
17
11. TRIBUNE COMPANY
SUMMARY OF NEWSPAPER ADVERTISING VOLUME (Unaudited) (A)
(In thousands)
Period 12 (5 Weeks) Fourth Quarter (13 Weeks) Year-to-Date (52 Weeks)
% % %
2005 2004 Change 2005 2004 Change 2005 2004 Change
Full Run
L.A. Times 266 309 (13.9) 620 692 (10.4) 2,256 2,477 (8.9)
Chicago Tribune 211 217 (2.8) 583 572 1.9 2,129 2,166 (1.7)
Newsday 138 147 (6.1) 376 398 (5.5) 1,523 1,560 (2.4)
Other Daily Newspapers (B) 1,393 1,387 0.4 3,632 3,647 (0.4) 13,869 14,260 (2.7)
Total 2,008 2,060 (2.5) 5,211 5,309 (1.8) 19,777 20,463 (3.4)
Part Run
L.A. Times 460 531 (13.4) 1,280 1,486 (13.9) 5,319 5,914 (10.1)
Chicago Tribune 540 542 (0.4) 1,551 1,646 (5.8) 6,497 6,464 0.5
Newsday 163 180 (9.4) 502 516 (2.7) 2,041 1,936 5.4
Other Daily Newspapers (B) 586 600 (2.3) 1,563 1,636 (4.5) 6,255 6,261 (0.1)
Total 1,749 1,853 (5.6) 4,896 5,284 (7.3) 20,112 20,575 (2.3)
Total Advertising Inches
Full Run
Retail 773 820 (5.7) 1,726 1,852 (6.8) 5,980 6,200 (3.5)
National 401 433 (7.4) 1,033 1,085 (4.8) 3,774 3,998 (5.6)
Classified 834 807 3.3 2,452 2,372 3.4 10,023 10,265 (2.4)
Sub-Total 2,008 2,060 (2.5) 5,211 5,309 (1.8) 19,777 20,463 (3.4)
Part Run 1,749 1,853 (5.6) 4,896 5,284 (7.3) 20,112 20,575 (2.3)
Total 3,757 3,913 (4.0) 10,107 10,593 (4.6) 39,889 41,038 (2.8)
Preprint Pieces
L.A. Times 511,690 484,542 5.6 1,141,316 1,091,771 4.5 3,937,345 3,622,143 8.7
Chicago Tribune 494,259 488,446 1.2 1,165,239 1,129,155 3.2 4,219,676 3,989,953 5.8
Newsday 268,037 361,946 (25.9) 640,781 825,687 (22.4) 2,600,810 2,874,383 (9.5)
Other Daily Newspapers (B) 528,104 554,836 (4.8) 1,191,202 1,232,271 (3.3) 4,171,216 4,193,530 (0.5)
Total 1,802,090 1,889,770 (4.6) 4,138,538 4,278,884 (3.3) 14,929,047 14,680,009 1.7
(A) Volume for 2004 has been modified to conform with the 2005 presentation. Volume is based on preliminary internal data,
which may be updated in subsequent reports. Advertising volume is presented only for daily newspapers.
(B) Other daily newspapers include The Baltimore Sun, South Florida Sun-Sentinel, Orlando Sentinel, The Hartford Courant,
The Morning Call, Daily Press, The Advocate, Greenwich Time, Hoy, New York, Hoy, Chicago and Hoy, Los Angeles.
18