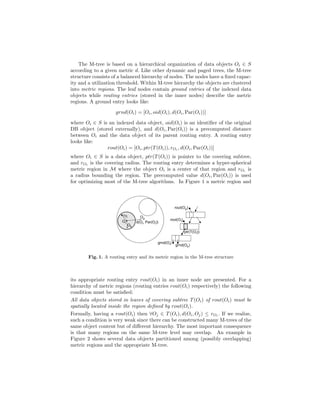
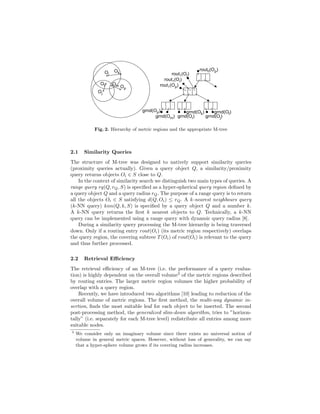
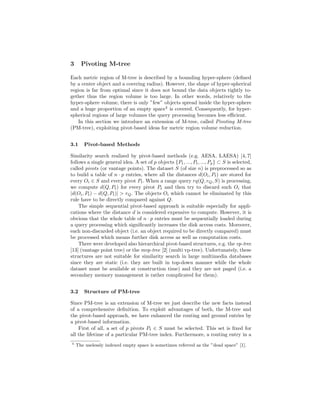
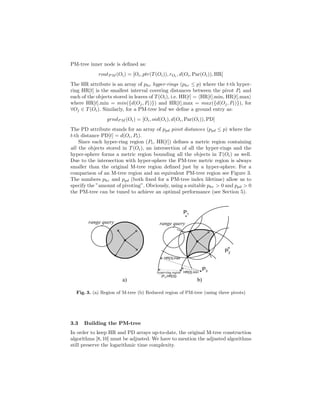
SlideShare a Scribd company logo
PM-tree: Pivoting Metric Tree for Similarity
         Search in Multimedia Databases

               Tom´ˇ Skopal1 , Jaroslav Pokorn´2 , and V´clav Sn´ˇel1
                  as                          y         a       as
                                           ˇ
     1
         Department of Computer Science, VSB–Technical University of Ostrava,
              Czech Republic {tomas.skopal, vaclav.snasel}@vsb.cz
         2
           Department of Software Engineering, Charles University in Prague,
                   Czech Republic pokorny@ksi.ms.mff.cuni.cz


         Abstract. In this paper we introduce the Pivoting M-tree (PM-tree),
         a metric access method combining M-tree with the pivot-based approach.
         While in M-tree a metric region is represented by a hyper-sphere, in
         PM-tree the shape of a metric region is determined by intersection of
         the hyper-sphere and a set of hyper-rings. The set of hyper-rings for each
         metric region is related to a fixed set of pivot objects. As a consequence,
         the shape of a metric region bounds the indexed objects more tightly
         which, in turn, significantly improves the overall efficiency of similarity
         search. We present basic algorithms on PM-tree and two cost models for
         range query processing. Finally, the PM-tree efficiency is experimentally
         evaluated on large synthetic as well as real-world datasets.


 Keywords: PM-tree, M-tree, pivot-based methods, efficient similarity search

1   Introduction
The volume of various multimedia collections worldwide rapidly increases and
the need for an efficient content-based similarity search in large multimedia
databases becomes stronger. Since a multimedia document is modelled by an
object (usually a vector) in a feature space U, the whole collection of documents
(the multimedia database) can be represented as a dataset S ⊂ U. A similarity
function is often modelled using a metric, i.e. a distance function d satisfying
reflexivity, positivity, symmetry, and triangular inequality.
    Given a metric space M = (U, d), the metric access methods (MAMs) [4]
organize (or index) objects in dataset S just using the metric d. The MAMs try
to recognize a metric structure hidden in S and exploit it for an efficient search.
Common to all MAMs is that during search process the triangular inequality of
d allows to discard some irrelevant subparts of the metric structure.

2   M-tree
Among many of metric access methods developed so far, the M-tree [5, 8] (and
its modifications Slim-tree [11], M+ -tree [14]) is still the only indexing technique
suitable for an efficient similarity search in large multimedia databases.
The M-tree is based on a hierarchical organization of data objects Oi ∈ S
according to a given metric d. Like other dynamic and paged trees, the M-tree
structure consists of a balanced hierarchy of nodes. The nodes have a fixed capac-
ity and a utilization threshold. Within M-tree hierarchy the objects are clustered
into metric regions. The leaf nodes contain ground entries of the indexed data
objects while routing entries (stored in the inner nodes) describe the metric
regions. A ground entry looks like:

                     grnd(Oi ) = [Oi , oid(Oi ), d(Oi , Par(Oi ))]

where Oi ∈ S is an indexed data object, oid(Oi ) is an identifier of the original
DB object (stored externally), and d(Oi , Par(Oi )) is a precomputed distance
between Oi and the data object of its parent routing entry. A routing entry
looks like:
               rout(Oi ) = [Oi , ptr(T (Oi )), rOi , d(Oi , Par(Oi ))]
where Oi ∈ S is a data object, ptr(T (Oi )) is pointer to the covering subtree,
and rOi is the covering radius. The routing entry determines a hyper-spherical
metric region in M where the object Oi is a center of that region and rOi is
a radius bounding the region. The precomputed value d(Oi , Par(Oi )) is used
for optimizing most of the M-tree algorithms. In Figure 1 a metric region and


        Fig. 1. A routing entry and its metric region in the M-tree structure


its appropriate routing entry rout(Oi ) in an inner node are presented. For a
hierarchy of metric regions (routing entries rout(Oi ) respectively) the following
condition must be satisfied:
All data objects stored in leaves of covering subtree T (Oi ) of rout(Oi ) must be
spatially located inside the region defined by rout(Oi ).
Formally, having a rout(Oi ) then ∀Oj ∈ T (Oi ), d(Oi , Oj ) ≤ rOi . If we realize,
such a condition is very weak since there can be constructed many M-trees of the
same object content but of different hierarchy. The most important consequence
is that many regions on the same M-tree level may overlap. An example in
Figure 2 shows several data objects partitioned among (possibly overlapping)
metric regions and the appropriate M-tree.
Fig. 2. Hierarchy of metric regions and the appropriate M-tree


2.1    Similarity Queries
The structure of M-tree was designed to natively support similarity queries
(proximity queries actually). Given a query object Q, a similarity/proximity
query returns objects Oi ∈ S close to Q.
    In the context of similarity search we distinguish two main types of queries. A
range query rq(Q, rQ , S) is specified as a hyper-spherical query region defined by
a query object Q and a query radius rQ . The purpose of a range query is to return
all the objects Oi ∈ S satisfying d(Q, Oi ) ≤ rQ . A k-nearest neighbours query
(k-NN query) knn(Q, k, S) is specified by a query object Q and a number k.
A k-NN query returns the first k nearest objects to Q. Technically, a k-NN
query can be implemented using a range query with dynamic query radius [8].
    During a similarity query processing the M-tree hierarchy is being traversed
down. Only if a routing entry rout(Oi ) (its metric region respectively) overlaps
the query region, the covering subtree T (Oi ) of rout(Oi ) is relevant to the query
and thus further processed.

2.2    Retrieval Efficiency
The retrieval efficiency of an M-tree (i.e. the performance of a query evalua-
tion) is highly dependent on the overall volume3 of the metric regions described
by routing entries. The larger metric region volumes the higher probability of
overlap with a query region.
    Recently, we have introduced two algorithms [10] leading to reduction of the
overall volume of metric regions. The first method, the multi-way dynamic in-
sertion, finds the most suitable leaf for each object to be inserted. The second
post-processing method, the generalized slim-down algorithm, tries to ”horizon-
tally” (i.e. separately for each M-tree level) redistribute all entries among more
suitable nodes.
3
    We consider only an imaginary volume since there exists no universal notion of
    volume in general metric spaces. However, without loss of generality, we can say
    that a hyper-sphere volume grows if its covering radius increases.
3     Pivoting M-tree

Each metric region of M-tree is described by a bounding hyper-sphere (defined
by a center object and a covering radius). However, the shape of hyper-spherical
region is far from optimal since it does not bound the data objects tightly to-
gether thus the region volume is too large. In other words, relatively to the
hyper-sphere volume, there is only ”few” objects spread inside the hyper-sphere
and a huge proportion of an empty space4 is covered. Consequently, for hyper-
spherical regions of large volumes the query processing becomes less efficient.
    In this section we introduce an extension of M-tree, called Pivoting M-tree
(PM-tree), exploiting pivot-based ideas for metric region volume reduction.


3.1    Pivot-based Methods

Similarity search realized by pivot-based methods (e.g. AESA, LAESA) [4, 7]
follows a single general idea. A set of p objects {P1 , ..., Pt , ..., Pp } ⊂ S is selected,
called pivots (or vantage points). The dataset S (of size n) is preprocessed so as
to build a table of n · p entries, where all the distances d(Oi , Pt ) are stored for
every Oi ∈ S and every pivot Pt . When a range query rq(Q, rQ , S) is processing,
we compute d(Q, Pt ) for every pivot Pt and then try to discard such Oi that
|d(Oi , Pt ) − d(Q, Pt )| > rQ . The objects Oi which cannot be eliminated by this
rule have to be directly compared against Q.
    The simple sequential pivot-based approach is suitable especially for appli-
cations where the distance d is considered expensive to compute. However, it is
obvious that the whole table of n · p entries must be sequentially loaded during
a query processing which significantly increases the disk access costs. Moreover,
each non-discarded object (i.e. an object required to be directly compared) must
be processed which means further disk access as well as computation costs.
    There were developed also hierarchical pivot-based structures, e.g. the vp-tree
[13] (vantage point tree) or the mvp-tree [2] (multi vp-tree). Unfortunately, these
structures are not suitable for similarity search in large multimedia databases
since they are static (i.e. they are built in top-down manner while the whole
dataset must be available at construction time) and they are not paged (i.e. a
secondary memory management is rather complicated for them).


3.2    Structure of PM-tree

Since PM-tree is an extension of M-tree we just describe the new facts instead
of a comprehensive definition. To exploit advantages of both, the M-tree and
the pivot-based approach, we have enhanced the routing and ground entries by
a pivot-based information.
    First of all, a set of p pivots Pt ∈ S must be selected. This set is fixed for
all the lifetime of a particular PM-tree index. Furthermore, a routing entry in a
4
    The uselessly indexed empty space is sometimes referred as the ”dead space” [1].
PM-tree inner node is defined as:
            routP M (Oi ) = [Oi , ptr(T (Oi )), rOi , d(Oi , Par(Oi )), HR]
The HR attribute is an array of phr hyper-rings (phr ≤ p) where the t-th hyper-
ring HR[t] is the smallest interval covering distances between the pivot Pt and
each of the objects stored in leaves of T (Oi ), i.e. HR[t] = HR[t].min, HR[t].max
where HR[t].min = min({d(Oj , Pt )}) and HR[t].max = max({d(Oj , Pt )}), for
∀Oj ∈ T (Oi ). Similarly, for a PM-tree leaf we define a ground entry as:
                grndP M (Oi ) = [Oi , oid(Oi ), d(Oi , Par(Oi )), PD]
The PD attribute stands for an array of ppd pivot distances (ppd ≤ p) where the
t-th distance PD[t] = d(Oi , Pt ).
    Since each hyper-ring region (Pt , HR[t]) defines a metric region containing
all the objects stored in T (Oi ), an intersection of all the hyper-rings and the
hyper-sphere forms a metric region bounding all the objects in T (Oi ) as well.
Due to the intersection with hyper-sphere the PM-tree metric region is always
smaller than the original M-tree region defined just by a hyper-sphere. For a
comparison of an M-tree region and an equivalent PM-tree region see Figure 3.
The numbers phr and ppd (both fixed for a PM-tree index lifetime) allow us to
specify the ”amount of pivoting”. Obviously, using a suitable phr > 0 and ppd > 0
the PM-tree can be tuned to achieve an optimal performance (see Section 5).


  Fig. 3. (a) Region of M-tree (b) Reduced region of PM-tree (using three pivots)


3.3   Building the PM-tree
In order to keep HR and PD arrays up-to-date, the original M-tree construction
algorithms [8, 10] must be adjusted. We have to mention the adjusted algorithms
still preserve the logarithmic time complexity.
Object Insertion. After a data object Oi is inserted into a leaf the HR arrays
of all routing entries in the insertion path must be updated by values d(Oi , Pt ),
∀t ≤ phr . For the leaf node in insertion path the PD array of the new ground
entry must be updated by values d(Oi , Pt ), ∀t ≤ ppd .
Node Splitting. After a node is split a new HR array of the left new routing
entry is created by merging all appropriate intervals HR[t] (or computing HR in
case of a leaf split) stored in routing entries (ground entries respectively) of the
left new node. A new HR array of the right new routing entry is created similarly.

3.4   Query Processing
Before processing a similarity query the distances d(Q, Pt ), ∀t ≤ max(phr , ppd )
have to be computed. During a query processing the PM-tree hierarchy is being
traversed down. Only if the metric region of a routing entry rout(Oi ) is over-
lapping the query region (Q, rQ ), the covering subtree T (Oi ) is relevant to the
query and thus further processed. A routing entry is relevant to the query in
case that the query region overlaps all the hyper-rings stored in HR. Hence,
prior to the standard hyper-sphere overlap check (used by M-tree), the overlap
of hyper-rings HR[t] against the query region is checked as follows (note that no
additional distance computation is needed):
         phr
               d(Q, Pt ) − rQ ≤ HR[t].max ∧ d(Q, Pt ) + rQ ≥ HR[t].min
         t=1

   If the above condition is false, the subtree T (Oi ) is not relevant to the query
and thus can be discarded from further processing. On the leaf level an irrelevant
ground entry is determined such that the following condition is not satisfied:
                            ppd
                                  |d(Q, Pt ) − PD[t]| ≤ rQ
                            t=1

    In Figure 3 a range query situation is illustrated. Although the M-tree metric
region cannot be discarded (see Figure 3a), the PM-tree region can be safely
ignored since the hyper-ring HR[2] is not overlapped (see Figure 3b).
    The hyper-ring overlap condition can be integrated into the original M-tree
range query as well as k-NN query algorithms. In case of range query the ad-
justment is straightforward – the hyper-ring overlap condition is combined with
the original hyper-sphere overlap condition. However, the optimal M-tree k-NN
query algorithm (based on priority queue heuristics) must be redesigned which
is a subject of our future research.

3.5   Object-to-pivot Distance Representation
In order to minimize storage volume of HR and PD arrays in PM-tree nodes,
a short representation of object-to-pivot distance is required. We can represent
interval HR[t] by two 4-byte reals and a pivot distance PD[t] by one 4-byte real.
However, when (a part of) the dataset is known in advance we can approximate
the 4-byte representation by a 1-byte code. For this reason a distance distribu-
tion histogram for each pivot is created by random sampling of objects from
the dataset and comparing them against the pivot. Then a distance interval
 dmin , dmax is computed so that most of the histogram distances fall into the
interval, see an example in Figure 4 (the d+ value is an (estimated) maximum
distance of a bounded metric space M).


   Fig. 4. Distance distribution histogram, 90% distances in interval dmin , dmax


    Distance values in HR and PD are scaled into interval dmin , dmax as 1-byte
codes. Using 1-byte codes the storage savings are considerable. As an example,
for phr = 50 together with using 4-byte distances, the hyper-rings stored in an
inner node having capacity 30 entries will consume 30 · 50 · 2 · 4 = 12000 bytes
while by using 1-byte codes the hyper-rings will take 30 · 50 · 2 · 1 = 3000 bytes.


3.6   Selecting the Pivots

The methods of selecting an optimal set of pivots have been intensively studied
[9, 3] while, in general, we can say that a set of pivots is optimal such that dis-
tances among pivots are maximal (close pivots give almost the same information)
and the pivots are located outside the data clusters.
     In the context of PM-tree the optimal set of pivots causes that the M-tree
hyper-spherical region is effectively ”chopped off” by hyper-rings so that the
smallest overall volume of PM-tree regions (considering the volume of intersec-
tion of hyper-rings and the hyper-sphere) is obtained.
     In experiments presented in Section 5 we have used a cheap but effective
method which samples N groups of p pivots from the dataset S at random. The
group is selected for which the sum of distances among pivots is maximal.
4     Range Query Cost Models

In this section we present a node-based and a level-based cost models for range
query processing in PM-tree, allowing to predict the PM-tree retrieval perfor-
mance. Since PM-tree is an extension of M-tree, we have extended the original
cost models developed for M-tree [6]. Like the M-tree cost models, the PM-tree
cost models are conditioned by the following assumptions:

 – The only information used is (an estimate of) the distance distribution of ob-
   jects in a given dataset since no information about data distribution is known.
 – A biased query model is considered, i.e. the distribution of query objects is
   equal to that of data objects.
 – The dataset is supposed to have high ”homogeneity of viewpoints” (for de-
   tails we refer to [6, 8]).

The basic tool used in the cost models is a probability estimation that two
hyper-spheres overlap, i.e. (using triangular inequality of d)

Pr{spheres (O1 , rO1 ) and (O2 , rO2 ) overlapped} = Pr{d(O1 , O2 ) ≤ rO1 + rO2 }

where O1 , O2 are center objects and rO1 , rO2 are radii of the hyper-spheres.
For this purpose the overall distance distribution function is used, defined as:

                     F (x) = Pr{d(Oi , Oj ) ≤ x}, ∀Oi , Oj ∈ U

and also the relative distance distribution function is used, defined as:

                 FOk (x) = Pr{d(Ok , Oi ) ≤ x}, Ok ∈ U, ∀Oi ∈ U

For an approximate F(Ok ) evaluation a set O of s objects Oi ∈ S is sampled.
The F is computed using the s × s matrix of pairwise distances between objects
in O. For the FOk evaluation only the vector of s distances d(Oi , Ok ) is needed.


4.1    Node-based Cost Model

In the node-based cost model (NB-CM) a probability of access to each PM-tree
node is predicted. Basically, a node N is accessed if its metric region (described
by the parent routing entry of N) is overlapping the query hyper-sphere (Q, rQ ):

    Pr{node N is accessed} = Pr{metric region of N is overlapped by (Q, rQ )}

Specifically, a PM-tree node N is accessed if its metric region (defined by a
hyper-sphere and phr hyper-rings) overlaps the query hyper-sphere:
                                                  phr
Pr{N is accessed} = Pr{hyper-sphere is inter.}·         Pr{t-th hyper-ring is inter.}
                                                  t=1
and finally (for query radius rQ and the parent routing entry of N )
                                            phr
Pr{N accessed} ≈ F (rN +rQ )·                     FPt (HRN [t].max+rQ )·(1−FPt (rQ −HRN [t].min))
                                        t=1

   To determine the estimated disk access costs (DAC) for a range query, it is
sufficient to sum the above probabilities over all the m nodes in the PM-tree:
                                phr
            m
                                      FPt (HRNi [t].max+rQ )·(1−FPt (rQ −HRNi [t].min))
DAC =           F (rNi +rQ )·
                                t=1
         i=1

   The computation costs (CC) are estimated considering the probability that
a node is accessed multiplied by the number of its entries, e(Ni ), thus obtaining
                                      phr
        m
                                             FPt (HRNi [t].max+rQ )·(1−FPt (rQ −HRNi [t].min))
CC =         e(Ni )·F (rNi +rQ )·
                                      t=1
       i=1


4.2   Level-based Cost Model
The problem with NB-CM is that maintaining statistics for every node is very
time consuming when the PM-tree index is large. To overcome this, we consider a
simplified level-based cost model (LB-CM) which uses only average information
collected for each level of the PM-tree. For each level l of the tree (l = 1 for root
level, l = L for leaf level), LB-CM uses this information: ml (the number of nodes
at level l), rl (the average value of covering radius considering all the nodes at
level l), HRl [i].min and HRl [i].max (the average information about hyper-rings
considering all the nodes at level l). Given these statistics, the number of nodes
accessed by a range query can be estimated as
                                      phr
            L
DAC ≈           ml · F (rl + rQ ) ·         FPt (HRl [t].max + rQ ) · (1 − FPt (rQ − HRl [t].min))
                                      t=1
         l=1

Similarly, we can estimate computation costs as
                                      phr
        L
CC ≈         ml+1 ·F (rl +rQ )·             FPt (HRl [t].max+rQ )·(1−FPt (rQ −HRl [t].min))
                                      t=1
       l=1

                def
where mL+1 = n is the number of indexed objects.

4.3   Experimental Evaluation
In order to evaluate accuracy of the presented cost models we have made several
experiments on a synthetic dataset. The dataset consisted of 10,000 10-dimensional
tuples (embedded inside unitary hyper-cube) uniformly distributed among 100
                                                 √
                                    +
L2 -spherical clusters of diameter d (where d+ = 10). The labels ”PM-tree(x,y)”
                                   10
in the graphs below are described in Section 5.
Fig. 5. Number of pivots, query sel. 200 objs. (a) Disk access costs (b)
Computation costs


The first set of experiments investigated the accuracy of estimates according to
the increasing number of pivots used by the PM-tree. The range query selectivity
(the average number of objects in the query result) was set to 200. In Figure
5a the estimated DAC as well as the real DAC are presented. The relative error
of NB-CM estimates is below 0.2. Surprisingly, the relative error of LB-CM
estimates is smaller than for NB-CM, below 0.15. The estimates of computation
costs, presented in Figure 5b, are even more accurate than for the DAC estimates,
below 0.05 (for NB-CM) and 0.04 (for LB-CM).


The second set of experiments was focused on the accuracy of estimates according
to the increasing query selectivity. The relative error of NB-CM DAC estimates
(see Figure 6a) is below 0.1. Again, the relative error of LB-CM estimates is very
small, below 0.02. The error of computation costs (see Figure 6b) is below 0.07
(for NB-CM) and 0.05 (for LB-CM).

5   Experimental Results
In order to evaluate the overall PM-tree performance we present some results
of experiments made on large synthetic as well as real-world vector datasets. In
most of the experiments the retrieval efficiency of range query processing was
examined. The query objects were randomly selected from the respective dataset
while each particular query test consisted of 1000 range queries of the same
query selectivity. The results were averaged. Euclidean (L2 ) metric was used.
The experiments were aimed to compare PM-tree with M-tree – a comparison
with other MAMs was out of scope of this paper.
Fig. 6. Query selectivity: (a) Disk access costs (b) Computation costs


Abbreviations in Figures. Each label of form ”PM-tree(x,y)” stands for
a PM-tree index where phr = x and ppd = y. A label ”<index> + SlimDown”
denotes an index subsequently post-processed using the slim-down algorithm
(for details about the slim-down algorithm we refer to [10]).


5.1     Synthetic Datasets

For the first set of experiments a collection of 8 synthetic vector datasets of
increasing dimensionality (from D = 4 to D = 60) was generated. Each dataset
(embedded inside unitary hyper-cube) consisted of 100,000 D-dimensional tuples
uniformly distributed within 1000 L2 -spherical uniformly distributed clusters.
                                                        √
                                      +
The diameter of each cluster was d where d+ = D. These datasets were
                                     10
indexed by PM-tree (for various phr and ppd ) as well as by M-tree. Some statistics
about the created indices are described in Table 1 (for explanation see [10]).

           Table 1. PM-tree index statistics (synthetic datasets)

Construction methods: SingleWay + MinMax (+ SlimDown)
     Dimensionalities: 4,8,16,20,30,40,50,60   Inner node capacities: 10 – 28
       Index file sizes: 4.5 MB – 55 MB          Leaf node capacities: 16 – 36
      Pivot file sizes5 : 2 KB – 17 KB          Avg. node utilization: 66%
Node (disk page) sizes: 1 KB (D = 4, 8), 2 KB (D = 16, 20), 4 KB (D ≥ 30)


5
    Access costs to the pivot files, storing pivots Pt and the scaling intervals for all pivots
    (see Section 3.5), were not considered because of their negligible sizes.
Fig. 7. Construction costs (30D indices): (a) Disk access costs (b) Computation costs


Index construction costs (for 30-dimensional indices) according to the increasing
number of pivots are presented in Figure 7. The disk access costs for PM-tree
indices with up to 8 pivots are similar to those of M-tree index (see Figure 7a).
For PM-tree(128, 0) and PM-tree(128, 28) indices the DAC are about 1.4 times
higher than for the M-tree index. The increasing trend of computation costs
(see Figure 7b) depends mainly on the p object-to-pivot distance computations
made during each object insertion – additional computations are needed after
leaf splitting in order to create HR arrays of the new routing entries.


Fig. 8. Number of pivots (30-dim. indices, query selectivity 50 objs.): (a) DAC (b) CC
In Figure 8 the range query costs (for 30-dimensional indices and query selec-
tivity 50 objects) according to the number of pivots are presented. The DAC
rapidly decrease with the increasing number of pivots. The PM-tree(128, 0) and
PM-tree(128, 28) indices need only 27% of DAC spent by the M-tree index.
Moreover, the PM-tree is superior even after the slim-down algorithm post-
processing, e.g. the ”slimmed” PM-tree(128, 0) index needs only 23% of DAC
spent by the ”slimmed” M-tree index (and only 6.7% of DAC spent by the or-
dinary M-tree). The decreasing trend of computation costs is even more steep
than for DAC, the PM-tree(128, 28) index needs only 5.5% of the M-tree CC.


Fig. 9. Dimensionality (query selectivity 50 objects): (a) Disk access costs (b) Com-
putation costs


    The influence of increasing dimensionality D is depicted in Figure 9. Since
the disk page sizes for different indices vary, the DAC as well as the CC are
related (in percent) to the DAC (CC resp.) of M-tree indices. For 8 ≤ D ≤ 40
the DAC stay approximately fixed, for D > 40 the DAC slightly increase.

5.2   Image Database
For the second set of experiments a collection of about 10,000 web-crawled images
[12] was used. Each image was converted into a 256-level gray scale and a fre-
quency histogram was extracted. For indexing the histograms (256-dimensional
vectors actually) were used together with the euclidean metric. The statistics
about image indices are described in Table 2.
Table 2. PM-tree index statistics (image database)

  Construction methods: SingleWay + MinMax (+ SlimDown)
        Dimensionality: 256              Inner node capacities: 10 – 31
         Index file sizes: 16 MB – 20 MB   Leaf node capacities: 29 – 31
         Pivot file sizes: 4 KB – 1 MB    Avg. node utilization: 67%
  Node (disk page) size: 32 KB

    In Figure 10a the DAC for increasing number of pivots are presented. We can
see that e.g. the ”slimmed” PM-tree(1024,50) index consumes only 42% of DAC
spent by the ”slimmed” M-tree index. The computation costs (see Figure 10b)
for p ≤ 64 decrease (down to 36% of M-tree CC). However, for p > 64 the overall
computation costs grow since the number of necessarily computed query-to-pivot
distances (i.e. p distance computations for each query) is proportionally too large.
Nevertheless, this fact is dependent on the database size – obviously, for 100,000
objects (images) the proportion of p query-to-pivot distance computations would
be smaller when compared with the overall computation costs.


     Fig. 10. Number of pivots (query selectivity 50 objects): (a) DAC (b) CC


   Finally, the costs according to the increasing range query selectivity are pre-
sented in Figure 11. The disk access costs stay below 73% of M-tree DAC (below
58% in case of ”slimmed” indices) while the computation costs stay below 43%
(49% respectively).
Fig. 11. Query selectivity: (a) Disk access costs (b) Computation costs


5.3   Summary
The experiments on synthetic datasets and mainly on the real dataset have
demonstrated the general benefits of PM-tree. The index construction (object
insertion respectively) is dynamic and still preserves the logarithmic time com-
plexity. For suitably high phr and ppd the index size growth is minor. This is
true especially for high-dimensional datasets (e.g. the 256-dimensional image
dataset) where the size of pivoting information stored in ground/routing entries
is negligible when compared with the size of the data object (i.e. vector) it-
self. A particular (but not serious) limitation of the PM-tree is that a part of
the dataset must be known in advance (for the choice of pivots and when used
object-to-pivot distance distribution histograms).
    Furthermore, the PM-tree could serve as a constructionally much cheaper
alternative to the slim-down algorithm on M-tree – the above presented experi-
mental results have shown that the retrieval performance of PM-tree (with suffi-
ciently high phr , ppd ) is comparable or even better than an equivalent ”slimmed”
M-tree. Finally, a combination of PM-tree and the slim-down algorithm makes
the PM-tree a very efficient metric access method.


6     Conclusions and Outlook
In this paper the Pivoting M-tree (PM-tree) was introduced. The PM-tree com-
bines M-tree hierarchy of metric regions with the idea of pivot-based methods.
The result is a flexible metric access method providing even more efficient simi-
larity search than the M-tree. Two cost models for range query processing were
proposed and evaluated. Experimental results on synthetic as well as real-world
datasets have shown that PM-tree is more efficient when compared with the
M-tree.
In the future we plan to develop new PM-tree construction algorithms ex-
ploiting the pivot-based information. Second, an optimal PM-tree k-NN query
algorithm has to be designed and a cost model formulated. Finally, we would like
to modify several spatial access methods by utilizing the pivoting information,
in particular the R-tree family.
                                                          ˇ
This research has been partially supported by grant Nr. GACR 201/00/1031 of
the Grant Agency of the Czech Republic.

References
 1. C. B¨hm, S. Berchtold, and D. Keim. Searching in High-Dimensional Spaces –
         o
    Index Structures for Improving the Performance of Multimedia Databases. ACM
    Computing Surveys, 33(3):322–373, 2001.
                          ¨
 2. T. Bozkaya and M. Ozgsoyoglu. Distance-based indexing for high-dimensional
    metric spaces. In Proceedings of the 1997 ACM SIGMOD International Conference
    on Management of Data, Tuscon, AZ, pages 357–368, 1997.
 3. B. Bustos, G. Navarro, and E. Ch´vez. Pivot selection techniques for proximity
                                        a
    searching in metric spaces. Pattern Recognition Letters, 24(14):2357–2366, 2003.
 4. E. Ch´vez, G. Navarro, R. Baeza-Yates, and J. Marroqu´ Searching in Metric
          a                                                    ın.
    Spaces. ACM Computing Surveys, 33(3):273–321, 2001.
 5. P. Ciaccia, M. Patella, and P. Zezula. M-tree: An Efficient Access Method for
    Similarity Search in Metric Spaces. In Proceedings of the 23rd Athens Intern.
    Conf. on VLDB, pages 426–435. Morgan Kaufmann, 1997.
 6. P. Ciaccia, M. Patella, and P. Zezula. A cost model for similarity queries in metric
    spaces. In Proceedings of the Seventeenth ACM SIGACT-SIGMOD-SIGART Sym-
    posium on Principles of Database Systems, June 1-3, 1998, Seattle, Washington,
    pages 59–68. ACM Press, 1998.
 7. L. Mico, J. Oncina, and E. Vidal. A new version of the nearest-neighbor approxi-
    mating and eliminating search (aesa) with linear preprocessing-time and memory
    requirements. Pattern Recognition Letters, 15:9–17, 1994.
 8. M. Patella. Similarity Search in Multimedia Databases. PhD thesis, Dipartmento
    di Elettronica Informatica e Sistemistica, Bologna, 1999.
 9. M. Shapiro. The choice of reference points in best-match file searching. Commu-
    nications of the ACM, 20(5):339–343, 1977.
10. T. Skopal, J. Pokorn´, M. Kr´tk´, and V. Sn´ˇel. Revisiting M-tree Building
                          y         ay              as
    Principles. In ADBIS 2003, LNCS 2798, Springer-Verlag, Dresden, Germany,
    2003.
11. C. Traina Jr., A. Traina, B. Seeger, and C. Faloutsos. Slim-Trees: High perfor-
    mance metric trees minimizing overlap between nodes. Lecture Notes in Computer
    Science, 1777, 2000.
12. WBIIS project: Wavelet-based Image Indexing and Searching, Stanford University,
    http://wang.ist.psu.edu/.
13. P. N. Yanilos. Data Structures and Algorithms for Nearest Neighbor Search in
    General Metric Spaces. In Proceedings of Fourth Annual ACM/SIGACT-SIAM
    Symposium on Discrete Algorithms - SODA, pages 311–321, 1993.
14. X. Zhou, G. Wang, J. Y. Xu, and G. Yu. M+-tree: A New Dynamical Multidi-
    mensional Index for Metric Spaces. In Proceedings of the Fourteenth Australasian
    Database Conference - ADC’03, Adelaide, Australia, 2003.

More Related Content

What's hot

Embedding bus and ring into hex cell
Embedding bus and ring into hex cellEmbedding bus and ring into hex cell
Embedding bus and ring into hex cell
IJCNCJournal
 
AN EFFECT OF USING A STORAGE MEDIUM IN DIJKSTRA ALGORITHM PERFORMANCE FOR IDE...
AN EFFECT OF USING A STORAGE MEDIUM IN DIJKSTRA ALGORITHM PERFORMANCE FOR IDE...AN EFFECT OF USING A STORAGE MEDIUM IN DIJKSTRA ALGORITHM PERFORMANCE FOR IDE...
AN EFFECT OF USING A STORAGE MEDIUM IN DIJKSTRA ALGORITHM PERFORMANCE FOR IDE...
ijcsit
 
Parallel Key Value Pattern Matching Model
Parallel Key Value Pattern Matching ModelParallel Key Value Pattern Matching Model
Parallel Key Value Pattern Matching Model
ijsrd.com
 
Hybrid geo textual index structure
Hybrid geo textual index structureHybrid geo textual index structure
Hybrid geo textual index structure
cseij
 
A new link based approach for categorical data clustering
A new link based approach for categorical data clusteringA new link based approach for categorical data clustering
A new link based approach for categorical data clustering
International Journal of Science and Research (IJSR)
 
Rank based similarity search reducing the dimensional dependence
Rank based similarity search reducing the dimensional dependenceRank based similarity search reducing the dimensional dependence
Rank based similarity search reducing the dimensional dependence
redpel dot com
 
A Novel Multi- Viewpoint based Similarity Measure for Document Clustering
A Novel Multi- Viewpoint based Similarity Measure for Document ClusteringA Novel Multi- Viewpoint based Similarity Measure for Document Clustering
A Novel Multi- Viewpoint based Similarity Measure for Document Clustering
IJMER
 
Subgraph matching with set similarity in a
Subgraph matching with set similarity in aSubgraph matching with set similarity in a
Subgraph matching with set similarity in aNexgen Technology
 
Query Optimization Techniques in Graph Databases
Query Optimization Techniques in Graph DatabasesQuery Optimization Techniques in Graph Databases
Query Optimization Techniques in Graph Databases
ijdms
 
International Journal of Engineering Research and Development
International Journal of Engineering Research and DevelopmentInternational Journal of Engineering Research and Development
International Journal of Engineering Research and Development
IJERD Editor
 
A general weighted_fuzzy_clustering_algorithm
A general weighted_fuzzy_clustering_algorithmA general weighted_fuzzy_clustering_algorithm
A general weighted_fuzzy_clustering_algorithmTA Minh Thuy
 
SPATIAL R-TREE INDEX BASED ON GRID DIVISION FOR QUERY PROCESSING
SPATIAL R-TREE INDEX BASED ON GRID DIVISION FOR QUERY PROCESSINGSPATIAL R-TREE INDEX BASED ON GRID DIVISION FOR QUERY PROCESSING
SPATIAL R-TREE INDEX BASED ON GRID DIVISION FOR QUERY PROCESSING
ijdms
 
Data clustering using map reduce
Data clustering using map reduceData clustering using map reduce
Data clustering using map reduce
Varad Meru
 
E1062530
E1062530E1062530
E1062530
IJERD Editor
 
An artificial immune system algorithm for solving the uncapacitated single all...
An artificial immune system algorithm for solving the uncapacitated single all...An artificial immune system algorithm for solving the uncapacitated single all...
An artificial immune system algorithm for solving the uncapacitated single all...
IJECEIAES
 
TASK-DECOMPOSITION BASED ANOMALY DETECTION OF MASSIVE AND HIGH-VOLATILITY SES...
TASK-DECOMPOSITION BASED ANOMALY DETECTION OF MASSIVE AND HIGH-VOLATILITY SES...TASK-DECOMPOSITION BASED ANOMALY DETECTION OF MASSIVE AND HIGH-VOLATILITY SES...
TASK-DECOMPOSITION BASED ANOMALY DETECTION OF MASSIVE AND HIGH-VOLATILITY SES...
ijdpsjournal
 
Data stream mining techniques: a review
Data stream mining techniques: a reviewData stream mining techniques: a review
Data stream mining techniques: a review
TELKOMNIKA JOURNAL
 
IJSETR-VOL-3-ISSUE-12-3358-3363
IJSETR-VOL-3-ISSUE-12-3358-3363IJSETR-VOL-3-ISSUE-12-3358-3363
IJSETR-VOL-3-ISSUE-12-3358-3363SHIVA REDDY
 

What's hot (18)

Embedding bus and ring into hex cell
Embedding bus and ring into hex cellEmbedding bus and ring into hex cell
Embedding bus and ring into hex cell
 
AN EFFECT OF USING A STORAGE MEDIUM IN DIJKSTRA ALGORITHM PERFORMANCE FOR IDE...
AN EFFECT OF USING A STORAGE MEDIUM IN DIJKSTRA ALGORITHM PERFORMANCE FOR IDE...AN EFFECT OF USING A STORAGE MEDIUM IN DIJKSTRA ALGORITHM PERFORMANCE FOR IDE...
AN EFFECT OF USING A STORAGE MEDIUM IN DIJKSTRA ALGORITHM PERFORMANCE FOR IDE...
 
Parallel Key Value Pattern Matching Model
Parallel Key Value Pattern Matching ModelParallel Key Value Pattern Matching Model
Parallel Key Value Pattern Matching Model
 
Hybrid geo textual index structure
Hybrid geo textual index structureHybrid geo textual index structure
Hybrid geo textual index structure
 
A new link based approach for categorical data clustering
A new link based approach for categorical data clusteringA new link based approach for categorical data clustering
A new link based approach for categorical data clustering
 
Rank based similarity search reducing the dimensional dependence
Rank based similarity search reducing the dimensional dependenceRank based similarity search reducing the dimensional dependence
Rank based similarity search reducing the dimensional dependence
 
A Novel Multi- Viewpoint based Similarity Measure for Document Clustering
A Novel Multi- Viewpoint based Similarity Measure for Document ClusteringA Novel Multi- Viewpoint based Similarity Measure for Document Clustering
A Novel Multi- Viewpoint based Similarity Measure for Document Clustering
 
Subgraph matching with set similarity in a
Subgraph matching with set similarity in aSubgraph matching with set similarity in a
Subgraph matching with set similarity in a
 
Query Optimization Techniques in Graph Databases
Query Optimization Techniques in Graph DatabasesQuery Optimization Techniques in Graph Databases
Query Optimization Techniques in Graph Databases
 
International Journal of Engineering Research and Development
International Journal of Engineering Research and DevelopmentInternational Journal of Engineering Research and Development
International Journal of Engineering Research and Development
 
A general weighted_fuzzy_clustering_algorithm
A general weighted_fuzzy_clustering_algorithmA general weighted_fuzzy_clustering_algorithm
A general weighted_fuzzy_clustering_algorithm
 
SPATIAL R-TREE INDEX BASED ON GRID DIVISION FOR QUERY PROCESSING
SPATIAL R-TREE INDEX BASED ON GRID DIVISION FOR QUERY PROCESSINGSPATIAL R-TREE INDEX BASED ON GRID DIVISION FOR QUERY PROCESSING
SPATIAL R-TREE INDEX BASED ON GRID DIVISION FOR QUERY PROCESSING
 
Data clustering using map reduce
Data clustering using map reduceData clustering using map reduce
Data clustering using map reduce
 
E1062530
E1062530E1062530
E1062530
 
An artificial immune system algorithm for solving the uncapacitated single all...
An artificial immune system algorithm for solving the uncapacitated single all...An artificial immune system algorithm for solving the uncapacitated single all...
An artificial immune system algorithm for solving the uncapacitated single all...
 
TASK-DECOMPOSITION BASED ANOMALY DETECTION OF MASSIVE AND HIGH-VOLATILITY SES...
TASK-DECOMPOSITION BASED ANOMALY DETECTION OF MASSIVE AND HIGH-VOLATILITY SES...TASK-DECOMPOSITION BASED ANOMALY DETECTION OF MASSIVE AND HIGH-VOLATILITY SES...
TASK-DECOMPOSITION BASED ANOMALY DETECTION OF MASSIVE AND HIGH-VOLATILITY SES...
 
Data stream mining techniques: a review
Data stream mining techniques: a reviewData stream mining techniques: a review
Data stream mining techniques: a review
 
IJSETR-VOL-3-ISSUE-12-3358-3363
IJSETR-VOL-3-ISSUE-12-3358-3363IJSETR-VOL-3-ISSUE-12-3358-3363
IJSETR-VOL-3-ISSUE-12-3358-3363
 

Viewers also liked

Funding Re Projects Crisp Presentation To Suzlon
Funding Re Projects   Crisp Presentation To SuzlonFunding Re Projects   Crisp Presentation To Suzlon
Funding Re Projects Crisp Presentation To Suzlon
DermotDuncan
 
What is Virtual Reality really?
What is Virtual Reality really?What is Virtual Reality really?
What is Virtual Reality really?
Robert Anstett
 
Broward Academy 2016 - Creation Station
Broward Academy 2016 - Creation StationBroward Academy 2016 - Creation Station
Broward Academy 2016 - Creation Station
Robert Anstett
 
Business Sustainability Strategy 1
Business Sustainability Strategy 1Business Sustainability Strategy 1
Business Sustainability Strategy 1DermotDuncan
 
Four5One Creative\'s Company Overview and examples of our work
Four5One Creative\'s Company Overview and examples of our workFour5One Creative\'s Company Overview and examples of our work
Four5One Creative\'s Company Overview and examples of our work
KillianKavanagh
 
Transcript Climate Change Climate Proofing Interview (Final) 3 2
Transcript Climate Change Climate Proofing Interview (Final) 3 2Transcript Climate Change Climate Proofing Interview (Final) 3 2
Transcript Climate Change Climate Proofing Interview (Final) 3 2
DermotDuncan
 
Html For Beginners 2
Html For Beginners 2Html For Beginners 2
Html For Beginners 2
Sriram Raj
 
Social media webinar Nov 2016
Social media webinar Nov 2016Social media webinar Nov 2016
Social media webinar Nov 2016
Robert Anstett
 
Financing Energy Efficiency Projects Presentation
Financing Energy Efficiency Projects PresentationFinancing Energy Efficiency Projects Presentation
Financing Energy Efficiency Projects Presentation
DermotDuncan
 
Mosquito Attack
Mosquito AttackMosquito Attack
Mosquito Attack
Hirohito Kato
 
Find the techie within you
Find the techie within youFind the techie within you
Find the techie within youselvakn
 
Executive Summary Of Federal State Climate Change Policy Rebates Grants
Executive Summary Of Federal State Climate Change Policy Rebates GrantsExecutive Summary Of Federal State Climate Change Policy Rebates Grants
Executive Summary Of Federal State Climate Change Policy Rebates GrantsDermotDuncan
 
Makers all around you - expanded
Makers all around you - expanded Makers all around you - expanded
Makers all around you - expanded
Robert Anstett
 
понятие как форма мышления. определение понятия
понятие как форма мышления. определение понятияпонятие как форма мышления. определение понятия
понятие как форма мышления. определение понятия
klushnikovaea
 
m tree
m treem tree
m tree
Sriram Raj
 
subversion hacks (create a commit template)
subversion hacks (create a commit template)subversion hacks (create a commit template)
subversion hacks (create a commit template)
Hirohito Kato
 
UK Renewable Energy Presentation 2006
UK Renewable Energy Presentation 2006UK Renewable Energy Presentation 2006
UK Renewable Energy Presentation 2006
DermotDuncan
 
Git flowの活用事例
Git flowの活用事例Git flowの活用事例
Git flowの活用事例
Hirohito Kato
 

Viewers also liked (18)

Funding Re Projects Crisp Presentation To Suzlon
Funding Re Projects   Crisp Presentation To SuzlonFunding Re Projects   Crisp Presentation To Suzlon
Funding Re Projects Crisp Presentation To Suzlon
 
What is Virtual Reality really?
What is Virtual Reality really?What is Virtual Reality really?
What is Virtual Reality really?
 
Broward Academy 2016 - Creation Station
Broward Academy 2016 - Creation StationBroward Academy 2016 - Creation Station
Broward Academy 2016 - Creation Station
 
Business Sustainability Strategy 1
Business Sustainability Strategy 1Business Sustainability Strategy 1
Business Sustainability Strategy 1
 
Four5One Creative\'s Company Overview and examples of our work
Four5One Creative\'s Company Overview and examples of our workFour5One Creative\'s Company Overview and examples of our work
Four5One Creative\'s Company Overview and examples of our work
 
Transcript Climate Change Climate Proofing Interview (Final) 3 2
Transcript Climate Change Climate Proofing Interview (Final) 3 2Transcript Climate Change Climate Proofing Interview (Final) 3 2
Transcript Climate Change Climate Proofing Interview (Final) 3 2
 
Html For Beginners 2
Html For Beginners 2Html For Beginners 2
Html For Beginners 2
 
Social media webinar Nov 2016
Social media webinar Nov 2016Social media webinar Nov 2016
Social media webinar Nov 2016
 
Financing Energy Efficiency Projects Presentation
Financing Energy Efficiency Projects PresentationFinancing Energy Efficiency Projects Presentation
Financing Energy Efficiency Projects Presentation
 
Mosquito Attack
Mosquito AttackMosquito Attack
Mosquito Attack
 
Find the techie within you
Find the techie within youFind the techie within you
Find the techie within you
 
Executive Summary Of Federal State Climate Change Policy Rebates Grants
Executive Summary Of Federal State Climate Change Policy Rebates GrantsExecutive Summary Of Federal State Climate Change Policy Rebates Grants
Executive Summary Of Federal State Climate Change Policy Rebates Grants
 
Makers all around you - expanded
Makers all around you - expanded Makers all around you - expanded
Makers all around you - expanded
 
понятие как форма мышления. определение понятия
понятие как форма мышления. определение понятияпонятие как форма мышления. определение понятия
понятие как форма мышления. определение понятия
 
m tree
m treem tree
m tree
 
subversion hacks (create a commit template)
subversion hacks (create a commit template)subversion hacks (create a commit template)
subversion hacks (create a commit template)
 
UK Renewable Energy Presentation 2006
UK Renewable Energy Presentation 2006UK Renewable Energy Presentation 2006
UK Renewable Energy Presentation 2006
 
Git flowの活用事例
Git flowの活用事例Git flowの活用事例
Git flowの活用事例
 

Similar to Trees Information

Trajectory Segmentation and Sampling of Moving Objects Based On Representativ...
Trajectory Segmentation and Sampling of Moving Objects Based On Representativ...Trajectory Segmentation and Sampling of Moving Objects Based On Representativ...
Trajectory Segmentation and Sampling of Moving Objects Based On Representativ...
ijsrd.com
 
Volume 2-issue-6-1930-1932
Volume 2-issue-6-1930-1932Volume 2-issue-6-1930-1932
Volume 2-issue-6-1930-1932Editor IJARCET
 
Volume 2-issue-6-1930-1932
Volume 2-issue-6-1930-1932Volume 2-issue-6-1930-1932
Volume 2-issue-6-1930-1932Editor IJARCET
 
ROMAN URDU OPINION MINING SYSTEM (RUOMIS)
ROMAN URDU OPINION MINING SYSTEM (RUOMIS) ROMAN URDU OPINION MINING SYSTEM (RUOMIS)
ROMAN URDU OPINION MINING SYSTEM (RUOMIS)
cseij
 
Searching in high dimensional spaces index structures for improving the perfo...
Searching in high dimensional spaces index structures for improving the perfo...Searching in high dimensional spaces index structures for improving the perfo...
Searching in high dimensional spaces index structures for improving the perfo...unyil96
 
Big Data with Rough Set Using Map- Reduce
Big Data with Rough Set Using Map- ReduceBig Data with Rough Set Using Map- Reduce
Big Data with Rough Set Using Map- Reduce
ijircee
 
17 manjula aakunuri final_paper--185-190
17 manjula aakunuri final_paper--185-19017 manjula aakunuri final_paper--185-190
17 manjula aakunuri final_paper--185-190
Alexander Decker
 
ME Synopsis
ME SynopsisME Synopsis
ME Synopsis
Poonam Debnath
 
Chapter7.Revised
Chapter7.RevisedChapter7.Revised
Chapter7.Revised
Achmad Solichin
 
Roberto Trasarti PhD Thesis
Roberto Trasarti PhD ThesisRoberto Trasarti PhD Thesis
Roberto Trasarti PhD ThesisRoberto Trasarti
 
Data Structures unit I Introduction - data types
Data Structures unit I Introduction - data typesData Structures unit I Introduction - data types
Data Structures unit I Introduction - data types
AmirthaVarshini80
 
E017373946
E017373946E017373946
E017373946
IOSR Journals
 
Semi-Supervised Discriminant Analysis Based On Data Structure
Semi-Supervised Discriminant Analysis Based On Data StructureSemi-Supervised Discriminant Analysis Based On Data Structure
Semi-Supervised Discriminant Analysis Based On Data Structure
iosrjce
 
UNIT V.pdf
UNIT V.pdfUNIT V.pdf
UNIT V.pdf
MerbinJose
 
Discovering Novel Information with sentence Level clustering From Multi-docu...
Discovering Novel Information with sentence Level clustering  From Multi-docu...Discovering Novel Information with sentence Level clustering  From Multi-docu...
Discovering Novel Information with sentence Level clustering From Multi-docu...
irjes
 
Robust Block-Matching Motion Estimation of Flotation Froth Using Mutual Infor...
Robust Block-Matching Motion Estimation of Flotation Froth Using Mutual Infor...Robust Block-Matching Motion Estimation of Flotation Froth Using Mutual Infor...
Robust Block-Matching Motion Estimation of Flotation Froth Using Mutual Infor...
CSCJournals
 
23. Advanced Datatypes and New Application in DBMS
23. Advanced Datatypes and New Application in DBMS23. Advanced Datatypes and New Application in DBMS
23. Advanced Datatypes and New Application in DBMSkoolkampus
 
Pak eko 4412ijdms01
Pak eko 4412ijdms01Pak eko 4412ijdms01
Pak eko 4412ijdms01hyuviridvic
 
Spatial Approximate String Keyword content Query processing
Spatial Approximate String Keyword content Query processingSpatial Approximate String Keyword content Query processing
Spatial Approximate String Keyword content Query processing
inventionjournals
 
report2.doc
report2.docreport2.doc
report2.docbutest
 

Similar to Trees Information (20)

Trajectory Segmentation and Sampling of Moving Objects Based On Representativ...
Trajectory Segmentation and Sampling of Moving Objects Based On Representativ...Trajectory Segmentation and Sampling of Moving Objects Based On Representativ...
Trajectory Segmentation and Sampling of Moving Objects Based On Representativ...
 
Volume 2-issue-6-1930-1932
Volume 2-issue-6-1930-1932Volume 2-issue-6-1930-1932
Volume 2-issue-6-1930-1932
 
Volume 2-issue-6-1930-1932
Volume 2-issue-6-1930-1932Volume 2-issue-6-1930-1932
Volume 2-issue-6-1930-1932
 
ROMAN URDU OPINION MINING SYSTEM (RUOMIS)
ROMAN URDU OPINION MINING SYSTEM (RUOMIS) ROMAN URDU OPINION MINING SYSTEM (RUOMIS)
ROMAN URDU OPINION MINING SYSTEM (RUOMIS)
 
Searching in high dimensional spaces index structures for improving the perfo...
Searching in high dimensional spaces index structures for improving the perfo...Searching in high dimensional spaces index structures for improving the perfo...
Searching in high dimensional spaces index structures for improving the perfo...
 
Big Data with Rough Set Using Map- Reduce
Big Data with Rough Set Using Map- ReduceBig Data with Rough Set Using Map- Reduce
Big Data with Rough Set Using Map- Reduce
 
17 manjula aakunuri final_paper--185-190
17 manjula aakunuri final_paper--185-19017 manjula aakunuri final_paper--185-190
17 manjula aakunuri final_paper--185-190
 
ME Synopsis
ME SynopsisME Synopsis
ME Synopsis
 
Chapter7.Revised
Chapter7.RevisedChapter7.Revised
Chapter7.Revised
 
Roberto Trasarti PhD Thesis
Roberto Trasarti PhD ThesisRoberto Trasarti PhD Thesis
Roberto Trasarti PhD Thesis
 
Data Structures unit I Introduction - data types
Data Structures unit I Introduction - data typesData Structures unit I Introduction - data types
Data Structures unit I Introduction - data types
 
E017373946
E017373946E017373946
E017373946
 
Semi-Supervised Discriminant Analysis Based On Data Structure
Semi-Supervised Discriminant Analysis Based On Data StructureSemi-Supervised Discriminant Analysis Based On Data Structure
Semi-Supervised Discriminant Analysis Based On Data Structure
 
UNIT V.pdf
UNIT V.pdfUNIT V.pdf
UNIT V.pdf
 
Discovering Novel Information with sentence Level clustering From Multi-docu...
Discovering Novel Information with sentence Level clustering  From Multi-docu...Discovering Novel Information with sentence Level clustering  From Multi-docu...
Discovering Novel Information with sentence Level clustering From Multi-docu...
 
Robust Block-Matching Motion Estimation of Flotation Froth Using Mutual Infor...
Robust Block-Matching Motion Estimation of Flotation Froth Using Mutual Infor...Robust Block-Matching Motion Estimation of Flotation Froth Using Mutual Infor...
Robust Block-Matching Motion Estimation of Flotation Froth Using Mutual Infor...
 
23. Advanced Datatypes and New Application in DBMS
23. Advanced Datatypes and New Application in DBMS23. Advanced Datatypes and New Application in DBMS
23. Advanced Datatypes and New Application in DBMS
 
Pak eko 4412ijdms01
Pak eko 4412ijdms01Pak eko 4412ijdms01
Pak eko 4412ijdms01
 
Spatial Approximate String Keyword content Query processing
Spatial Approximate String Keyword content Query processingSpatial Approximate String Keyword content Query processing
Spatial Approximate String Keyword content Query processing
 
report2.doc
report2.docreport2.doc
report2.doc
 

More from Sriram Raj

Interviewtcs
InterviewtcsInterviewtcs
Interviewtcs
Sriram Raj
 
Pointers In C
Pointers In CPointers In C
Pointers In C
Sriram Raj
 
Data Structures Aptitude
Data Structures AptitudeData Structures Aptitude
Data Structures Aptitude
Sriram Raj
 
C Languages FAQ's
C Languages FAQ'sC Languages FAQ's
C Languages FAQ's
Sriram Raj
 
Beej Guide Network Programming
Beej Guide Network ProgrammingBeej Guide Network Programming
Beej Guide Network Programming
Sriram Raj
 
Pointers In C
Pointers In CPointers In C
Pointers In C
Sriram Raj
 
Rfc768
Rfc768Rfc768
Rfc768
Sriram Raj
 
Sctp
SctpSctp
Cracking The Interview
Cracking The InterviewCracking The Interview
Cracking The Interview
Sriram Raj
 
Queue Data Structure
Queue Data StructureQueue Data Structure
Queue Data Structure
Sriram Raj
 
Html for Beginners
Html for BeginnersHtml for Beginners
Html for Beginners
Sriram Raj
 
Deletion From A Bst
Deletion From A BstDeletion From A Bst
Deletion From A BstSriram Raj
 
Prims Algorithm
Prims AlgorithmPrims Algorithm
Prims AlgorithmSriram Raj
 
Linked List Problems
Linked List ProblemsLinked List Problems
Linked List ProblemsSriram Raj
 
Assignment Examples Final 07 Oct
Assignment Examples Final 07 OctAssignment Examples Final 07 Oct
Assignment Examples Final 07 OctSriram Raj
 

More from Sriram Raj (17)

Interviewtcs
InterviewtcsInterviewtcs
Interviewtcs
 
Pointers In C
Pointers In CPointers In C
Pointers In C
 
Data Structures Aptitude
Data Structures AptitudeData Structures Aptitude
Data Structures Aptitude
 
C Languages FAQ's
C Languages FAQ'sC Languages FAQ's
C Languages FAQ's
 
Beej Guide Network Programming
Beej Guide Network ProgrammingBeej Guide Network Programming
Beej Guide Network Programming
 
Pointers In C
Pointers In CPointers In C
Pointers In C
 
Rfc768
Rfc768Rfc768
Rfc768
 
Sctp
SctpSctp
Sctp
 
Cracking The Interview
Cracking The InterviewCracking The Interview
Cracking The Interview
 
Queue Data Structure
Queue Data StructureQueue Data Structure
Queue Data Structure
 
Html for Beginners
Html for BeginnersHtml for Beginners
Html for Beginners
 
Hash Table
Hash TableHash Table
Hash Table
 
Deletion From A Bst
Deletion From A BstDeletion From A Bst
Deletion From A Bst
 
Binary Trees
Binary TreesBinary Trees
Binary Trees
 
Prims Algorithm
Prims AlgorithmPrims Algorithm
Prims Algorithm
 
Linked List Problems
Linked List ProblemsLinked List Problems
Linked List Problems
 
Assignment Examples Final 07 Oct
Assignment Examples Final 07 OctAssignment Examples Final 07 Oct
Assignment Examples Final 07 Oct
 

Recently uploaded

GDG Cloud Southlake #33: Boule & Rebala: Effective AppSec in SDLC using Deplo...
GDG Cloud Southlake #33: Boule & Rebala: Effective AppSec in SDLC using Deplo...GDG Cloud Southlake #33: Boule & Rebala: Effective AppSec in SDLC using Deplo...
GDG Cloud Southlake #33: Boule & Rebala: Effective AppSec in SDLC using Deplo...
James Anderson
 
Mission to Decommission: Importance of Decommissioning Products to Increase E...
Mission to Decommission: Importance of Decommissioning Products to Increase E...Mission to Decommission: Importance of Decommissioning Products to Increase E...
Mission to Decommission: Importance of Decommissioning Products to Increase E...
Product School
 
UiPath Test Automation using UiPath Test Suite series, part 4
UiPath Test Automation using UiPath Test Suite series, part 4UiPath Test Automation using UiPath Test Suite series, part 4
UiPath Test Automation using UiPath Test Suite series, part 4
DianaGray10
 
Elevating Tactical DDD Patterns Through Object Calisthenics
Elevating Tactical DDD Patterns Through Object CalisthenicsElevating Tactical DDD Patterns Through Object Calisthenics
Elevating Tactical DDD Patterns Through Object Calisthenics
Dorra BARTAGUIZ
 
Neuro-symbolic is not enough, we need neuro-*semantic*
Neuro-symbolic is not enough, we need neuro-*semantic*Neuro-symbolic is not enough, we need neuro-*semantic*
Neuro-symbolic is not enough, we need neuro-*semantic*
Frank van Harmelen
 
Kubernetes & AI - Beauty and the Beast !?! @KCD Istanbul 2024
Kubernetes & AI - Beauty and the Beast !?! @KCD Istanbul 2024Kubernetes & AI - Beauty and the Beast !?! @KCD Istanbul 2024
Kubernetes & AI - Beauty and the Beast !?! @KCD Istanbul 2024
Tobias Schneck
 
Monitoring Java Application Security with JDK Tools and JFR Events
Monitoring Java Application Security with JDK Tools and JFR EventsMonitoring Java Application Security with JDK Tools and JFR Events
Monitoring Java Application Security with JDK Tools and JFR Events
Ana-Maria Mihalceanu
 
State of ICS and IoT Cyber Threat Landscape Report 2024 preview
State of ICS and IoT Cyber Threat Landscape Report 2024 previewState of ICS and IoT Cyber Threat Landscape Report 2024 preview
State of ICS and IoT Cyber Threat Landscape Report 2024 preview
Prayukth K V
 
Knowledge engineering: from people to machines and back
Knowledge engineering: from people to machines and backKnowledge engineering: from people to machines and back
Knowledge engineering: from people to machines and back
Elena Simperl
 
Dev Dives: Train smarter, not harder – active learning and UiPath LLMs for do...
Dev Dives: Train smarter, not harder – active learning and UiPath LLMs for do...Dev Dives: Train smarter, not harder – active learning and UiPath LLMs for do...
Dev Dives: Train smarter, not harder – active learning and UiPath LLMs for do...
UiPathCommunity
 
Connector Corner: Automate dynamic content and events by pushing a button
Connector Corner: Automate dynamic content and events by pushing a buttonConnector Corner: Automate dynamic content and events by pushing a button
Connector Corner: Automate dynamic content and events by pushing a button
DianaGray10
 
When stars align: studies in data quality, knowledge graphs, and machine lear...
When stars align: studies in data quality, knowledge graphs, and machine lear...When stars align: studies in data quality, knowledge graphs, and machine lear...
When stars align: studies in data quality, knowledge graphs, and machine lear...
Elena Simperl
 
The Art of the Pitch: WordPress Relationships and Sales
The Art of the Pitch: WordPress Relationships and SalesThe Art of the Pitch: WordPress Relationships and Sales
The Art of the Pitch: WordPress Relationships and Sales
Laura Byrne
 
Securing your Kubernetes cluster_ a step-by-step guide to success !
Securing your Kubernetes cluster_ a step-by-step guide to success !Securing your Kubernetes cluster_ a step-by-step guide to success !
Securing your Kubernetes cluster_ a step-by-step guide to success !
KatiaHIMEUR1
 
Accelerate your Kubernetes clusters with Varnish Caching
Accelerate your Kubernetes clusters with Varnish CachingAccelerate your Kubernetes clusters with Varnish Caching
Accelerate your Kubernetes clusters with Varnish Caching
Thijs Feryn
 
PCI PIN Basics Webinar from the Controlcase Team
PCI PIN Basics Webinar from the Controlcase TeamPCI PIN Basics Webinar from the Controlcase Team
PCI PIN Basics Webinar from the Controlcase Team
ControlCase
 
UiPath Test Automation using UiPath Test Suite series, part 3
UiPath Test Automation using UiPath Test Suite series, part 3UiPath Test Automation using UiPath Test Suite series, part 3
UiPath Test Automation using UiPath Test Suite series, part 3
DianaGray10
 
Empowering NextGen Mobility via Large Action Model Infrastructure (LAMI): pav...
Empowering NextGen Mobility via Large Action Model Infrastructure (LAMI): pav...Empowering NextGen Mobility via Large Action Model Infrastructure (LAMI): pav...
Empowering NextGen Mobility via Large Action Model Infrastructure (LAMI): pav...
Thierry Lestable
 
Bits & Pixels using AI for Good.........
Bits & Pixels using AI for Good.........Bits & Pixels using AI for Good.........
Bits & Pixels using AI for Good.........
Alison B. Lowndes
 
Key Trends Shaping the Future of Infrastructure.pdf
Key Trends Shaping the Future of Infrastructure.pdfKey Trends Shaping the Future of Infrastructure.pdf
Key Trends Shaping the Future of Infrastructure.pdf
Cheryl Hung
 

Recently uploaded (20)

GDG Cloud Southlake #33: Boule & Rebala: Effective AppSec in SDLC using Deplo...
GDG Cloud Southlake #33: Boule & Rebala: Effective AppSec in SDLC using Deplo...GDG Cloud Southlake #33: Boule & Rebala: Effective AppSec in SDLC using Deplo...
GDG Cloud Southlake #33: Boule & Rebala: Effective AppSec in SDLC using Deplo...
 
Mission to Decommission: Importance of Decommissioning Products to Increase E...
Mission to Decommission: Importance of Decommissioning Products to Increase E...Mission to Decommission: Importance of Decommissioning Products to Increase E...
Mission to Decommission: Importance of Decommissioning Products to Increase E...
 
UiPath Test Automation using UiPath Test Suite series, part 4
UiPath Test Automation using UiPath Test Suite series, part 4UiPath Test Automation using UiPath Test Suite series, part 4
UiPath Test Automation using UiPath Test Suite series, part 4
 
Elevating Tactical DDD Patterns Through Object Calisthenics
Elevating Tactical DDD Patterns Through Object CalisthenicsElevating Tactical DDD Patterns Through Object Calisthenics
Elevating Tactical DDD Patterns Through Object Calisthenics
 
Neuro-symbolic is not enough, we need neuro-*semantic*
Neuro-symbolic is not enough, we need neuro-*semantic*Neuro-symbolic is not enough, we need neuro-*semantic*
Neuro-symbolic is not enough, we need neuro-*semantic*
 
Kubernetes & AI - Beauty and the Beast !?! @KCD Istanbul 2024
Kubernetes & AI - Beauty and the Beast !?! @KCD Istanbul 2024Kubernetes & AI - Beauty and the Beast !?! @KCD Istanbul 2024
Kubernetes & AI - Beauty and the Beast !?! @KCD Istanbul 2024
 
Monitoring Java Application Security with JDK Tools and JFR Events
Monitoring Java Application Security with JDK Tools and JFR EventsMonitoring Java Application Security with JDK Tools and JFR Events
Monitoring Java Application Security with JDK Tools and JFR Events
 
State of ICS and IoT Cyber Threat Landscape Report 2024 preview
State of ICS and IoT Cyber Threat Landscape Report 2024 previewState of ICS and IoT Cyber Threat Landscape Report 2024 preview
State of ICS and IoT Cyber Threat Landscape Report 2024 preview
 
Knowledge engineering: from people to machines and back
Knowledge engineering: from people to machines and backKnowledge engineering: from people to machines and back
Knowledge engineering: from people to machines and back
 
Dev Dives: Train smarter, not harder – active learning and UiPath LLMs for do...
Dev Dives: Train smarter, not harder – active learning and UiPath LLMs for do...Dev Dives: Train smarter, not harder – active learning and UiPath LLMs for do...
Dev Dives: Train smarter, not harder – active learning and UiPath LLMs for do...
 
Connector Corner: Automate dynamic content and events by pushing a button
Connector Corner: Automate dynamic content and events by pushing a buttonConnector Corner: Automate dynamic content and events by pushing a button
Connector Corner: Automate dynamic content and events by pushing a button
 
When stars align: studies in data quality, knowledge graphs, and machine lear...
When stars align: studies in data quality, knowledge graphs, and machine lear...When stars align: studies in data quality, knowledge graphs, and machine lear...
When stars align: studies in data quality, knowledge graphs, and machine lear...
 
The Art of the Pitch: WordPress Relationships and Sales
The Art of the Pitch: WordPress Relationships and SalesThe Art of the Pitch: WordPress Relationships and Sales
The Art of the Pitch: WordPress Relationships and Sales
 
Securing your Kubernetes cluster_ a step-by-step guide to success !
Securing your Kubernetes cluster_ a step-by-step guide to success !Securing your Kubernetes cluster_ a step-by-step guide to success !
Securing your Kubernetes cluster_ a step-by-step guide to success !
 
Accelerate your Kubernetes clusters with Varnish Caching
Accelerate your Kubernetes clusters with Varnish CachingAccelerate your Kubernetes clusters with Varnish Caching
Accelerate your Kubernetes clusters with Varnish Caching
 
PCI PIN Basics Webinar from the Controlcase Team
PCI PIN Basics Webinar from the Controlcase TeamPCI PIN Basics Webinar from the Controlcase Team
PCI PIN Basics Webinar from the Controlcase Team
 
UiPath Test Automation using UiPath Test Suite series, part 3
UiPath Test Automation using UiPath Test Suite series, part 3UiPath Test Automation using UiPath Test Suite series, part 3
UiPath Test Automation using UiPath Test Suite series, part 3
 
Empowering NextGen Mobility via Large Action Model Infrastructure (LAMI): pav...
Empowering NextGen Mobility via Large Action Model Infrastructure (LAMI): pav...Empowering NextGen Mobility via Large Action Model Infrastructure (LAMI): pav...
Empowering NextGen Mobility via Large Action Model Infrastructure (LAMI): pav...
 
Bits & Pixels using AI for Good.........
Bits & Pixels using AI for Good.........Bits & Pixels using AI for Good.........
Bits & Pixels using AI for Good.........
 
Key Trends Shaping the Future of Infrastructure.pdf
Key Trends Shaping the Future of Infrastructure.pdfKey Trends Shaping the Future of Infrastructure.pdf
Key Trends Shaping the Future of Infrastructure.pdf
 

Trees Information

  • 1. PM-tree: Pivoting Metric Tree for Similarity Search in Multimedia Databases Tom´ˇ Skopal1 , Jaroslav Pokorn´2 , and V´clav Sn´ˇel1 as y a as ˇ 1 Department of Computer Science, VSB–Technical University of Ostrava, Czech Republic {tomas.skopal, vaclav.snasel}@vsb.cz 2 Department of Software Engineering, Charles University in Prague, Czech Republic pokorny@ksi.ms.mff.cuni.cz Abstract. In this paper we introduce the Pivoting M-tree (PM-tree), a metric access method combining M-tree with the pivot-based approach. While in M-tree a metric region is represented by a hyper-sphere, in PM-tree the shape of a metric region is determined by intersection of the hyper-sphere and a set of hyper-rings. The set of hyper-rings for each metric region is related to a fixed set of pivot objects. As a consequence, the shape of a metric region bounds the indexed objects more tightly which, in turn, significantly improves the overall efficiency of similarity search. We present basic algorithms on PM-tree and two cost models for range query processing. Finally, the PM-tree efficiency is experimentally evaluated on large synthetic as well as real-world datasets. Keywords: PM-tree, M-tree, pivot-based methods, efficient similarity search 1 Introduction The volume of various multimedia collections worldwide rapidly increases and the need for an efficient content-based similarity search in large multimedia databases becomes stronger. Since a multimedia document is modelled by an object (usually a vector) in a feature space U, the whole collection of documents (the multimedia database) can be represented as a dataset S ⊂ U. A similarity function is often modelled using a metric, i.e. a distance function d satisfying reflexivity, positivity, symmetry, and triangular inequality. Given a metric space M = (U, d), the metric access methods (MAMs) [4] organize (or index) objects in dataset S just using the metric d. The MAMs try to recognize a metric structure hidden in S and exploit it for an efficient search. Common to all MAMs is that during search process the triangular inequality of d allows to discard some irrelevant subparts of the metric structure. 2 M-tree Among many of metric access methods developed so far, the M-tree [5, 8] (and its modifications Slim-tree [11], M+ -tree [14]) is still the only indexing technique suitable for an efficient similarity search in large multimedia databases.
  • 2. The M-tree is based on a hierarchical organization of data objects Oi ∈ S according to a given metric d. Like other dynamic and paged trees, the M-tree structure consists of a balanced hierarchy of nodes. The nodes have a fixed capac- ity and a utilization threshold. Within M-tree hierarchy the objects are clustered into metric regions. The leaf nodes contain ground entries of the indexed data objects while routing entries (stored in the inner nodes) describe the metric regions. A ground entry looks like: grnd(Oi ) = [Oi , oid(Oi ), d(Oi , Par(Oi ))] where Oi ∈ S is an indexed data object, oid(Oi ) is an identifier of the original DB object (stored externally), and d(Oi , Par(Oi )) is a precomputed distance between Oi and the data object of its parent routing entry. A routing entry looks like: rout(Oi ) = [Oi , ptr(T (Oi )), rOi , d(Oi , Par(Oi ))] where Oi ∈ S is a data object, ptr(T (Oi )) is pointer to the covering subtree, and rOi is the covering radius. The routing entry determines a hyper-spherical metric region in M where the object Oi is a center of that region and rOi is a radius bounding the region. The precomputed value d(Oi , Par(Oi )) is used for optimizing most of the M-tree algorithms. In Figure 1 a metric region and Fig. 1. A routing entry and its metric region in the M-tree structure its appropriate routing entry rout(Oi ) in an inner node are presented. For a hierarchy of metric regions (routing entries rout(Oi ) respectively) the following condition must be satisfied: All data objects stored in leaves of covering subtree T (Oi ) of rout(Oi ) must be spatially located inside the region defined by rout(Oi ). Formally, having a rout(Oi ) then ∀Oj ∈ T (Oi ), d(Oi , Oj ) ≤ rOi . If we realize, such a condition is very weak since there can be constructed many M-trees of the same object content but of different hierarchy. The most important consequence is that many regions on the same M-tree level may overlap. An example in Figure 2 shows several data objects partitioned among (possibly overlapping) metric regions and the appropriate M-tree.
  • 3. Fig. 2. Hierarchy of metric regions and the appropriate M-tree 2.1 Similarity Queries The structure of M-tree was designed to natively support similarity queries (proximity queries actually). Given a query object Q, a similarity/proximity query returns objects Oi ∈ S close to Q. In the context of similarity search we distinguish two main types of queries. A range query rq(Q, rQ , S) is specified as a hyper-spherical query region defined by a query object Q and a query radius rQ . The purpose of a range query is to return all the objects Oi ∈ S satisfying d(Q, Oi ) ≤ rQ . A k-nearest neighbours query (k-NN query) knn(Q, k, S) is specified by a query object Q and a number k. A k-NN query returns the first k nearest objects to Q. Technically, a k-NN query can be implemented using a range query with dynamic query radius [8]. During a similarity query processing the M-tree hierarchy is being traversed down. Only if a routing entry rout(Oi ) (its metric region respectively) overlaps the query region, the covering subtree T (Oi ) of rout(Oi ) is relevant to the query and thus further processed. 2.2 Retrieval Efficiency The retrieval efficiency of an M-tree (i.e. the performance of a query evalua- tion) is highly dependent on the overall volume3 of the metric regions described by routing entries. The larger metric region volumes the higher probability of overlap with a query region. Recently, we have introduced two algorithms [10] leading to reduction of the overall volume of metric regions. The first method, the multi-way dynamic in- sertion, finds the most suitable leaf for each object to be inserted. The second post-processing method, the generalized slim-down algorithm, tries to ”horizon- tally” (i.e. separately for each M-tree level) redistribute all entries among more suitable nodes. 3 We consider only an imaginary volume since there exists no universal notion of volume in general metric spaces. However, without loss of generality, we can say that a hyper-sphere volume grows if its covering radius increases.
  • 4. 3 Pivoting M-tree Each metric region of M-tree is described by a bounding hyper-sphere (defined by a center object and a covering radius). However, the shape of hyper-spherical region is far from optimal since it does not bound the data objects tightly to- gether thus the region volume is too large. In other words, relatively to the hyper-sphere volume, there is only ”few” objects spread inside the hyper-sphere and a huge proportion of an empty space4 is covered. Consequently, for hyper- spherical regions of large volumes the query processing becomes less efficient. In this section we introduce an extension of M-tree, called Pivoting M-tree (PM-tree), exploiting pivot-based ideas for metric region volume reduction. 3.1 Pivot-based Methods Similarity search realized by pivot-based methods (e.g. AESA, LAESA) [4, 7] follows a single general idea. A set of p objects {P1 , ..., Pt , ..., Pp } ⊂ S is selected, called pivots (or vantage points). The dataset S (of size n) is preprocessed so as to build a table of n · p entries, where all the distances d(Oi , Pt ) are stored for every Oi ∈ S and every pivot Pt . When a range query rq(Q, rQ , S) is processing, we compute d(Q, Pt ) for every pivot Pt and then try to discard such Oi that |d(Oi , Pt ) − d(Q, Pt )| > rQ . The objects Oi which cannot be eliminated by this rule have to be directly compared against Q. The simple sequential pivot-based approach is suitable especially for appli- cations where the distance d is considered expensive to compute. However, it is obvious that the whole table of n · p entries must be sequentially loaded during a query processing which significantly increases the disk access costs. Moreover, each non-discarded object (i.e. an object required to be directly compared) must be processed which means further disk access as well as computation costs. There were developed also hierarchical pivot-based structures, e.g. the vp-tree [13] (vantage point tree) or the mvp-tree [2] (multi vp-tree). Unfortunately, these structures are not suitable for similarity search in large multimedia databases since they are static (i.e. they are built in top-down manner while the whole dataset must be available at construction time) and they are not paged (i.e. a secondary memory management is rather complicated for them). 3.2 Structure of PM-tree Since PM-tree is an extension of M-tree we just describe the new facts instead of a comprehensive definition. To exploit advantages of both, the M-tree and the pivot-based approach, we have enhanced the routing and ground entries by a pivot-based information. First of all, a set of p pivots Pt ∈ S must be selected. This set is fixed for all the lifetime of a particular PM-tree index. Furthermore, a routing entry in a 4 The uselessly indexed empty space is sometimes referred as the ”dead space” [1].
  • 5. PM-tree inner node is defined as: routP M (Oi ) = [Oi , ptr(T (Oi )), rOi , d(Oi , Par(Oi )), HR] The HR attribute is an array of phr hyper-rings (phr ≤ p) where the t-th hyper- ring HR[t] is the smallest interval covering distances between the pivot Pt and each of the objects stored in leaves of T (Oi ), i.e. HR[t] = HR[t].min, HR[t].max where HR[t].min = min({d(Oj , Pt )}) and HR[t].max = max({d(Oj , Pt )}), for ∀Oj ∈ T (Oi ). Similarly, for a PM-tree leaf we define a ground entry as: grndP M (Oi ) = [Oi , oid(Oi ), d(Oi , Par(Oi )), PD] The PD attribute stands for an array of ppd pivot distances (ppd ≤ p) where the t-th distance PD[t] = d(Oi , Pt ). Since each hyper-ring region (Pt , HR[t]) defines a metric region containing all the objects stored in T (Oi ), an intersection of all the hyper-rings and the hyper-sphere forms a metric region bounding all the objects in T (Oi ) as well. Due to the intersection with hyper-sphere the PM-tree metric region is always smaller than the original M-tree region defined just by a hyper-sphere. For a comparison of an M-tree region and an equivalent PM-tree region see Figure 3. The numbers phr and ppd (both fixed for a PM-tree index lifetime) allow us to specify the ”amount of pivoting”. Obviously, using a suitable phr > 0 and ppd > 0 the PM-tree can be tuned to achieve an optimal performance (see Section 5). Fig. 3. (a) Region of M-tree (b) Reduced region of PM-tree (using three pivots) 3.3 Building the PM-tree In order to keep HR and PD arrays up-to-date, the original M-tree construction algorithms [8, 10] must be adjusted. We have to mention the adjusted algorithms still preserve the logarithmic time complexity.
  • 6. Object Insertion. After a data object Oi is inserted into a leaf the HR arrays of all routing entries in the insertion path must be updated by values d(Oi , Pt ), ∀t ≤ phr . For the leaf node in insertion path the PD array of the new ground entry must be updated by values d(Oi , Pt ), ∀t ≤ ppd . Node Splitting. After a node is split a new HR array of the left new routing entry is created by merging all appropriate intervals HR[t] (or computing HR in case of a leaf split) stored in routing entries (ground entries respectively) of the left new node. A new HR array of the right new routing entry is created similarly. 3.4 Query Processing Before processing a similarity query the distances d(Q, Pt ), ∀t ≤ max(phr , ppd ) have to be computed. During a query processing the PM-tree hierarchy is being traversed down. Only if the metric region of a routing entry rout(Oi ) is over- lapping the query region (Q, rQ ), the covering subtree T (Oi ) is relevant to the query and thus further processed. A routing entry is relevant to the query in case that the query region overlaps all the hyper-rings stored in HR. Hence, prior to the standard hyper-sphere overlap check (used by M-tree), the overlap of hyper-rings HR[t] against the query region is checked as follows (note that no additional distance computation is needed): phr d(Q, Pt ) − rQ ≤ HR[t].max ∧ d(Q, Pt ) + rQ ≥ HR[t].min t=1 If the above condition is false, the subtree T (Oi ) is not relevant to the query and thus can be discarded from further processing. On the leaf level an irrelevant ground entry is determined such that the following condition is not satisfied: ppd |d(Q, Pt ) − PD[t]| ≤ rQ t=1 In Figure 3 a range query situation is illustrated. Although the M-tree metric region cannot be discarded (see Figure 3a), the PM-tree region can be safely ignored since the hyper-ring HR[2] is not overlapped (see Figure 3b). The hyper-ring overlap condition can be integrated into the original M-tree range query as well as k-NN query algorithms. In case of range query the ad- justment is straightforward – the hyper-ring overlap condition is combined with the original hyper-sphere overlap condition. However, the optimal M-tree k-NN query algorithm (based on priority queue heuristics) must be redesigned which is a subject of our future research. 3.5 Object-to-pivot Distance Representation In order to minimize storage volume of HR and PD arrays in PM-tree nodes, a short representation of object-to-pivot distance is required. We can represent
  • 7. interval HR[t] by two 4-byte reals and a pivot distance PD[t] by one 4-byte real. However, when (a part of) the dataset is known in advance we can approximate the 4-byte representation by a 1-byte code. For this reason a distance distribu- tion histogram for each pivot is created by random sampling of objects from the dataset and comparing them against the pivot. Then a distance interval dmin , dmax is computed so that most of the histogram distances fall into the interval, see an example in Figure 4 (the d+ value is an (estimated) maximum distance of a bounded metric space M). Fig. 4. Distance distribution histogram, 90% distances in interval dmin , dmax Distance values in HR and PD are scaled into interval dmin , dmax as 1-byte codes. Using 1-byte codes the storage savings are considerable. As an example, for phr = 50 together with using 4-byte distances, the hyper-rings stored in an inner node having capacity 30 entries will consume 30 · 50 · 2 · 4 = 12000 bytes while by using 1-byte codes the hyper-rings will take 30 · 50 · 2 · 1 = 3000 bytes. 3.6 Selecting the Pivots The methods of selecting an optimal set of pivots have been intensively studied [9, 3] while, in general, we can say that a set of pivots is optimal such that dis- tances among pivots are maximal (close pivots give almost the same information) and the pivots are located outside the data clusters. In the context of PM-tree the optimal set of pivots causes that the M-tree hyper-spherical region is effectively ”chopped off” by hyper-rings so that the smallest overall volume of PM-tree regions (considering the volume of intersec- tion of hyper-rings and the hyper-sphere) is obtained. In experiments presented in Section 5 we have used a cheap but effective method which samples N groups of p pivots from the dataset S at random. The group is selected for which the sum of distances among pivots is maximal.
  • 8. 4 Range Query Cost Models In this section we present a node-based and a level-based cost models for range query processing in PM-tree, allowing to predict the PM-tree retrieval perfor- mance. Since PM-tree is an extension of M-tree, we have extended the original cost models developed for M-tree [6]. Like the M-tree cost models, the PM-tree cost models are conditioned by the following assumptions: – The only information used is (an estimate of) the distance distribution of ob- jects in a given dataset since no information about data distribution is known. – A biased query model is considered, i.e. the distribution of query objects is equal to that of data objects. – The dataset is supposed to have high ”homogeneity of viewpoints” (for de- tails we refer to [6, 8]). The basic tool used in the cost models is a probability estimation that two hyper-spheres overlap, i.e. (using triangular inequality of d) Pr{spheres (O1 , rO1 ) and (O2 , rO2 ) overlapped} = Pr{d(O1 , O2 ) ≤ rO1 + rO2 } where O1 , O2 are center objects and rO1 , rO2 are radii of the hyper-spheres. For this purpose the overall distance distribution function is used, defined as: F (x) = Pr{d(Oi , Oj ) ≤ x}, ∀Oi , Oj ∈ U and also the relative distance distribution function is used, defined as: FOk (x) = Pr{d(Ok , Oi ) ≤ x}, Ok ∈ U, ∀Oi ∈ U For an approximate F(Ok ) evaluation a set O of s objects Oi ∈ S is sampled. The F is computed using the s × s matrix of pairwise distances between objects in O. For the FOk evaluation only the vector of s distances d(Oi , Ok ) is needed. 4.1 Node-based Cost Model In the node-based cost model (NB-CM) a probability of access to each PM-tree node is predicted. Basically, a node N is accessed if its metric region (described by the parent routing entry of N) is overlapping the query hyper-sphere (Q, rQ ): Pr{node N is accessed} = Pr{metric region of N is overlapped by (Q, rQ )} Specifically, a PM-tree node N is accessed if its metric region (defined by a hyper-sphere and phr hyper-rings) overlaps the query hyper-sphere: phr Pr{N is accessed} = Pr{hyper-sphere is inter.}· Pr{t-th hyper-ring is inter.} t=1
  • 9. and finally (for query radius rQ and the parent routing entry of N ) phr Pr{N accessed} ≈ F (rN +rQ )· FPt (HRN [t].max+rQ )·(1−FPt (rQ −HRN [t].min)) t=1 To determine the estimated disk access costs (DAC) for a range query, it is sufficient to sum the above probabilities over all the m nodes in the PM-tree: phr m FPt (HRNi [t].max+rQ )·(1−FPt (rQ −HRNi [t].min)) DAC = F (rNi +rQ )· t=1 i=1 The computation costs (CC) are estimated considering the probability that a node is accessed multiplied by the number of its entries, e(Ni ), thus obtaining phr m FPt (HRNi [t].max+rQ )·(1−FPt (rQ −HRNi [t].min)) CC = e(Ni )·F (rNi +rQ )· t=1 i=1 4.2 Level-based Cost Model The problem with NB-CM is that maintaining statistics for every node is very time consuming when the PM-tree index is large. To overcome this, we consider a simplified level-based cost model (LB-CM) which uses only average information collected for each level of the PM-tree. For each level l of the tree (l = 1 for root level, l = L for leaf level), LB-CM uses this information: ml (the number of nodes at level l), rl (the average value of covering radius considering all the nodes at level l), HRl [i].min and HRl [i].max (the average information about hyper-rings considering all the nodes at level l). Given these statistics, the number of nodes accessed by a range query can be estimated as phr L DAC ≈ ml · F (rl + rQ ) · FPt (HRl [t].max + rQ ) · (1 − FPt (rQ − HRl [t].min)) t=1 l=1 Similarly, we can estimate computation costs as phr L CC ≈ ml+1 ·F (rl +rQ )· FPt (HRl [t].max+rQ )·(1−FPt (rQ −HRl [t].min)) t=1 l=1 def where mL+1 = n is the number of indexed objects. 4.3 Experimental Evaluation In order to evaluate accuracy of the presented cost models we have made several experiments on a synthetic dataset. The dataset consisted of 10,000 10-dimensional tuples (embedded inside unitary hyper-cube) uniformly distributed among 100 √ + L2 -spherical clusters of diameter d (where d+ = 10). The labels ”PM-tree(x,y)” 10 in the graphs below are described in Section 5.
  • 10. Fig. 5. Number of pivots, query sel. 200 objs. (a) Disk access costs (b) Computation costs The first set of experiments investigated the accuracy of estimates according to the increasing number of pivots used by the PM-tree. The range query selectivity (the average number of objects in the query result) was set to 200. In Figure 5a the estimated DAC as well as the real DAC are presented. The relative error of NB-CM estimates is below 0.2. Surprisingly, the relative error of LB-CM estimates is smaller than for NB-CM, below 0.15. The estimates of computation costs, presented in Figure 5b, are even more accurate than for the DAC estimates, below 0.05 (for NB-CM) and 0.04 (for LB-CM). The second set of experiments was focused on the accuracy of estimates according to the increasing query selectivity. The relative error of NB-CM DAC estimates (see Figure 6a) is below 0.1. Again, the relative error of LB-CM estimates is very small, below 0.02. The error of computation costs (see Figure 6b) is below 0.07 (for NB-CM) and 0.05 (for LB-CM). 5 Experimental Results In order to evaluate the overall PM-tree performance we present some results of experiments made on large synthetic as well as real-world vector datasets. In most of the experiments the retrieval efficiency of range query processing was examined. The query objects were randomly selected from the respective dataset while each particular query test consisted of 1000 range queries of the same query selectivity. The results were averaged. Euclidean (L2 ) metric was used. The experiments were aimed to compare PM-tree with M-tree – a comparison with other MAMs was out of scope of this paper.
  • 11. Fig. 6. Query selectivity: (a) Disk access costs (b) Computation costs Abbreviations in Figures. Each label of form ”PM-tree(x,y)” stands for a PM-tree index where phr = x and ppd = y. A label ”<index> + SlimDown” denotes an index subsequently post-processed using the slim-down algorithm (for details about the slim-down algorithm we refer to [10]). 5.1 Synthetic Datasets For the first set of experiments a collection of 8 synthetic vector datasets of increasing dimensionality (from D = 4 to D = 60) was generated. Each dataset (embedded inside unitary hyper-cube) consisted of 100,000 D-dimensional tuples uniformly distributed within 1000 L2 -spherical uniformly distributed clusters. √ + The diameter of each cluster was d where d+ = D. These datasets were 10 indexed by PM-tree (for various phr and ppd ) as well as by M-tree. Some statistics about the created indices are described in Table 1 (for explanation see [10]). Table 1. PM-tree index statistics (synthetic datasets) Construction methods: SingleWay + MinMax (+ SlimDown) Dimensionalities: 4,8,16,20,30,40,50,60 Inner node capacities: 10 – 28 Index file sizes: 4.5 MB – 55 MB Leaf node capacities: 16 – 36 Pivot file sizes5 : 2 KB – 17 KB Avg. node utilization: 66% Node (disk page) sizes: 1 KB (D = 4, 8), 2 KB (D = 16, 20), 4 KB (D ≥ 30) 5 Access costs to the pivot files, storing pivots Pt and the scaling intervals for all pivots (see Section 3.5), were not considered because of their negligible sizes.
  • 12. Fig. 7. Construction costs (30D indices): (a) Disk access costs (b) Computation costs Index construction costs (for 30-dimensional indices) according to the increasing number of pivots are presented in Figure 7. The disk access costs for PM-tree indices with up to 8 pivots are similar to those of M-tree index (see Figure 7a). For PM-tree(128, 0) and PM-tree(128, 28) indices the DAC are about 1.4 times higher than for the M-tree index. The increasing trend of computation costs (see Figure 7b) depends mainly on the p object-to-pivot distance computations made during each object insertion – additional computations are needed after leaf splitting in order to create HR arrays of the new routing entries. Fig. 8. Number of pivots (30-dim. indices, query selectivity 50 objs.): (a) DAC (b) CC
  • 13. In Figure 8 the range query costs (for 30-dimensional indices and query selec- tivity 50 objects) according to the number of pivots are presented. The DAC rapidly decrease with the increasing number of pivots. The PM-tree(128, 0) and PM-tree(128, 28) indices need only 27% of DAC spent by the M-tree index. Moreover, the PM-tree is superior even after the slim-down algorithm post- processing, e.g. the ”slimmed” PM-tree(128, 0) index needs only 23% of DAC spent by the ”slimmed” M-tree index (and only 6.7% of DAC spent by the or- dinary M-tree). The decreasing trend of computation costs is even more steep than for DAC, the PM-tree(128, 28) index needs only 5.5% of the M-tree CC. Fig. 9. Dimensionality (query selectivity 50 objects): (a) Disk access costs (b) Com- putation costs The influence of increasing dimensionality D is depicted in Figure 9. Since the disk page sizes for different indices vary, the DAC as well as the CC are related (in percent) to the DAC (CC resp.) of M-tree indices. For 8 ≤ D ≤ 40 the DAC stay approximately fixed, for D > 40 the DAC slightly increase. 5.2 Image Database For the second set of experiments a collection of about 10,000 web-crawled images [12] was used. Each image was converted into a 256-level gray scale and a fre- quency histogram was extracted. For indexing the histograms (256-dimensional vectors actually) were used together with the euclidean metric. The statistics about image indices are described in Table 2.
  • 14. Table 2. PM-tree index statistics (image database) Construction methods: SingleWay + MinMax (+ SlimDown) Dimensionality: 256 Inner node capacities: 10 – 31 Index file sizes: 16 MB – 20 MB Leaf node capacities: 29 – 31 Pivot file sizes: 4 KB – 1 MB Avg. node utilization: 67% Node (disk page) size: 32 KB In Figure 10a the DAC for increasing number of pivots are presented. We can see that e.g. the ”slimmed” PM-tree(1024,50) index consumes only 42% of DAC spent by the ”slimmed” M-tree index. The computation costs (see Figure 10b) for p ≤ 64 decrease (down to 36% of M-tree CC). However, for p > 64 the overall computation costs grow since the number of necessarily computed query-to-pivot distances (i.e. p distance computations for each query) is proportionally too large. Nevertheless, this fact is dependent on the database size – obviously, for 100,000 objects (images) the proportion of p query-to-pivot distance computations would be smaller when compared with the overall computation costs. Fig. 10. Number of pivots (query selectivity 50 objects): (a) DAC (b) CC Finally, the costs according to the increasing range query selectivity are pre- sented in Figure 11. The disk access costs stay below 73% of M-tree DAC (below 58% in case of ”slimmed” indices) while the computation costs stay below 43% (49% respectively).
  • 15. Fig. 11. Query selectivity: (a) Disk access costs (b) Computation costs 5.3 Summary The experiments on synthetic datasets and mainly on the real dataset have demonstrated the general benefits of PM-tree. The index construction (object insertion respectively) is dynamic and still preserves the logarithmic time com- plexity. For suitably high phr and ppd the index size growth is minor. This is true especially for high-dimensional datasets (e.g. the 256-dimensional image dataset) where the size of pivoting information stored in ground/routing entries is negligible when compared with the size of the data object (i.e. vector) it- self. A particular (but not serious) limitation of the PM-tree is that a part of the dataset must be known in advance (for the choice of pivots and when used object-to-pivot distance distribution histograms). Furthermore, the PM-tree could serve as a constructionally much cheaper alternative to the slim-down algorithm on M-tree – the above presented experi- mental results have shown that the retrieval performance of PM-tree (with suffi- ciently high phr , ppd ) is comparable or even better than an equivalent ”slimmed” M-tree. Finally, a combination of PM-tree and the slim-down algorithm makes the PM-tree a very efficient metric access method. 6 Conclusions and Outlook In this paper the Pivoting M-tree (PM-tree) was introduced. The PM-tree com- bines M-tree hierarchy of metric regions with the idea of pivot-based methods. The result is a flexible metric access method providing even more efficient simi- larity search than the M-tree. Two cost models for range query processing were proposed and evaluated. Experimental results on synthetic as well as real-world datasets have shown that PM-tree is more efficient when compared with the M-tree.
  • 16. In the future we plan to develop new PM-tree construction algorithms ex- ploiting the pivot-based information. Second, an optimal PM-tree k-NN query algorithm has to be designed and a cost model formulated. Finally, we would like to modify several spatial access methods by utilizing the pivoting information, in particular the R-tree family. ˇ This research has been partially supported by grant Nr. GACR 201/00/1031 of the Grant Agency of the Czech Republic. References 1. C. B¨hm, S. Berchtold, and D. Keim. Searching in High-Dimensional Spaces – o Index Structures for Improving the Performance of Multimedia Databases. ACM Computing Surveys, 33(3):322–373, 2001. ¨ 2. T. Bozkaya and M. Ozgsoyoglu. Distance-based indexing for high-dimensional metric spaces. In Proceedings of the 1997 ACM SIGMOD International Conference on Management of Data, Tuscon, AZ, pages 357–368, 1997. 3. B. Bustos, G. Navarro, and E. Ch´vez. Pivot selection techniques for proximity a searching in metric spaces. Pattern Recognition Letters, 24(14):2357–2366, 2003. 4. E. Ch´vez, G. Navarro, R. Baeza-Yates, and J. Marroqu´ Searching in Metric a ın. Spaces. ACM Computing Surveys, 33(3):273–321, 2001. 5. P. Ciaccia, M. Patella, and P. Zezula. M-tree: An Efficient Access Method for Similarity Search in Metric Spaces. In Proceedings of the 23rd Athens Intern. Conf. on VLDB, pages 426–435. Morgan Kaufmann, 1997. 6. P. Ciaccia, M. Patella, and P. Zezula. A cost model for similarity queries in metric spaces. In Proceedings of the Seventeenth ACM SIGACT-SIGMOD-SIGART Sym- posium on Principles of Database Systems, June 1-3, 1998, Seattle, Washington, pages 59–68. ACM Press, 1998. 7. L. Mico, J. Oncina, and E. Vidal. A new version of the nearest-neighbor approxi- mating and eliminating search (aesa) with linear preprocessing-time and memory requirements. Pattern Recognition Letters, 15:9–17, 1994. 8. M. Patella. Similarity Search in Multimedia Databases. PhD thesis, Dipartmento di Elettronica Informatica e Sistemistica, Bologna, 1999. 9. M. Shapiro. The choice of reference points in best-match file searching. Commu- nications of the ACM, 20(5):339–343, 1977. 10. T. Skopal, J. Pokorn´, M. Kr´tk´, and V. Sn´ˇel. Revisiting M-tree Building y ay as Principles. In ADBIS 2003, LNCS 2798, Springer-Verlag, Dresden, Germany, 2003. 11. C. Traina Jr., A. Traina, B. Seeger, and C. Faloutsos. Slim-Trees: High perfor- mance metric trees minimizing overlap between nodes. Lecture Notes in Computer Science, 1777, 2000. 12. WBIIS project: Wavelet-based Image Indexing and Searching, Stanford University, http://wang.ist.psu.edu/. 13. P. N. Yanilos. Data Structures and Algorithms for Nearest Neighbor Search in General Metric Spaces. In Proceedings of Fourth Annual ACM/SIGACT-SIAM Symposium on Discrete Algorithms - SODA, pages 311–321, 1993. 14. X. Zhou, G. Wang, J. Y. Xu, and G. Yu. M+-tree: A New Dynamical Multidi- mensional Index for Metric Spaces. In Proceedings of the Fourteenth Australasian Database Conference - ADC’03, Adelaide, Australia, 2003.