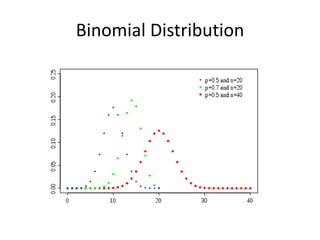
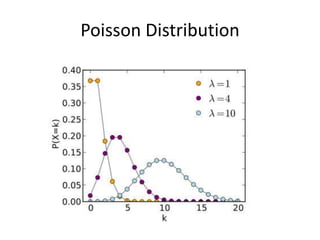
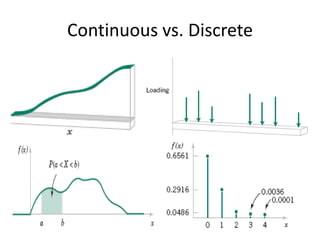
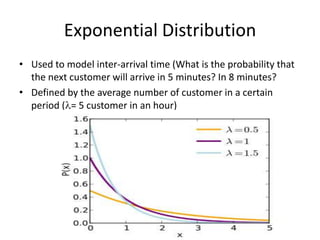
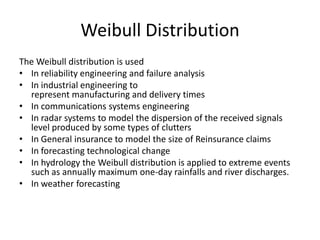
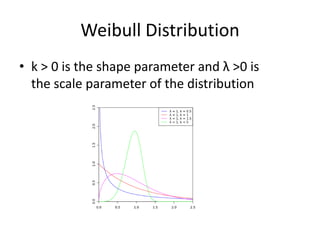
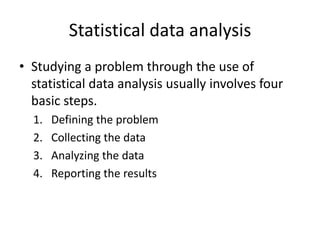
Basics of statisticsand Data collection and analysisWeeks 2,3, and 4
Variability Statistical techniques are useful for describing and   understanding variability.
Variability: Successive observations of a system or phenomenon do not produce exactly the same result.
 Statistics gives us a framework for describing this variability and for learning about potential sources of variability.Nylon connector to be used in an automotive engine application.
Design specification on wall thickness at 3/32 inch
The effect of this decision on the connector pull-off force. If the pull-off force is too low, the connector may fail when it is installed in an engine.
Eight prototype units are produced and their pull-off forces measured (in pounds): 12.6, 12.9, 13.4, 12.3, 13.6, 13.5, 12.6, 13.1.Random Experiment
This plot allows us to see easily two features of the data; the location, or the middle, and the scatter or variability.Random Experiment
DefinitionRandom Experiment
A closer examination of the system identifies deviations from the model.Random Experiment
Discrete Random VariablesThey are variables which have finite (countable) range.They can not be assigned other value.Examples:Let x be your grade S={A,A-,B+,B,B-,C,D}Let y be a working day in a week S={M,T,W,R,F}Let z be your weight S={40k<z<300K} this is not discrete, it is continuous, z can be 120.63k48 digital lines are observed, x indicate how many are in use, x can be any integer from 1 to 48….Note x can not be 1.5
Descriptive statisticsDefinition: Sample Mean
Definition: Sample VarianceDescriptive statistics
Descriptive statisticsHow Does the Sample Variance Measure Variability?How the sample variance measures variability through the deviations           .
Descriptive statisticsDefinition
Stem-and-Leaf Diagrams
Frequency Distributions and Histograms  A frequency distribution is a more compact summary of data than a stem-and-leaf diagram.
 To construct a frequency distribution, we must divide the range of the data into intervals, which are usually called class intervals, cells, or bins.Constructing a Histogram (Equal Bin Widths):
Frequency Distributions and Histograms Histogram of compressive strength for 80 aluminum-lithium alloy specimens.
Stem-and-Leaf Diagrams
Stem-and-Leaf Diagrams Data FeaturesWhen an ordered set of data is divided into four equal parts, the division points are called quartiles. The firstor lower quartile, q1, is a value that has approximately one-fourth (25%) of the observations below it and approximately 75% of the observations above. The second quartile, q2, has approximately one-half (50%) of the observations below its value. The second quartile is exactly equal to the median. The thirdor upper quartile, q3, has approximately three-fourths (75%) of the observations below its value. As in the case of the median, the quartiles may not be unique.
Stem-and-Leaf Diagrams Data FeaturesThe interquartile range is the difference between the upper and lower quartiles, and it is sometimes used as a measure of variability.
 In general, the 100kth percentile is a data value such that approximately 100k% of the observations are at or below this value and approximately 100(1 -  k)% of them are above it.Stem-and-Leaf Diagrams Stem-and-leaf diagram for the compressive strength data
2-2 Interpretations of ProbabilityRelative frequency of corrupted pulses sent over a communications channel.
2-2 Interpretations of Probability2-2.2 Axioms of Probability
DistributionProbability distribution of variable x is the description of the probability of each outcome of x.Examples:Tossing a coin, x is getting head, s={0,1} P(x=0)=0.5, P(x=1)=0.5In an experiment of examining 2 independent items from a product line, the probability that an item passes the test is 0.8, if x is the number of products passing the inspection. What is the distribution of x?
Mean and Variance of a Discrete Random VariableA probability distribution can be viewed as a loading with the mean equal to the balance point.  Parts (a) and (b) illustrate equal means, but Part (a) illustrates a larger variance.
Discrete Uniform DistributionDefinition
Binomial DistributionYou know the probability of the outcome of interest in a single try.
Flip a coin P(H)=1/2
Draw a card P(K)=4/52
In a production line P(defective)=0.10
You repeat the experiment (trial) n times WITH REPLACEMENT
Flip the coin 7 times
Draw 5 cards
(Take an item, test it, return it back) 25 times
You want to know the probability that you will get a certain outcome x times.
Probability of getting 3 heads in 7 times knowing that P(H)=0.5
Probability of getting 5 Kings in 5 drawn cards knowing that P(K)=4/52
Probability of getting 2 defectives in a sample of 25 items knowing that P(d)=0.1Binomial Distribution
Poisson DistributionThis distribution deals with the case that you only know THE AVERAGE NUMBER of the required outcomeExamplesFlaws in a rolls of textileCalls to a telephone exchange
Poisson Distribution
Continuous vs. Discrete
Continuous Uniform Distribution
Normal DistributionThe most widely used distributionAlso called Gaussian distributionCan be used to virtually approximate results of any experiment as we will see in later chapters.Characterized by mean and variance.Can you notice it represents weight, height, your strength?
Effect of mean and variance
Interesting Fact

Transportation and logistics modeling 2

  • 1.
    Basics of statisticsandData collection and analysisWeeks 2,3, and 4
  • 2.
    Variability Statistical techniquesare useful for describing and understanding variability.
  • 3.
    Variability: Successive observationsof a system or phenomenon do not produce exactly the same result.
  • 4.
    Statistics givesus a framework for describing this variability and for learning about potential sources of variability.Nylon connector to be used in an automotive engine application.
  • 5.
    Design specification onwall thickness at 3/32 inch
  • 6.
    The effect ofthis decision on the connector pull-off force. If the pull-off force is too low, the connector may fail when it is installed in an engine.
  • 7.
    Eight prototype unitsare produced and their pull-off forces measured (in pounds): 12.6, 12.9, 13.4, 12.3, 13.6, 13.5, 12.6, 13.1.Random Experiment
  • 8.
    This plot allowsus to see easily two features of the data; the location, or the middle, and the scatter or variability.Random Experiment
  • 9.
  • 10.
    A closer examinationof the system identifies deviations from the model.Random Experiment
  • 11.
    Discrete Random VariablesTheyare variables which have finite (countable) range.They can not be assigned other value.Examples:Let x be your grade S={A,A-,B+,B,B-,C,D}Let y be a working day in a week S={M,T,W,R,F}Let z be your weight S={40k<z<300K} this is not discrete, it is continuous, z can be 120.63k48 digital lines are observed, x indicate how many are in use, x can be any integer from 1 to 48….Note x can not be 1.5
  • 12.
  • 13.
  • 14.
    Descriptive statisticsHow Doesthe Sample Variance Measure Variability?How the sample variance measures variability through the deviations .
  • 15.
  • 16.
  • 17.
    Frequency Distributions andHistograms A frequency distribution is a more compact summary of data than a stem-and-leaf diagram.
  • 18.
    To constructa frequency distribution, we must divide the range of the data into intervals, which are usually called class intervals, cells, or bins.Constructing a Histogram (Equal Bin Widths):
  • 19.
    Frequency Distributions andHistograms Histogram of compressive strength for 80 aluminum-lithium alloy specimens.
  • 20.
  • 21.
    Stem-and-Leaf Diagrams DataFeaturesWhen an ordered set of data is divided into four equal parts, the division points are called quartiles. The firstor lower quartile, q1, is a value that has approximately one-fourth (25%) of the observations below it and approximately 75% of the observations above. The second quartile, q2, has approximately one-half (50%) of the observations below its value. The second quartile is exactly equal to the median. The thirdor upper quartile, q3, has approximately three-fourths (75%) of the observations below its value. As in the case of the median, the quartiles may not be unique.
  • 22.
    Stem-and-Leaf Diagrams DataFeaturesThe interquartile range is the difference between the upper and lower quartiles, and it is sometimes used as a measure of variability.
  • 23.
    In general,the 100kth percentile is a data value such that approximately 100k% of the observations are at or below this value and approximately 100(1 - k)% of them are above it.Stem-and-Leaf Diagrams Stem-and-leaf diagram for the compressive strength data
  • 24.
    2-2 Interpretations ofProbabilityRelative frequency of corrupted pulses sent over a communications channel.
  • 25.
    2-2 Interpretations ofProbability2-2.2 Axioms of Probability
  • 26.
    DistributionProbability distribution ofvariable x is the description of the probability of each outcome of x.Examples:Tossing a coin, x is getting head, s={0,1} P(x=0)=0.5, P(x=1)=0.5In an experiment of examining 2 independent items from a product line, the probability that an item passes the test is 0.8, if x is the number of products passing the inspection. What is the distribution of x?
  • 27.
    Mean and Varianceof a Discrete Random VariableA probability distribution can be viewed as a loading with the mean equal to the balance point. Parts (a) and (b) illustrate equal means, but Part (a) illustrates a larger variance.
  • 28.
  • 29.
    Binomial DistributionYou knowthe probability of the outcome of interest in a single try.
  • 30.
    Flip a coinP(H)=1/2
  • 31.
    Draw a cardP(K)=4/52
  • 32.
    In a productionline P(defective)=0.10
  • 33.
    You repeat theexperiment (trial) n times WITH REPLACEMENT
  • 34.
  • 35.
  • 36.
    (Take an item,test it, return it back) 25 times
  • 37.
    You want toknow the probability that you will get a certain outcome x times.
  • 38.
    Probability of getting3 heads in 7 times knowing that P(H)=0.5
  • 39.
    Probability of getting5 Kings in 5 drawn cards knowing that P(K)=4/52
  • 40.
    Probability of getting2 defectives in a sample of 25 items knowing that P(d)=0.1Binomial Distribution
  • 41.
    Poisson DistributionThis distributiondeals with the case that you only know THE AVERAGE NUMBER of the required outcomeExamplesFlaws in a rolls of textileCalls to a telephone exchange
  • 42.
  • 43.
  • 44.
  • 45.
    Normal DistributionThe mostwidely used distributionAlso called Gaussian distributionCan be used to virtually approximate results of any experiment as we will see in later chapters.Characterized by mean and variance.Can you notice it represents weight, height, your strength?
  • 46.
    Effect of meanand variance
  • 47.