Download to read offline


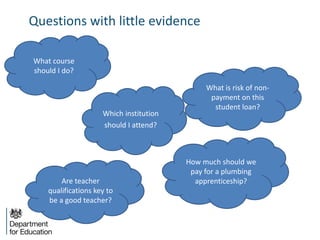
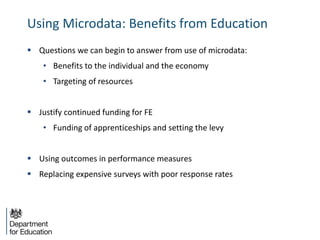
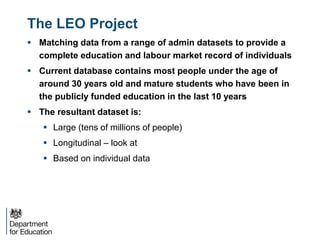

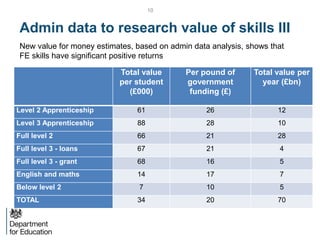

Transforming education through data provides 3 key points: 1. The DfE is working to address a lack of information in the education system by creating a large longitudinal dataset called LEO that matches data from education and labor market sources. 2. LEO allows the DfE to answer important questions about the benefits of education, target funding effectively, and hold institutions accountable based on outcomes. 3. Initial findings show education provides significant returns, with level 3 apprenticeships and qualifications yielding average returns of £67-88k per student and £34 of value for every £1 of government funding across all levels.


