Download to read offline

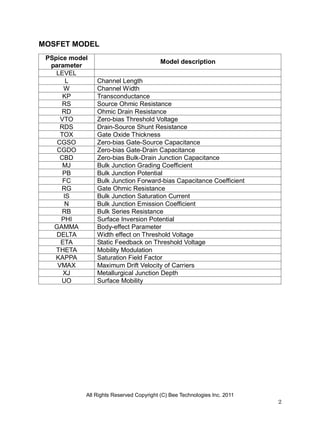
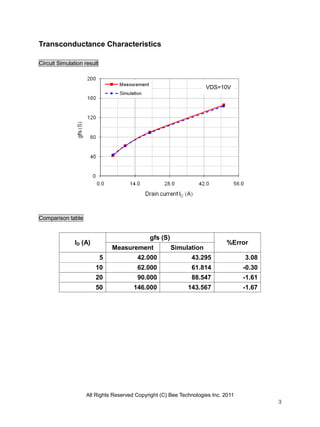
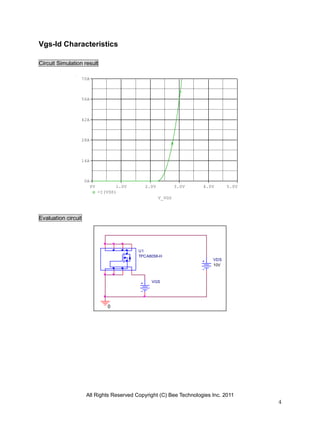
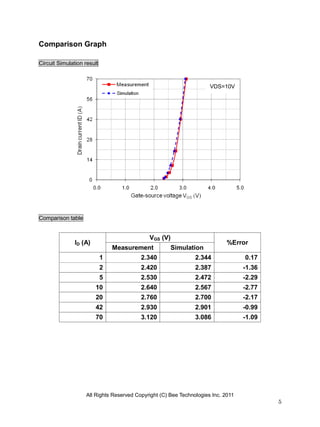
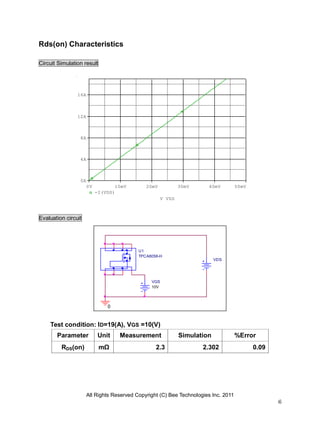
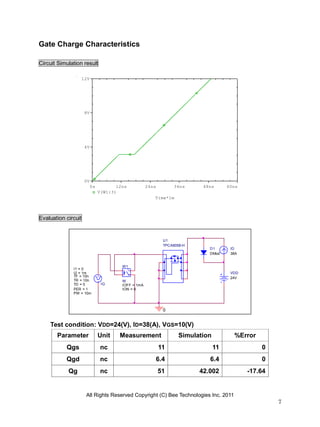
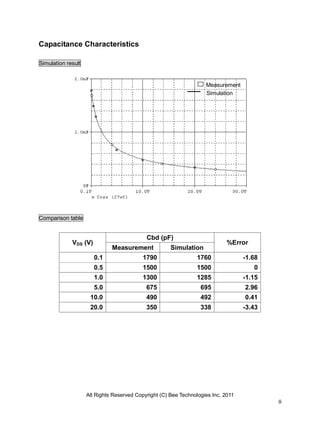
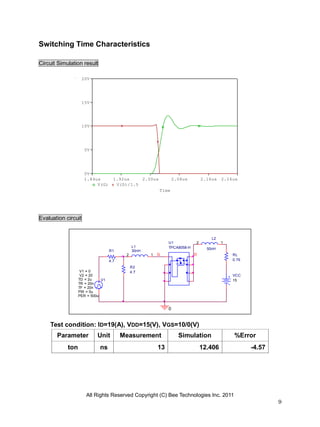
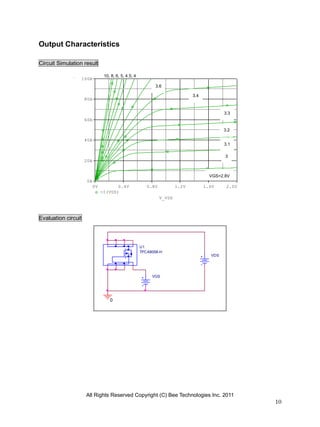
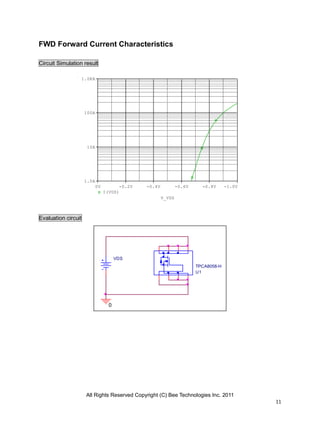
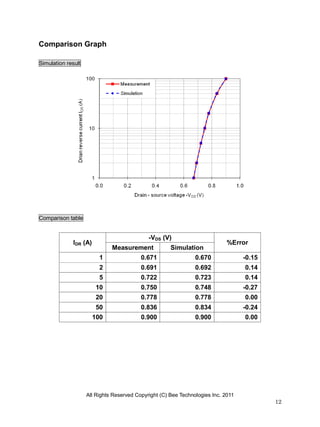
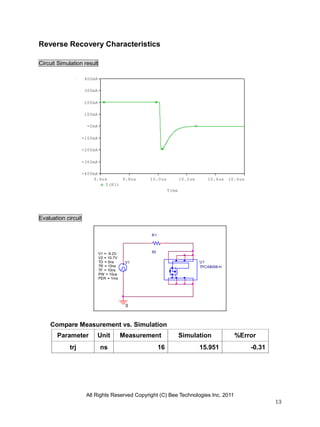
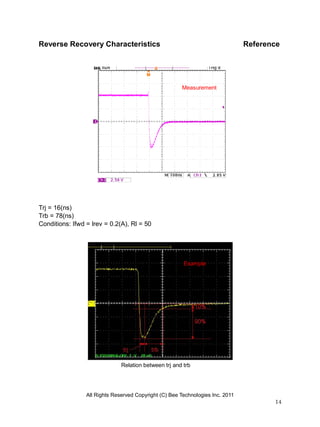

This document is a device modeling report for the TPCA8058-H MOSFET manufactured by Toshiba, detailing various model parameters and characteristics such as transconductance, gate charge, and capacitance. It compares simulation results with measurements, reporting discrepancies in a series of tables and graphs. Key evaluations include on-resistance, switching times, and forward current characteristics, all noting specific error percentages between simulated and measured values.


