The document discusses the challenges and methodologies in big data genome analysis, focusing on various aspects such as genome assembly, error correction, and the necessary cyberinfrastructure. It explores high throughput sequencing technologies, software and hardware challenges, and the evolution of big data processing frameworks like Hadoop and Graph Processing frameworks. Additionally, it presents performance evaluations of different algorithms and platforms for genomic data processing, highlighting the significance of distributed computing and error detection techniques.
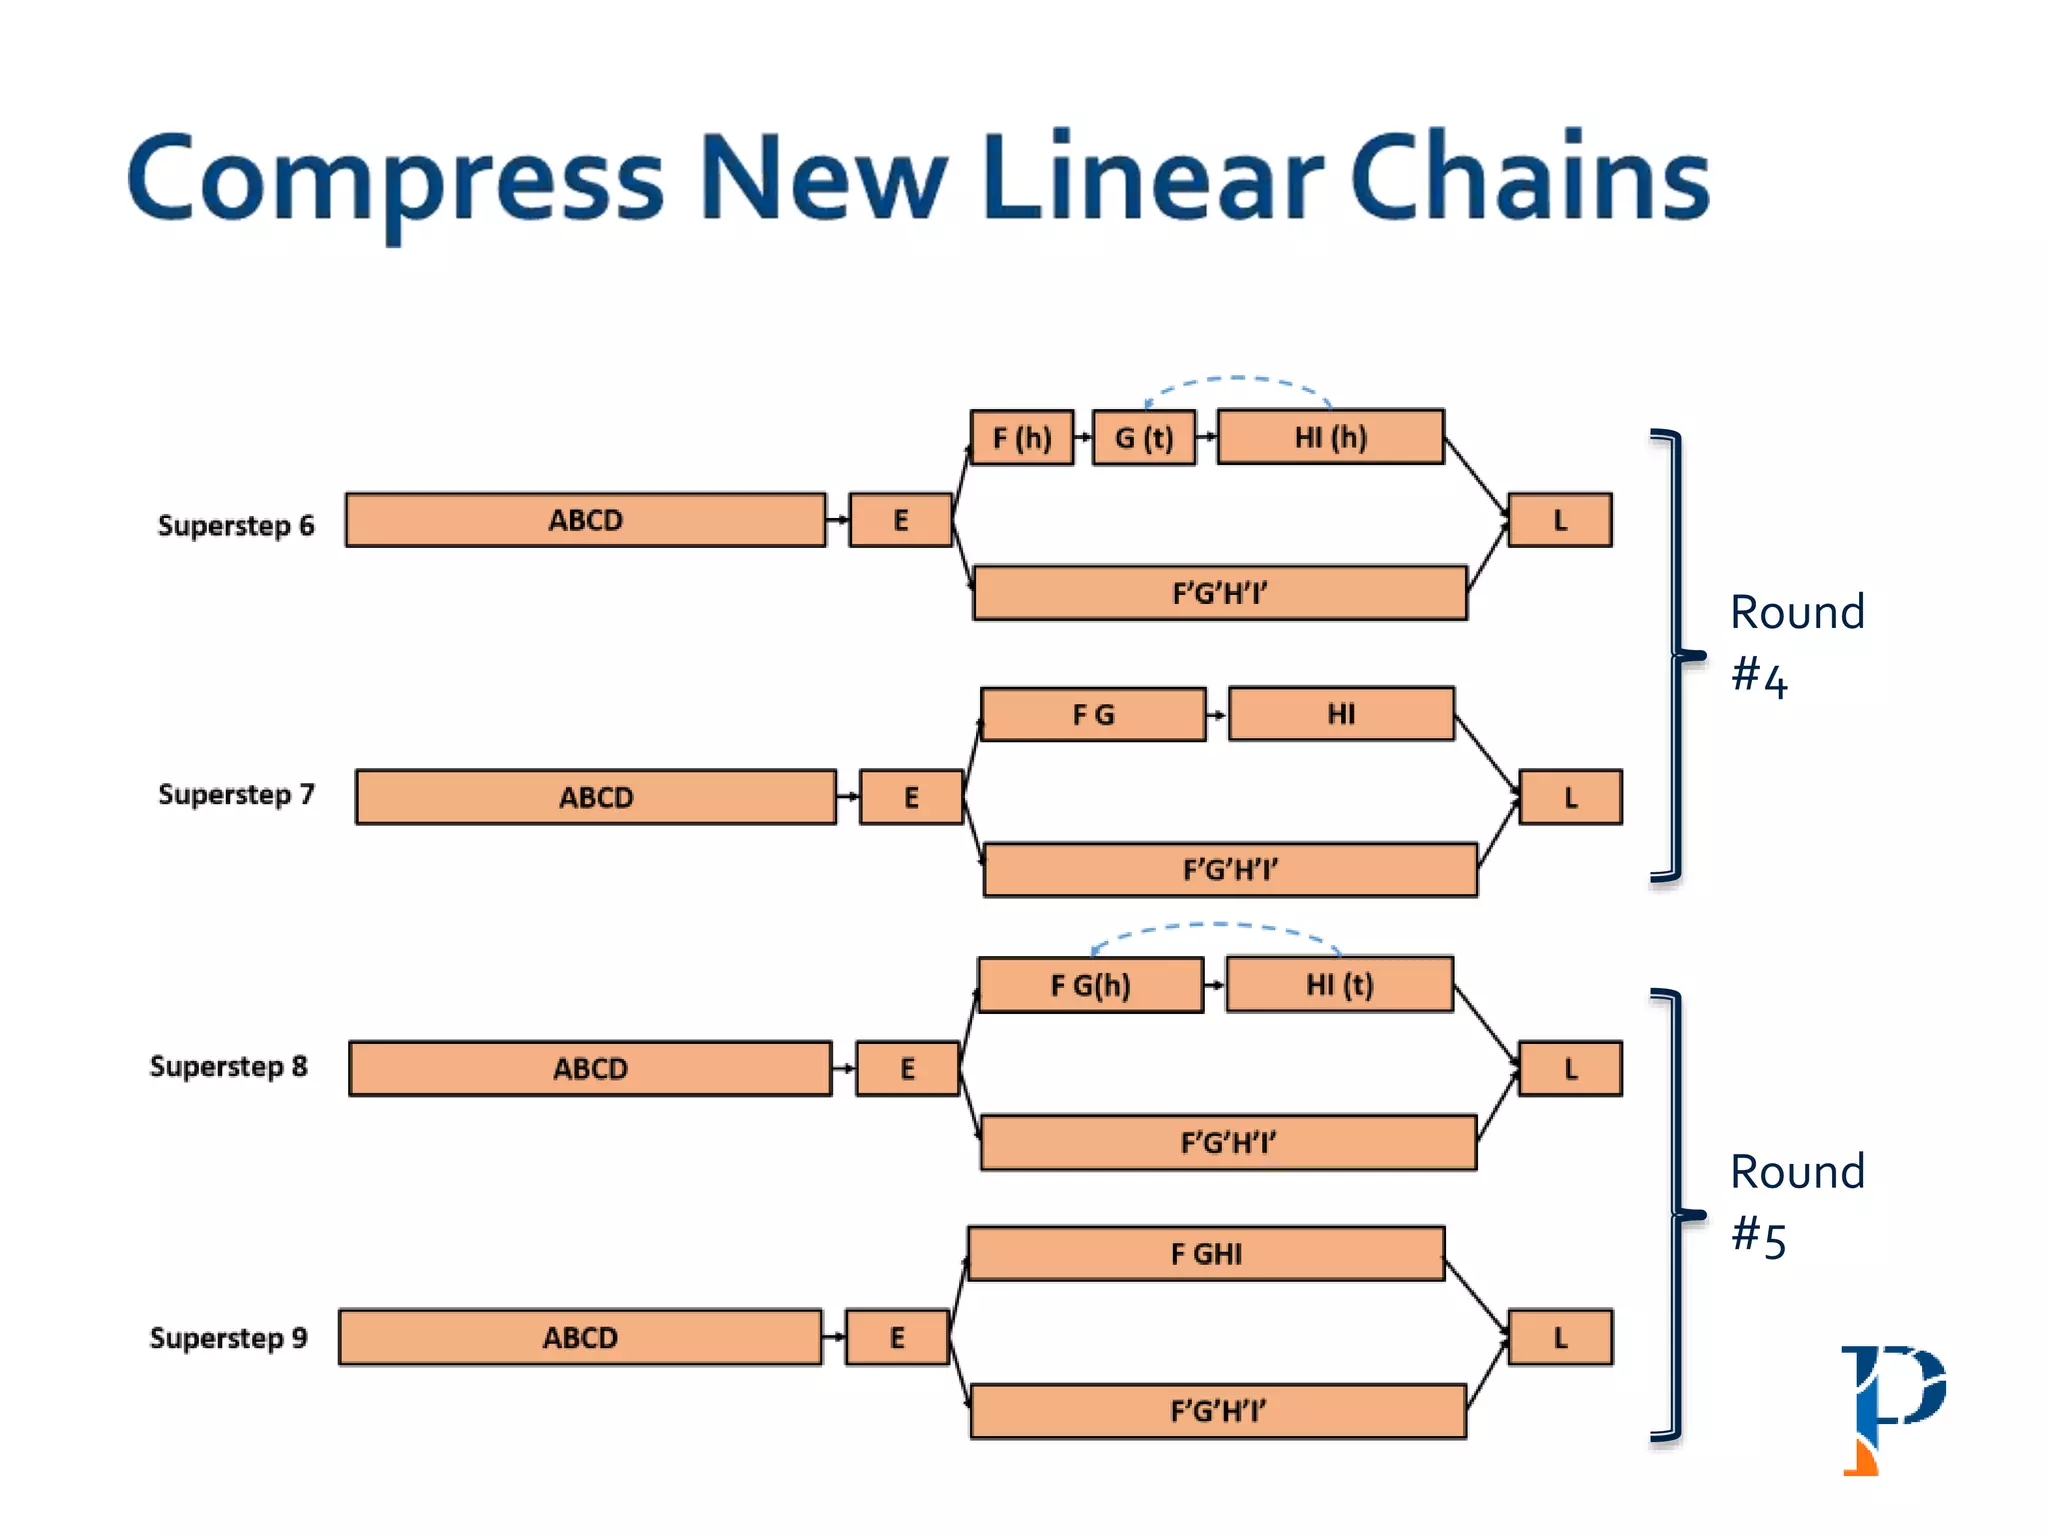
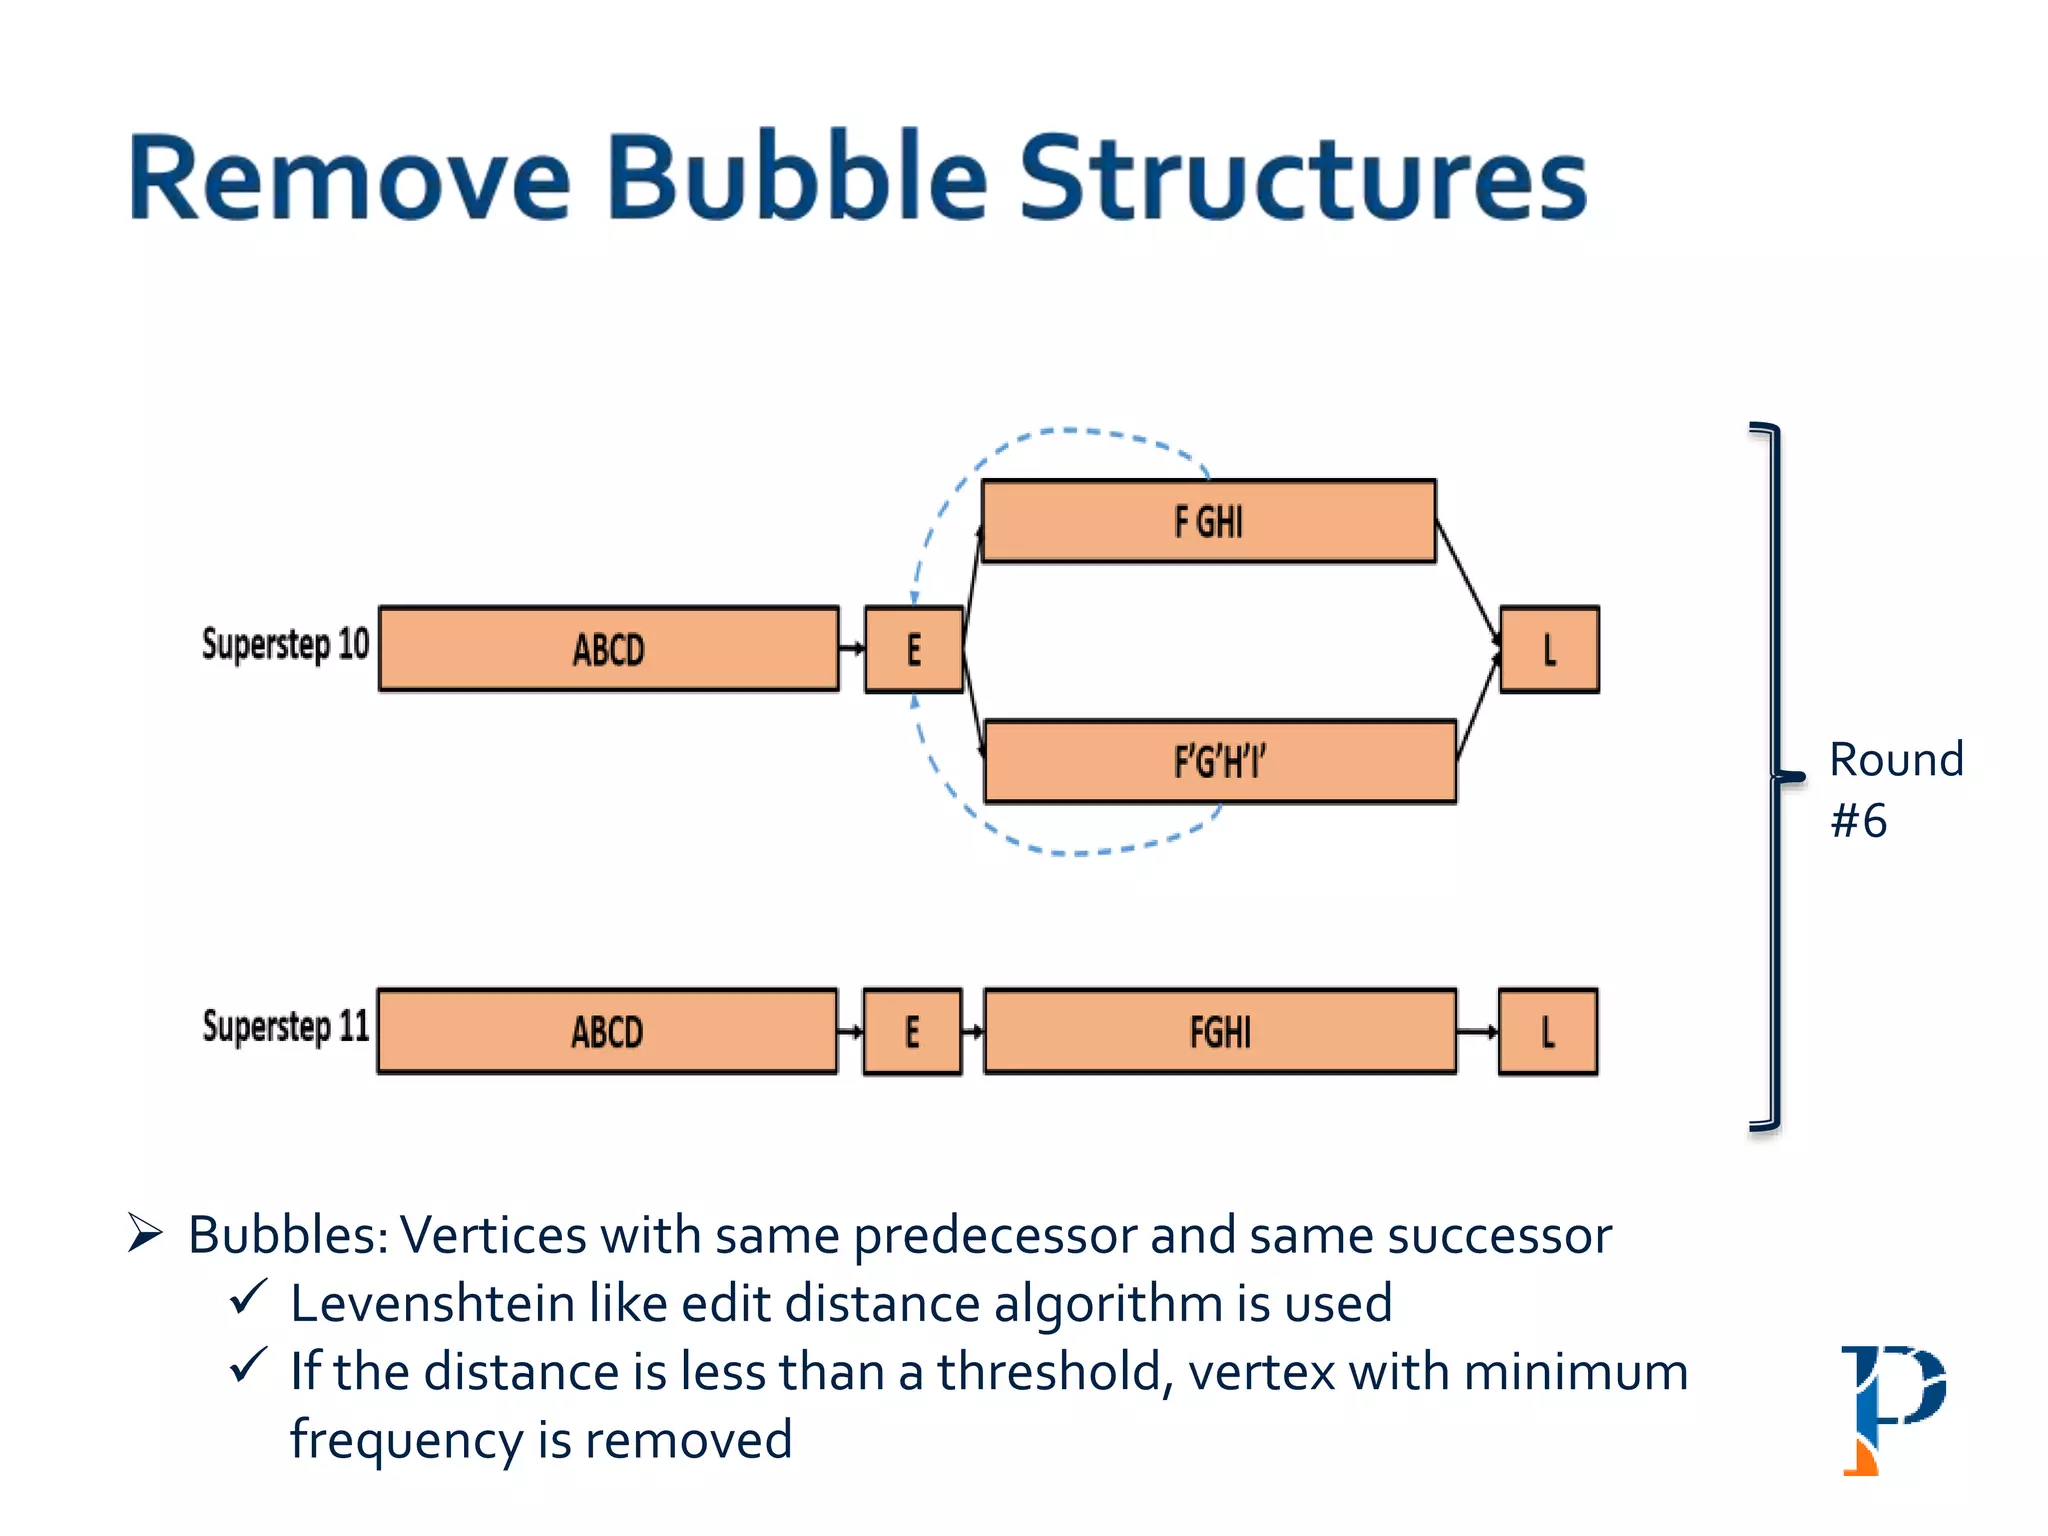
![ Modified version of parallel list ranking algorithm
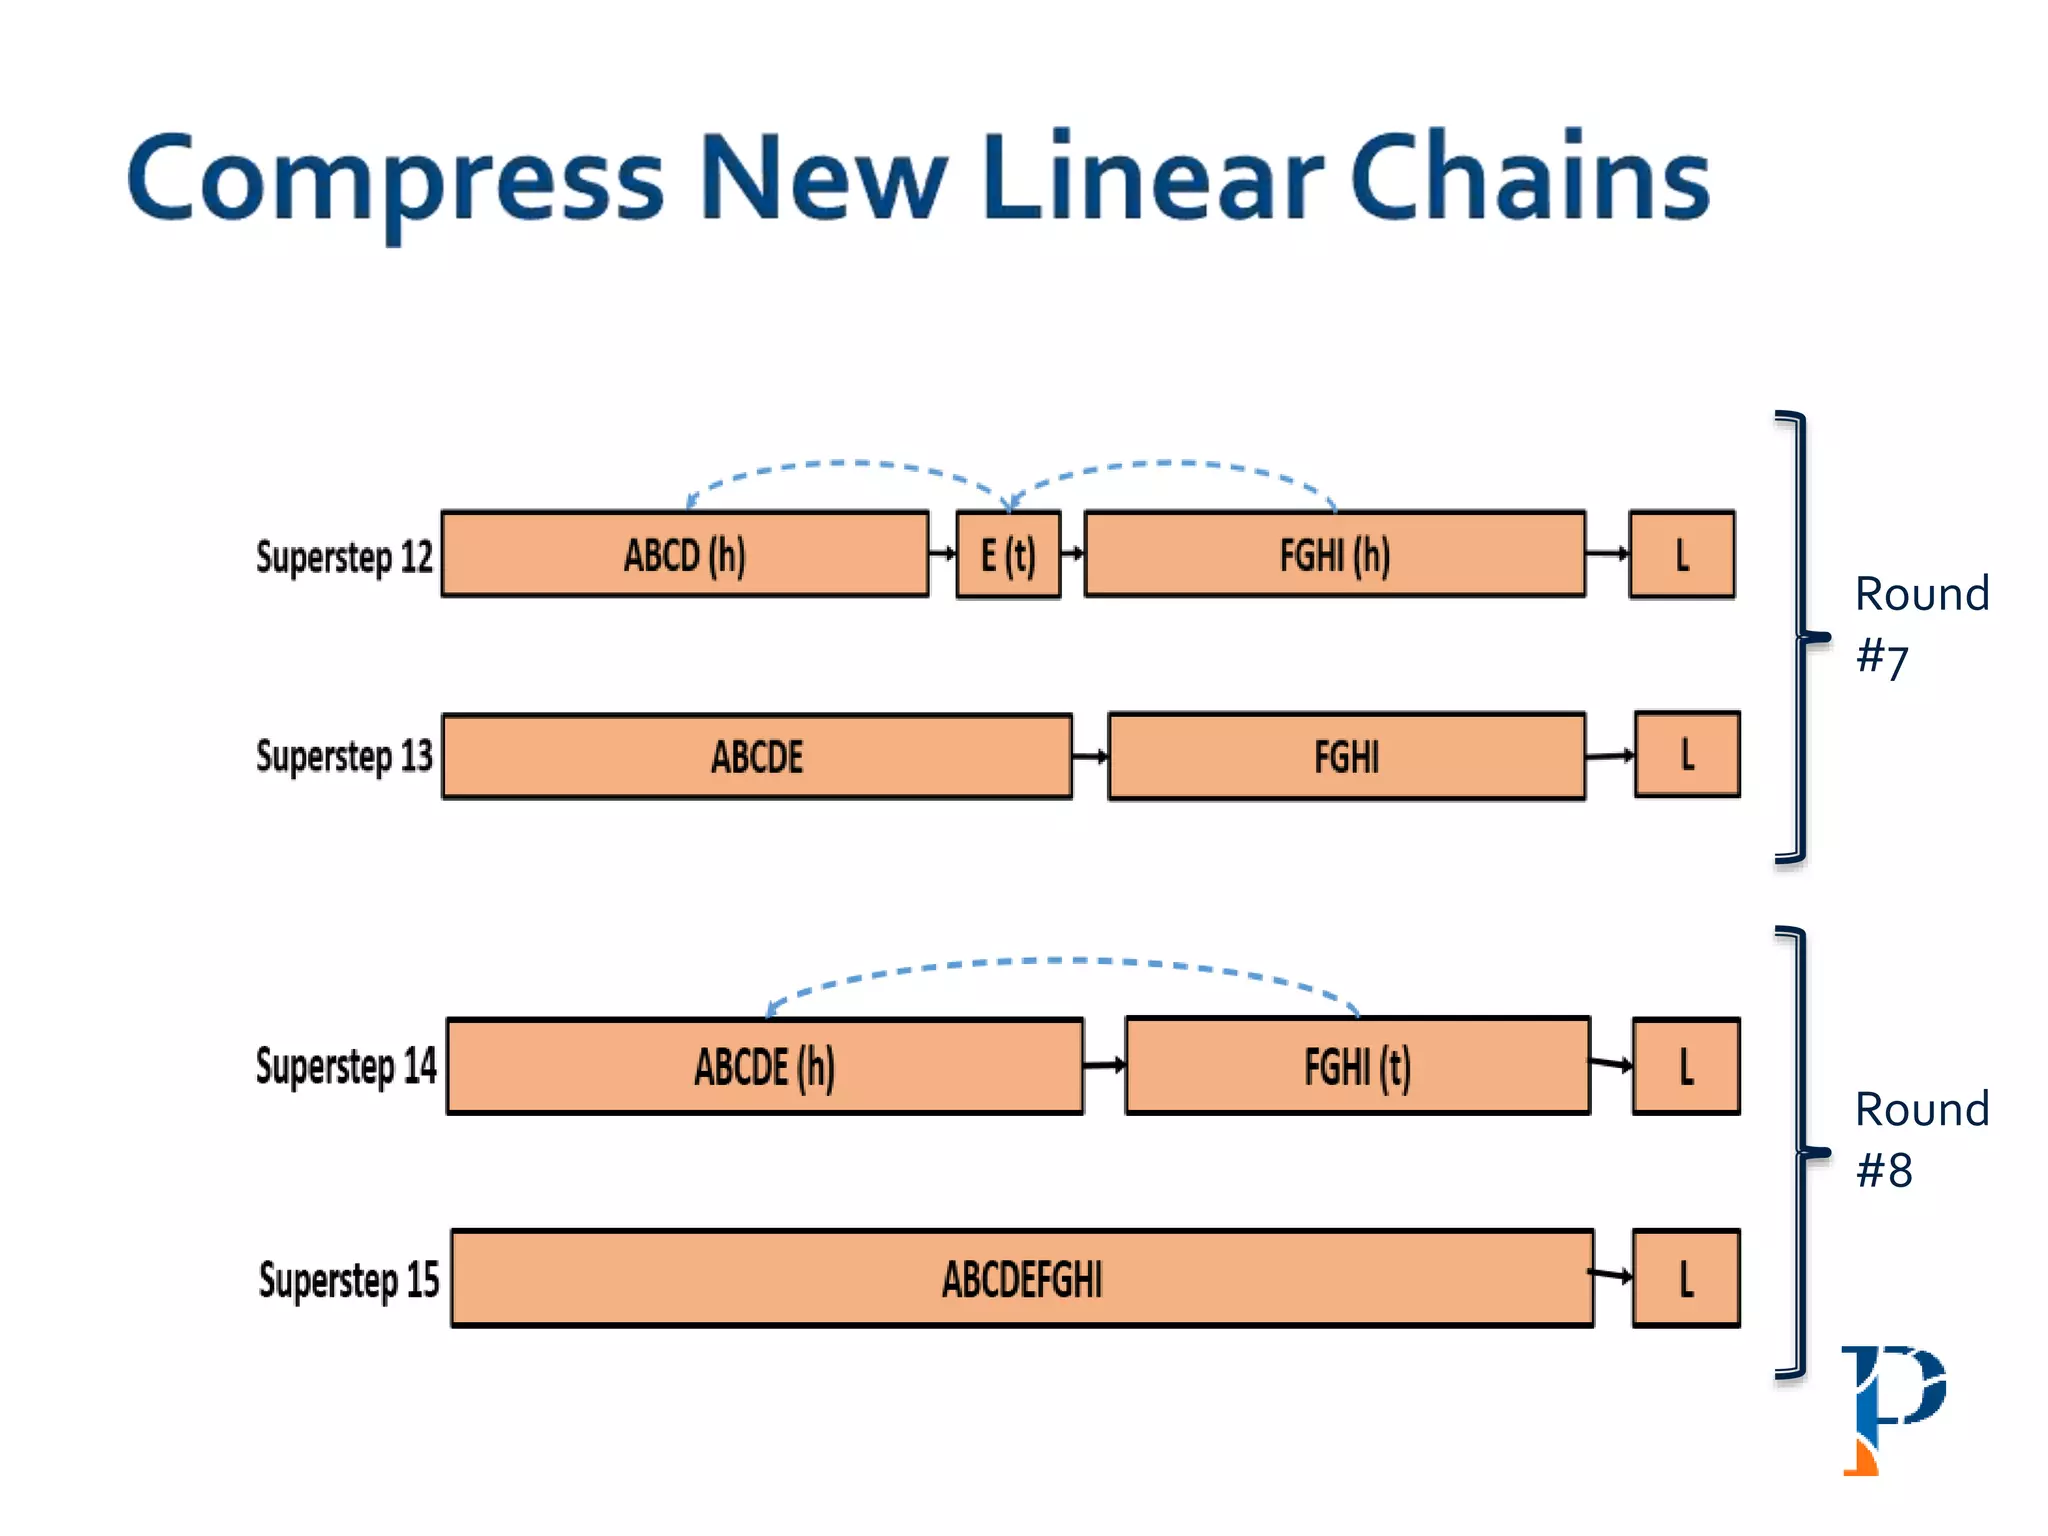
Mark head (h) and tail (t) and merge the h-t link
Number of rounds: O(log |n|) [where, n: #vertices in the longest path]
Round
#1
Round
#2](https://image.slidesharecdn.com/talkfinalppt-190828022516/75/Towards-Ultra-Large-Scale-System-Design-of-Scalable-Software-and-Next-Gen-HPC-Cluster-for-Big-Data-Genome-Analysis-14-2048.jpg)

![ “Evaluating Different Distributed-Cyber-Infrastructure for Data and Compute Intensive
ScientificApplication” Arghya Kusum Das, Jaeki Hong, Sayan Goswami, Richard Platania,
Wooseok Chang, Seung-Jong Park. IEEE Big Data 2015. [With collaboration of SAMSUNG
Electronics Ltd., S. Korea]
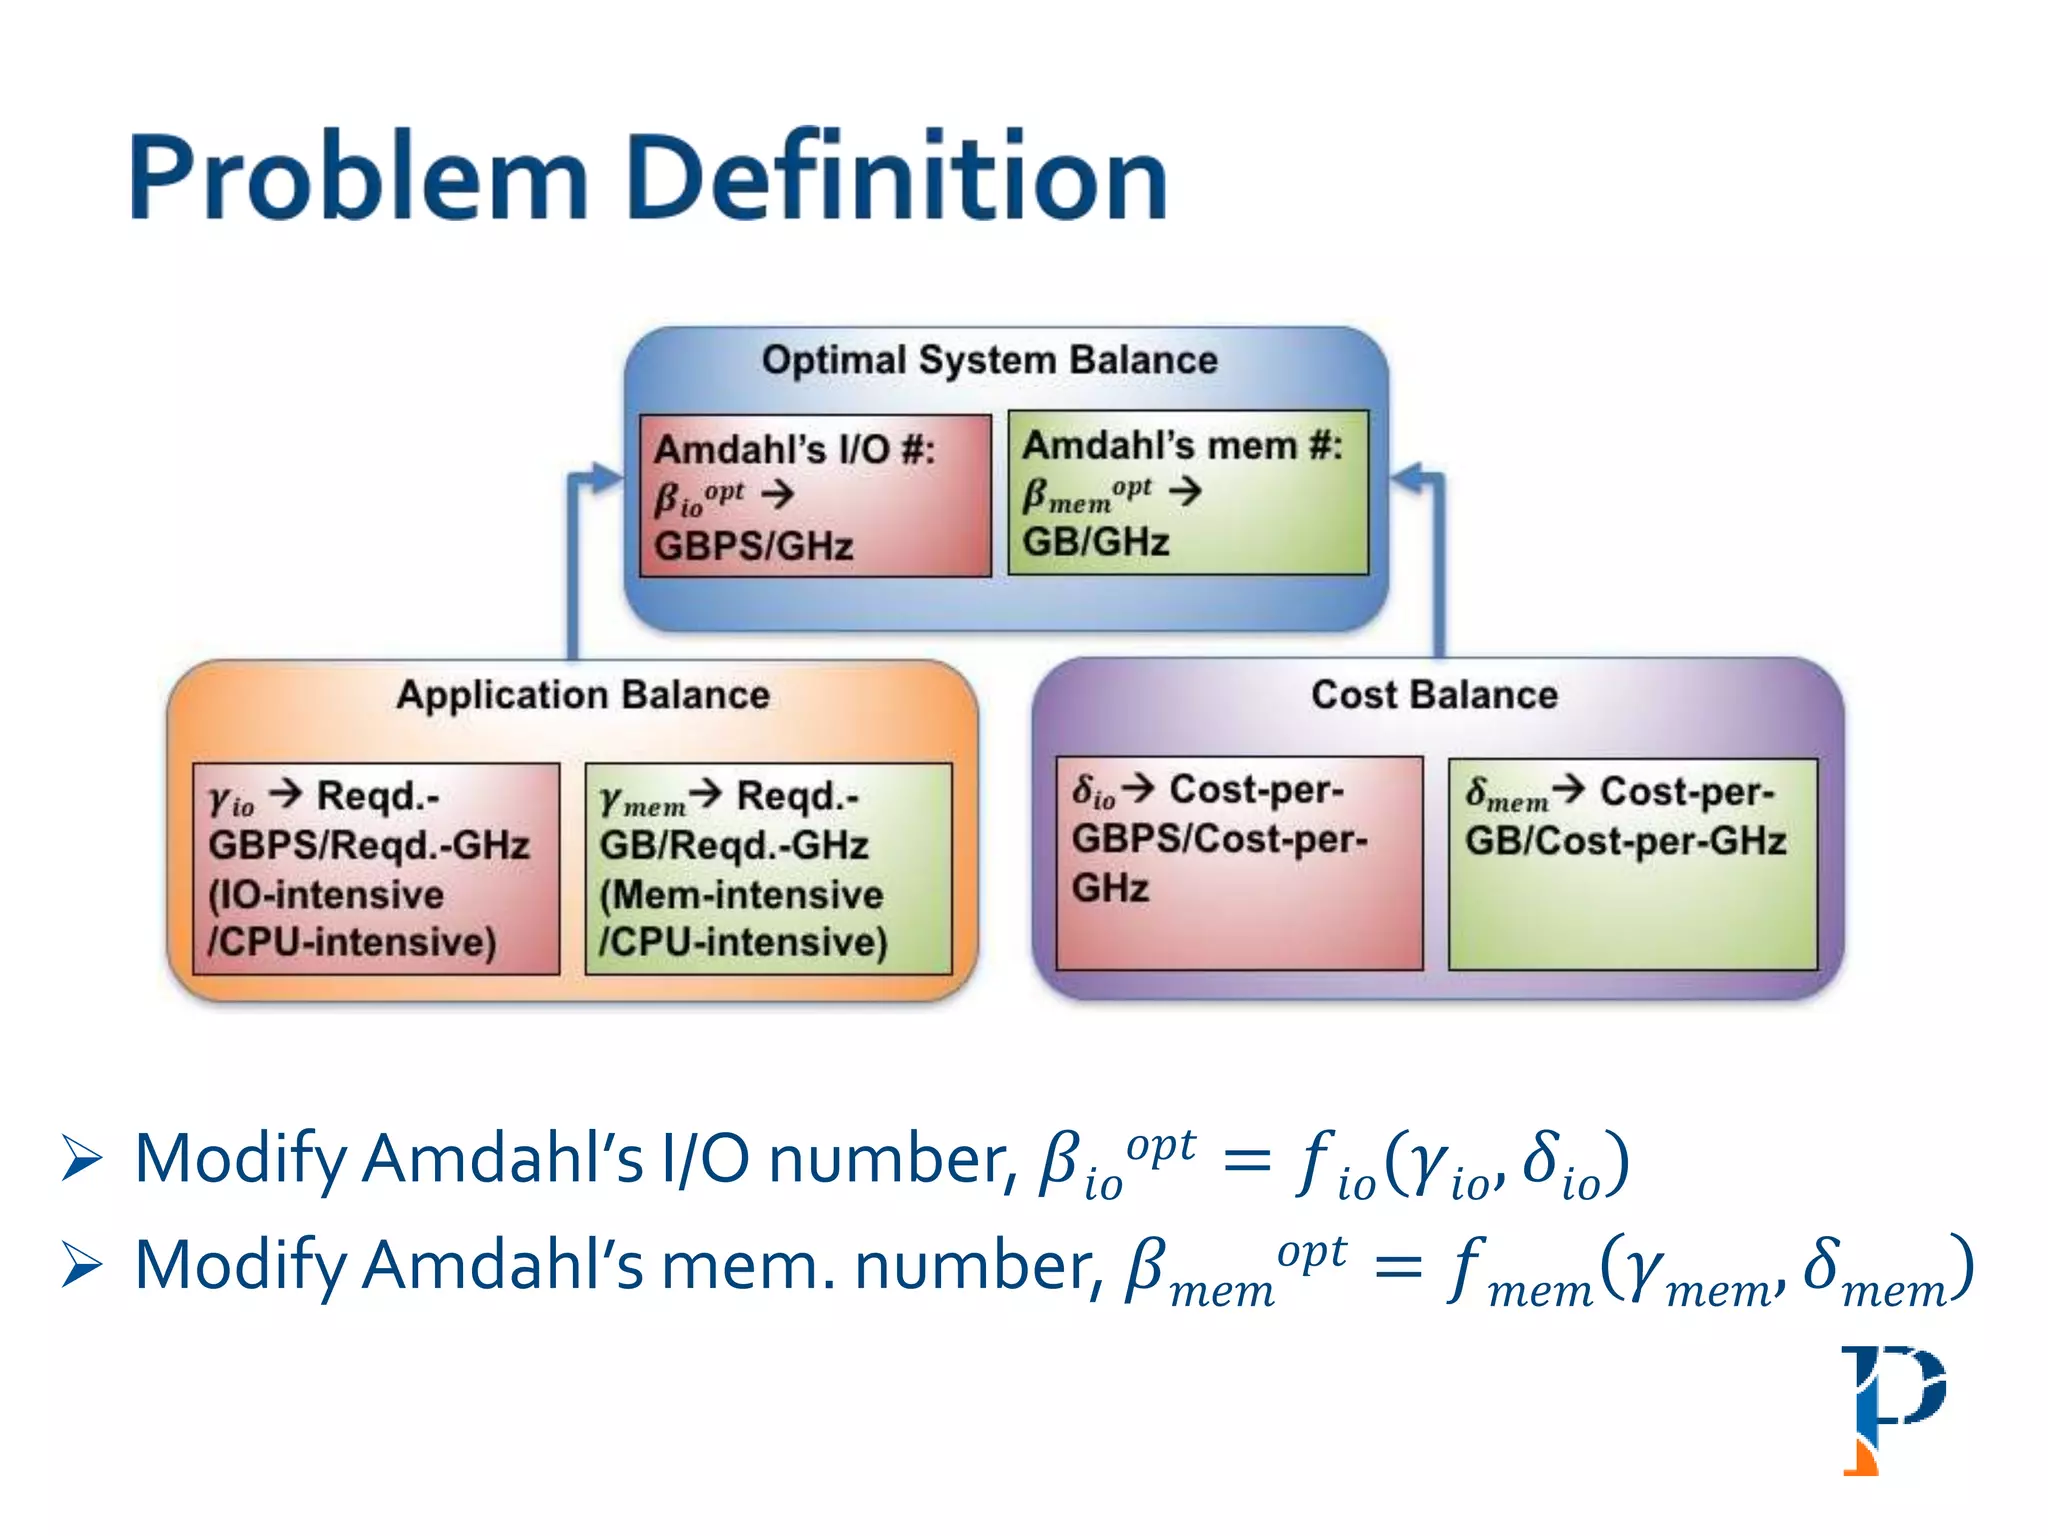
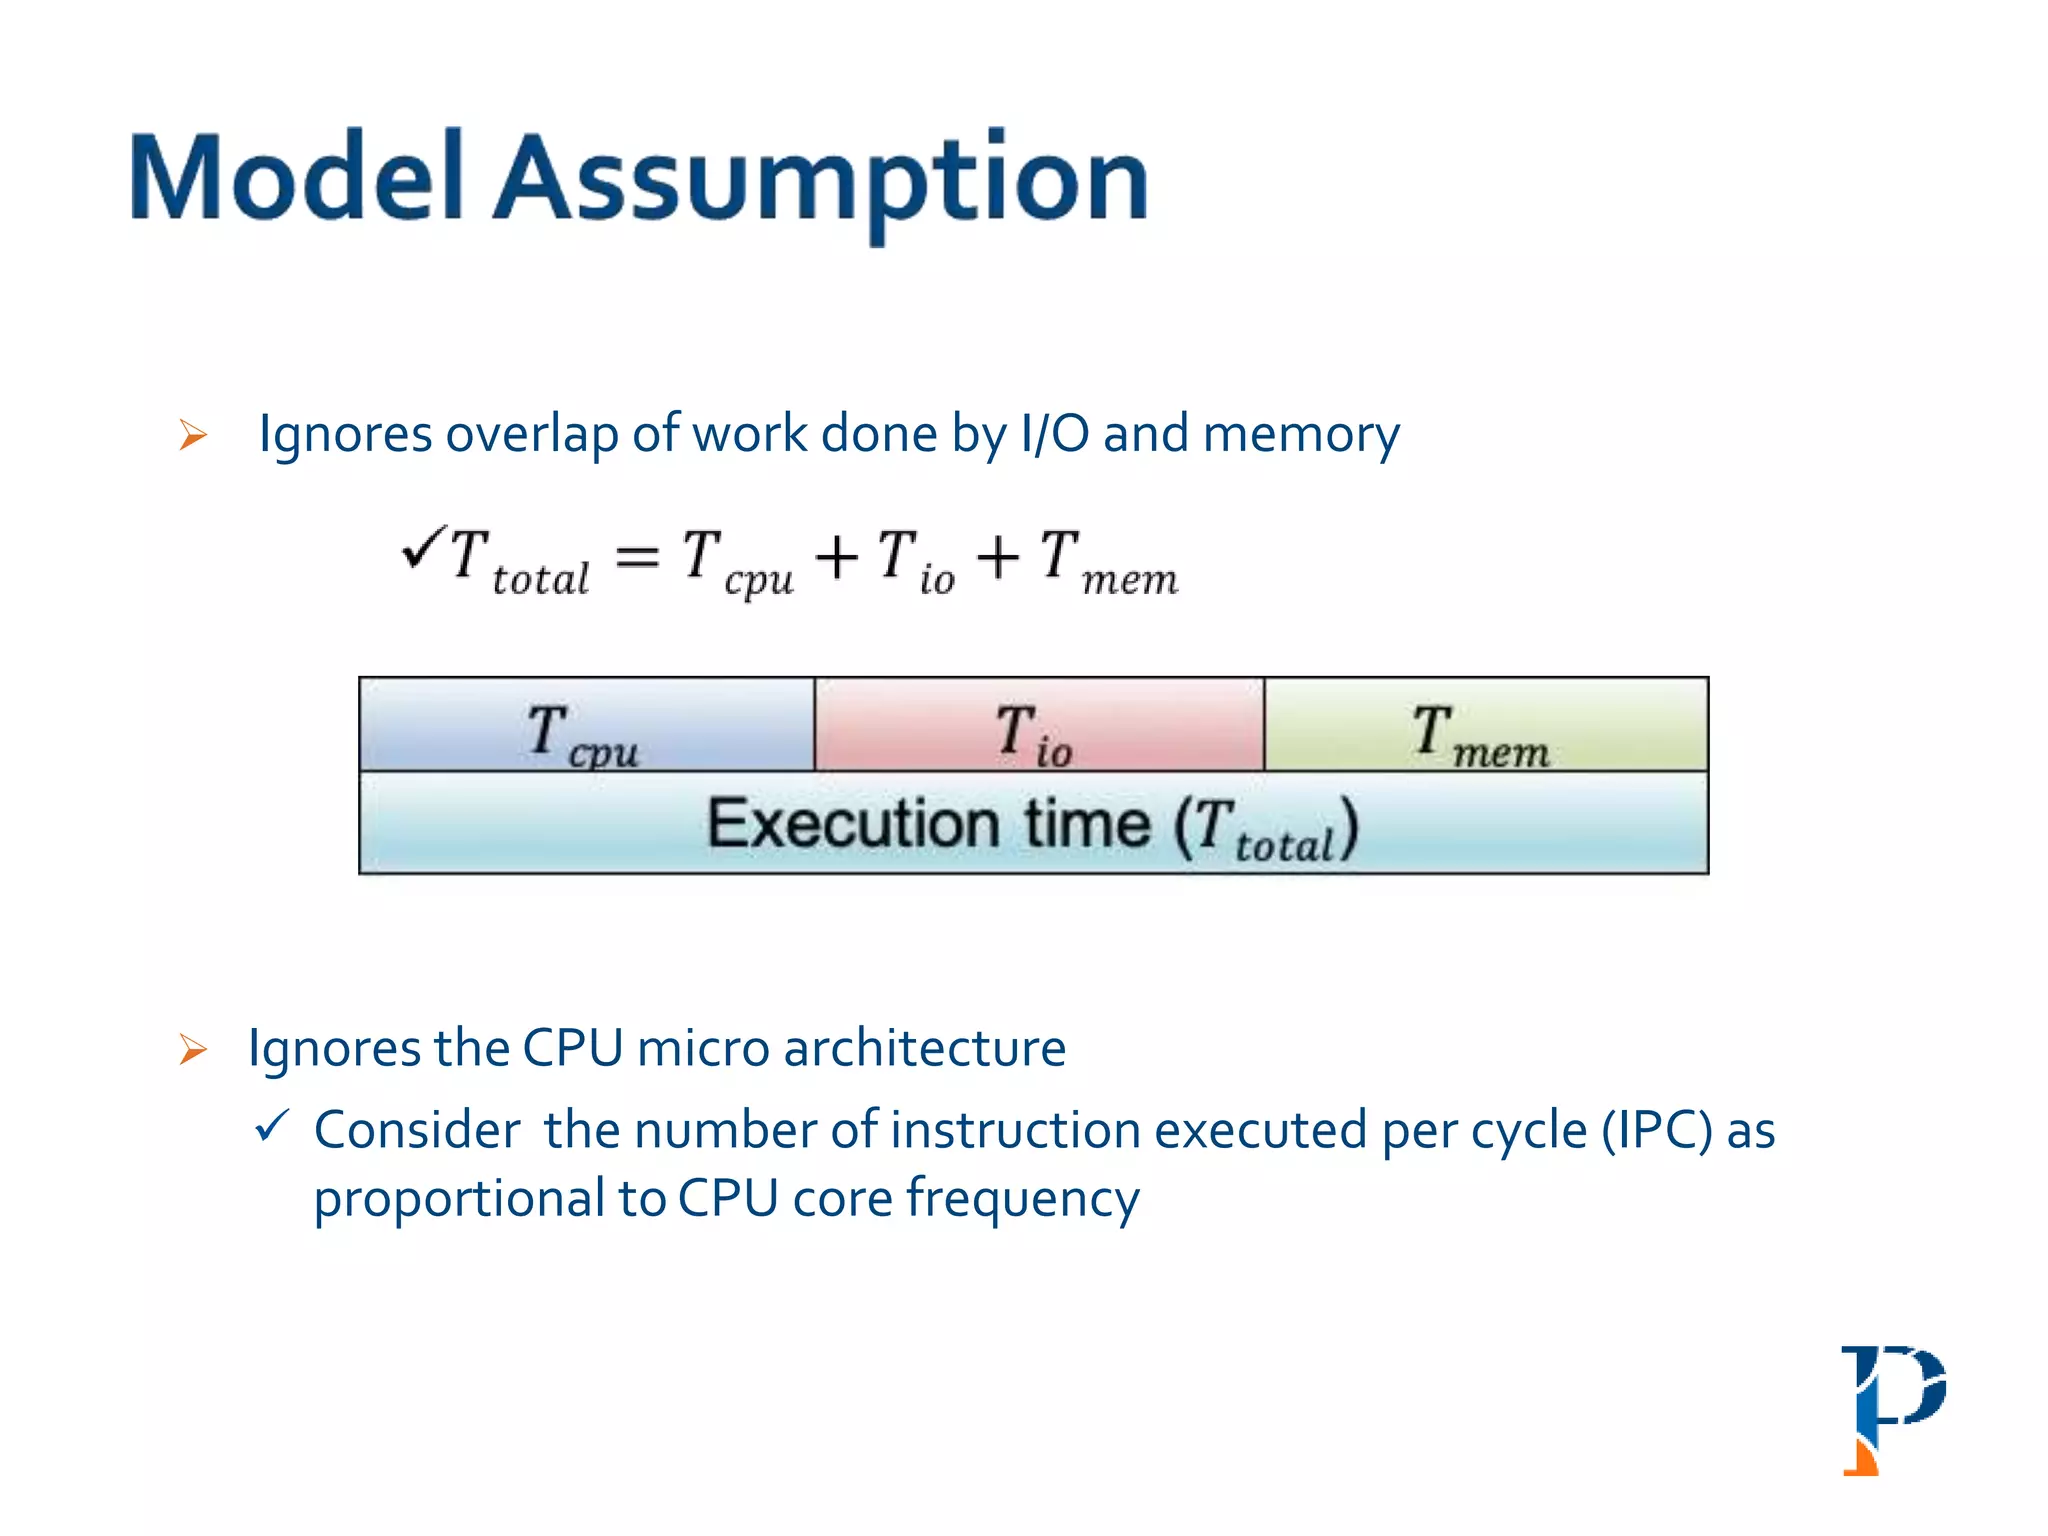
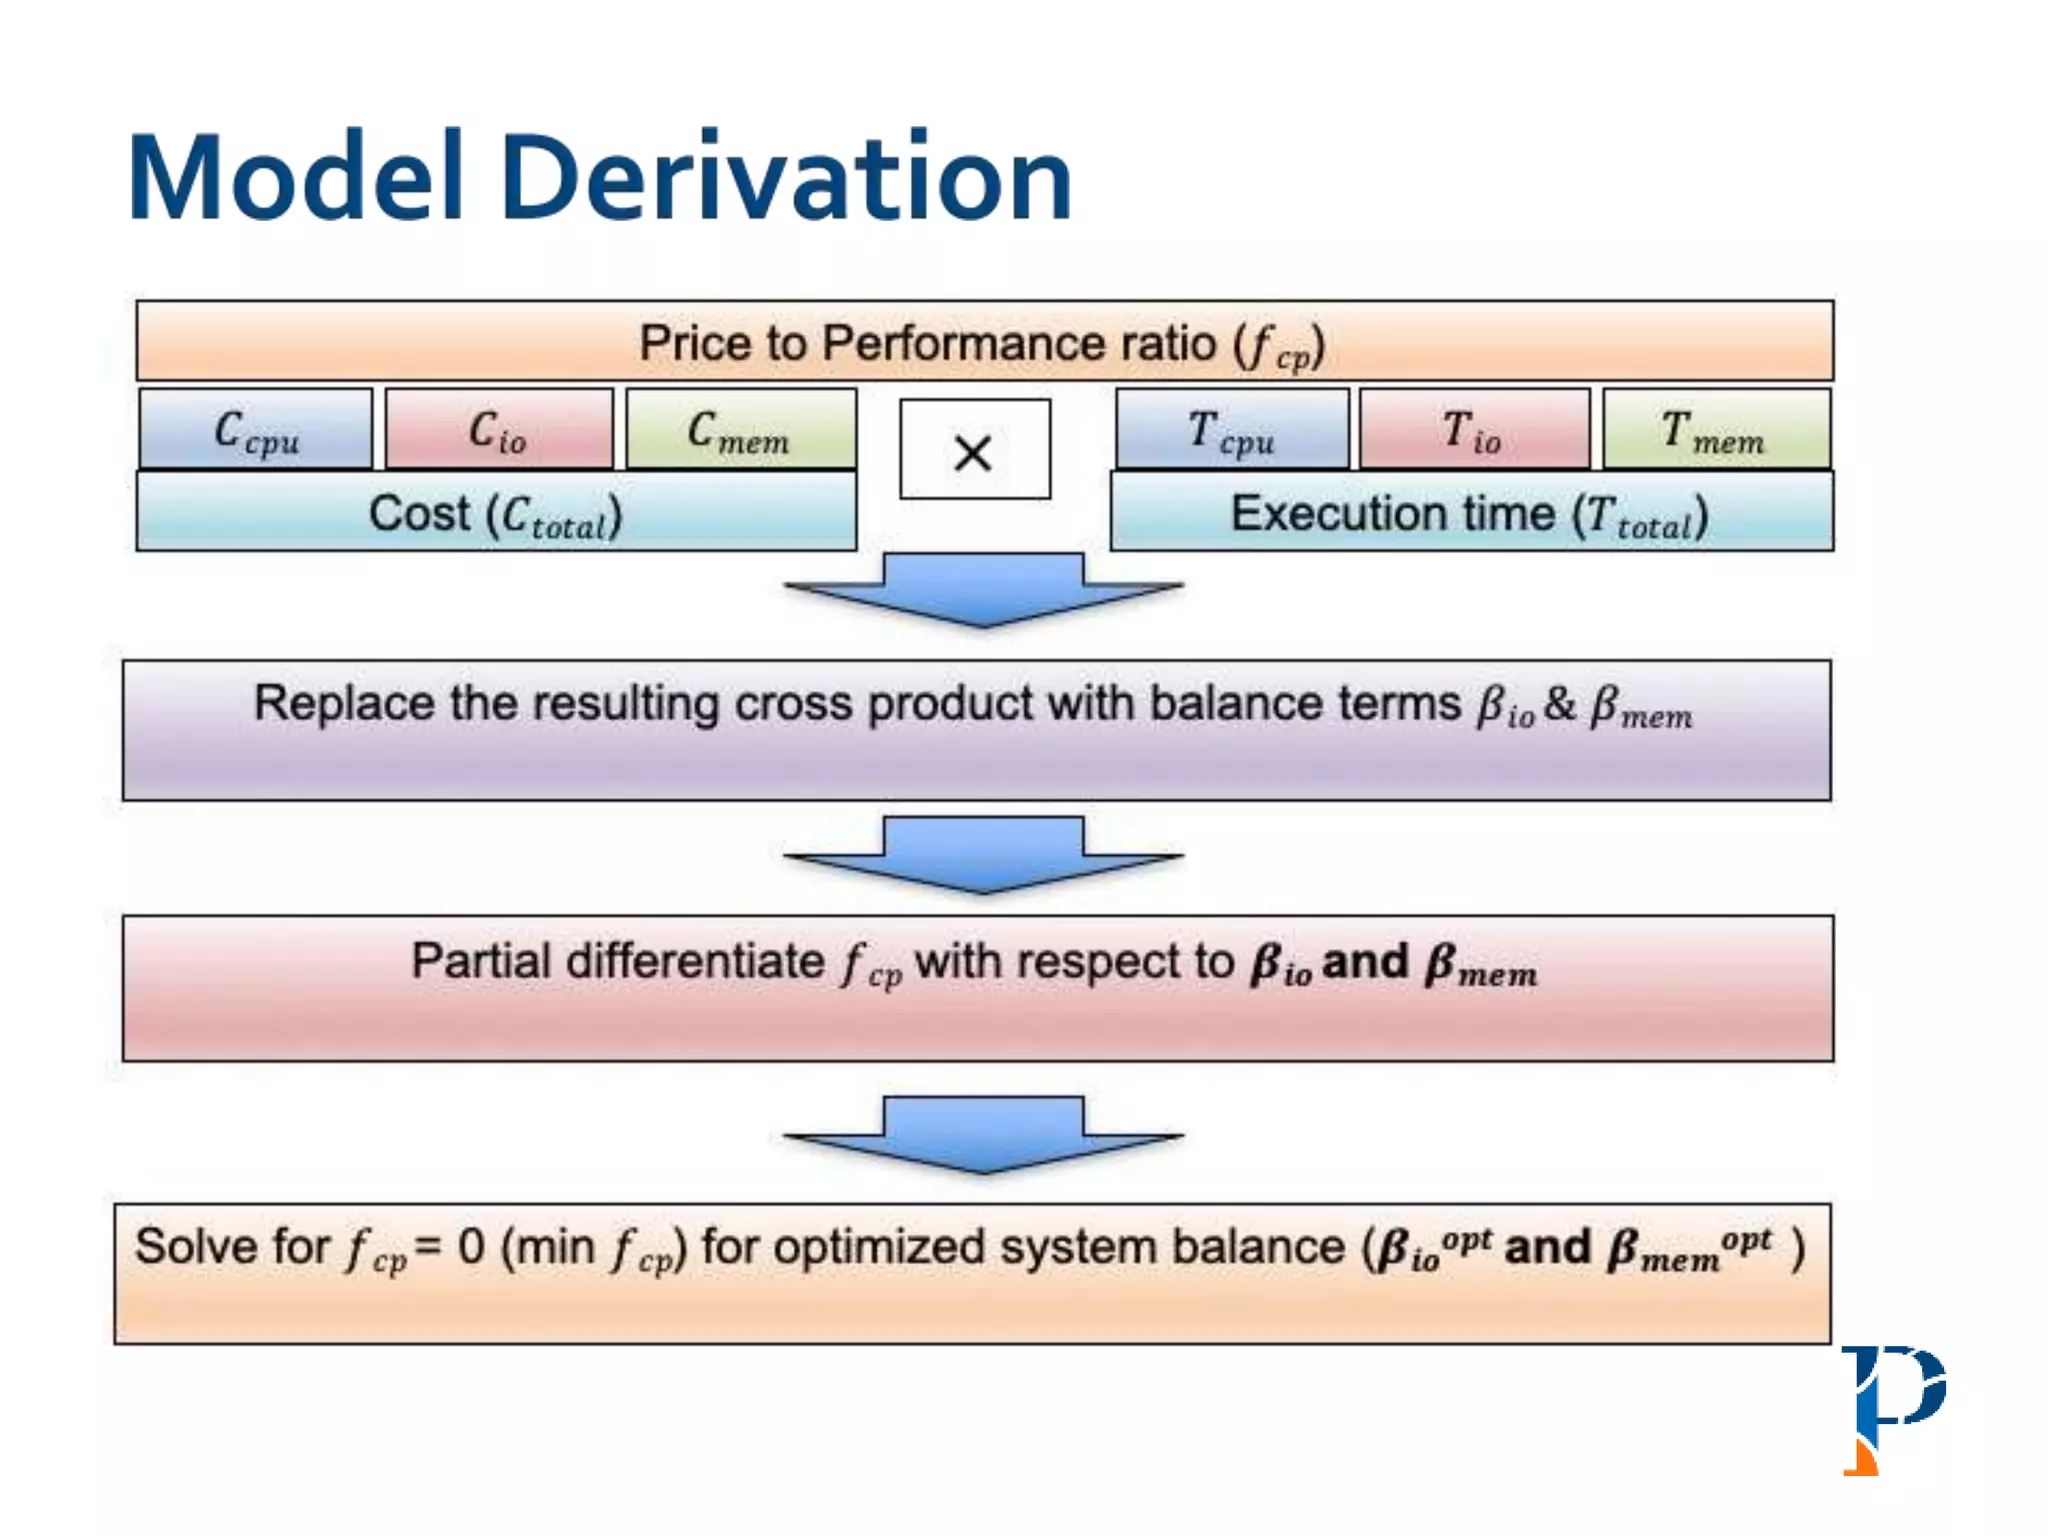
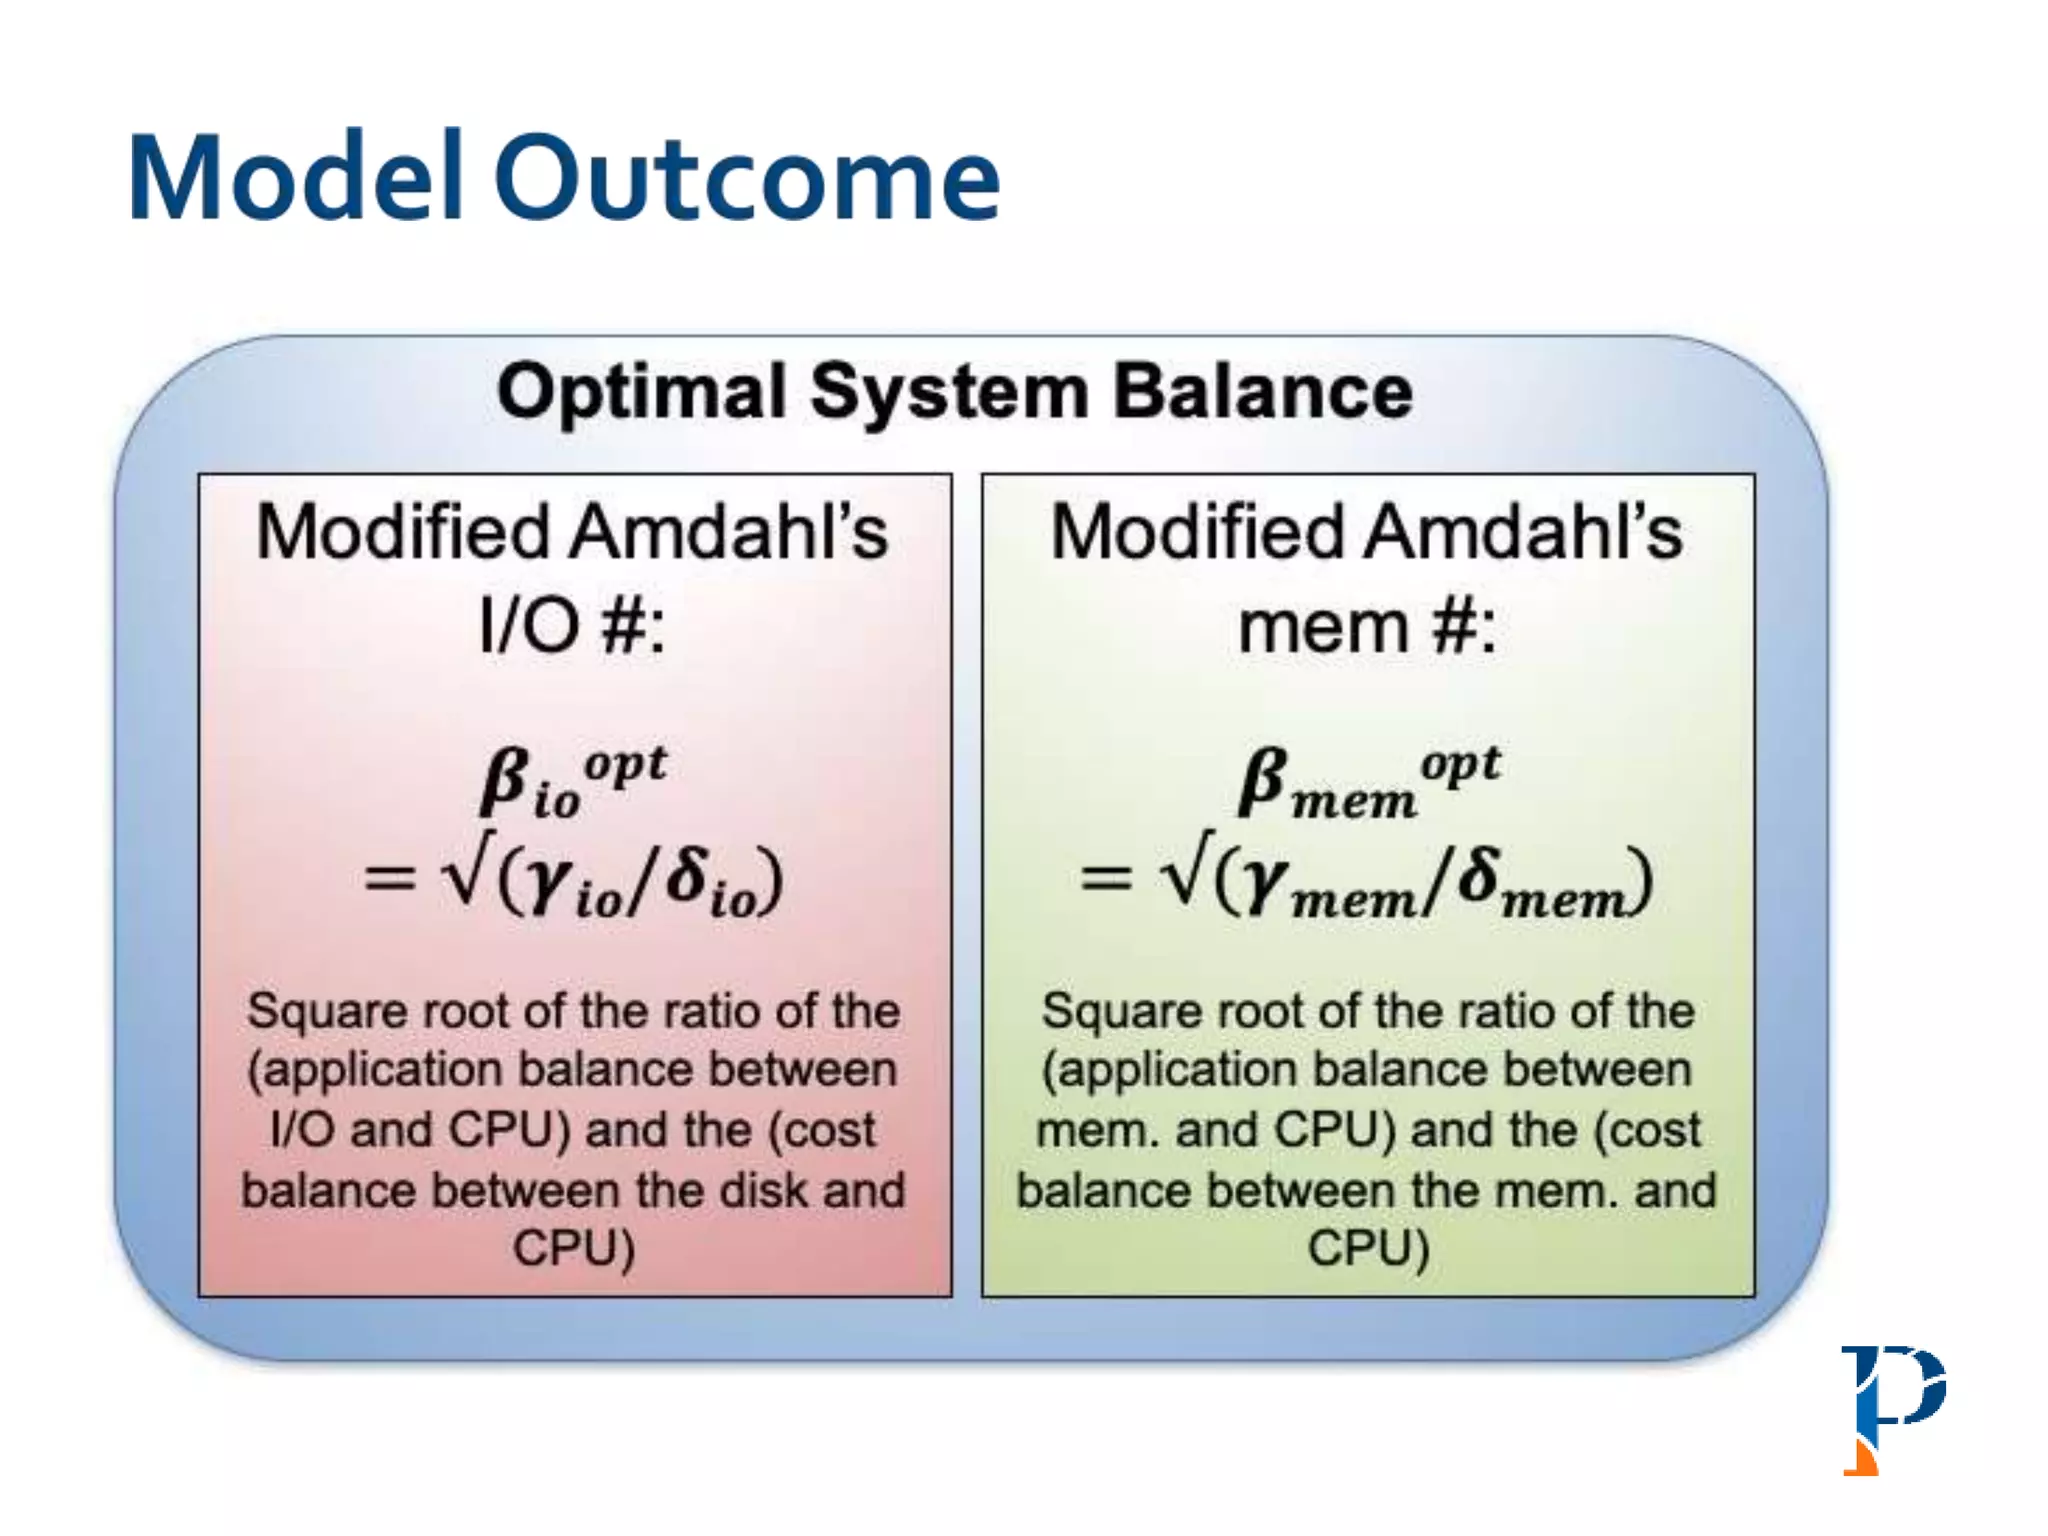
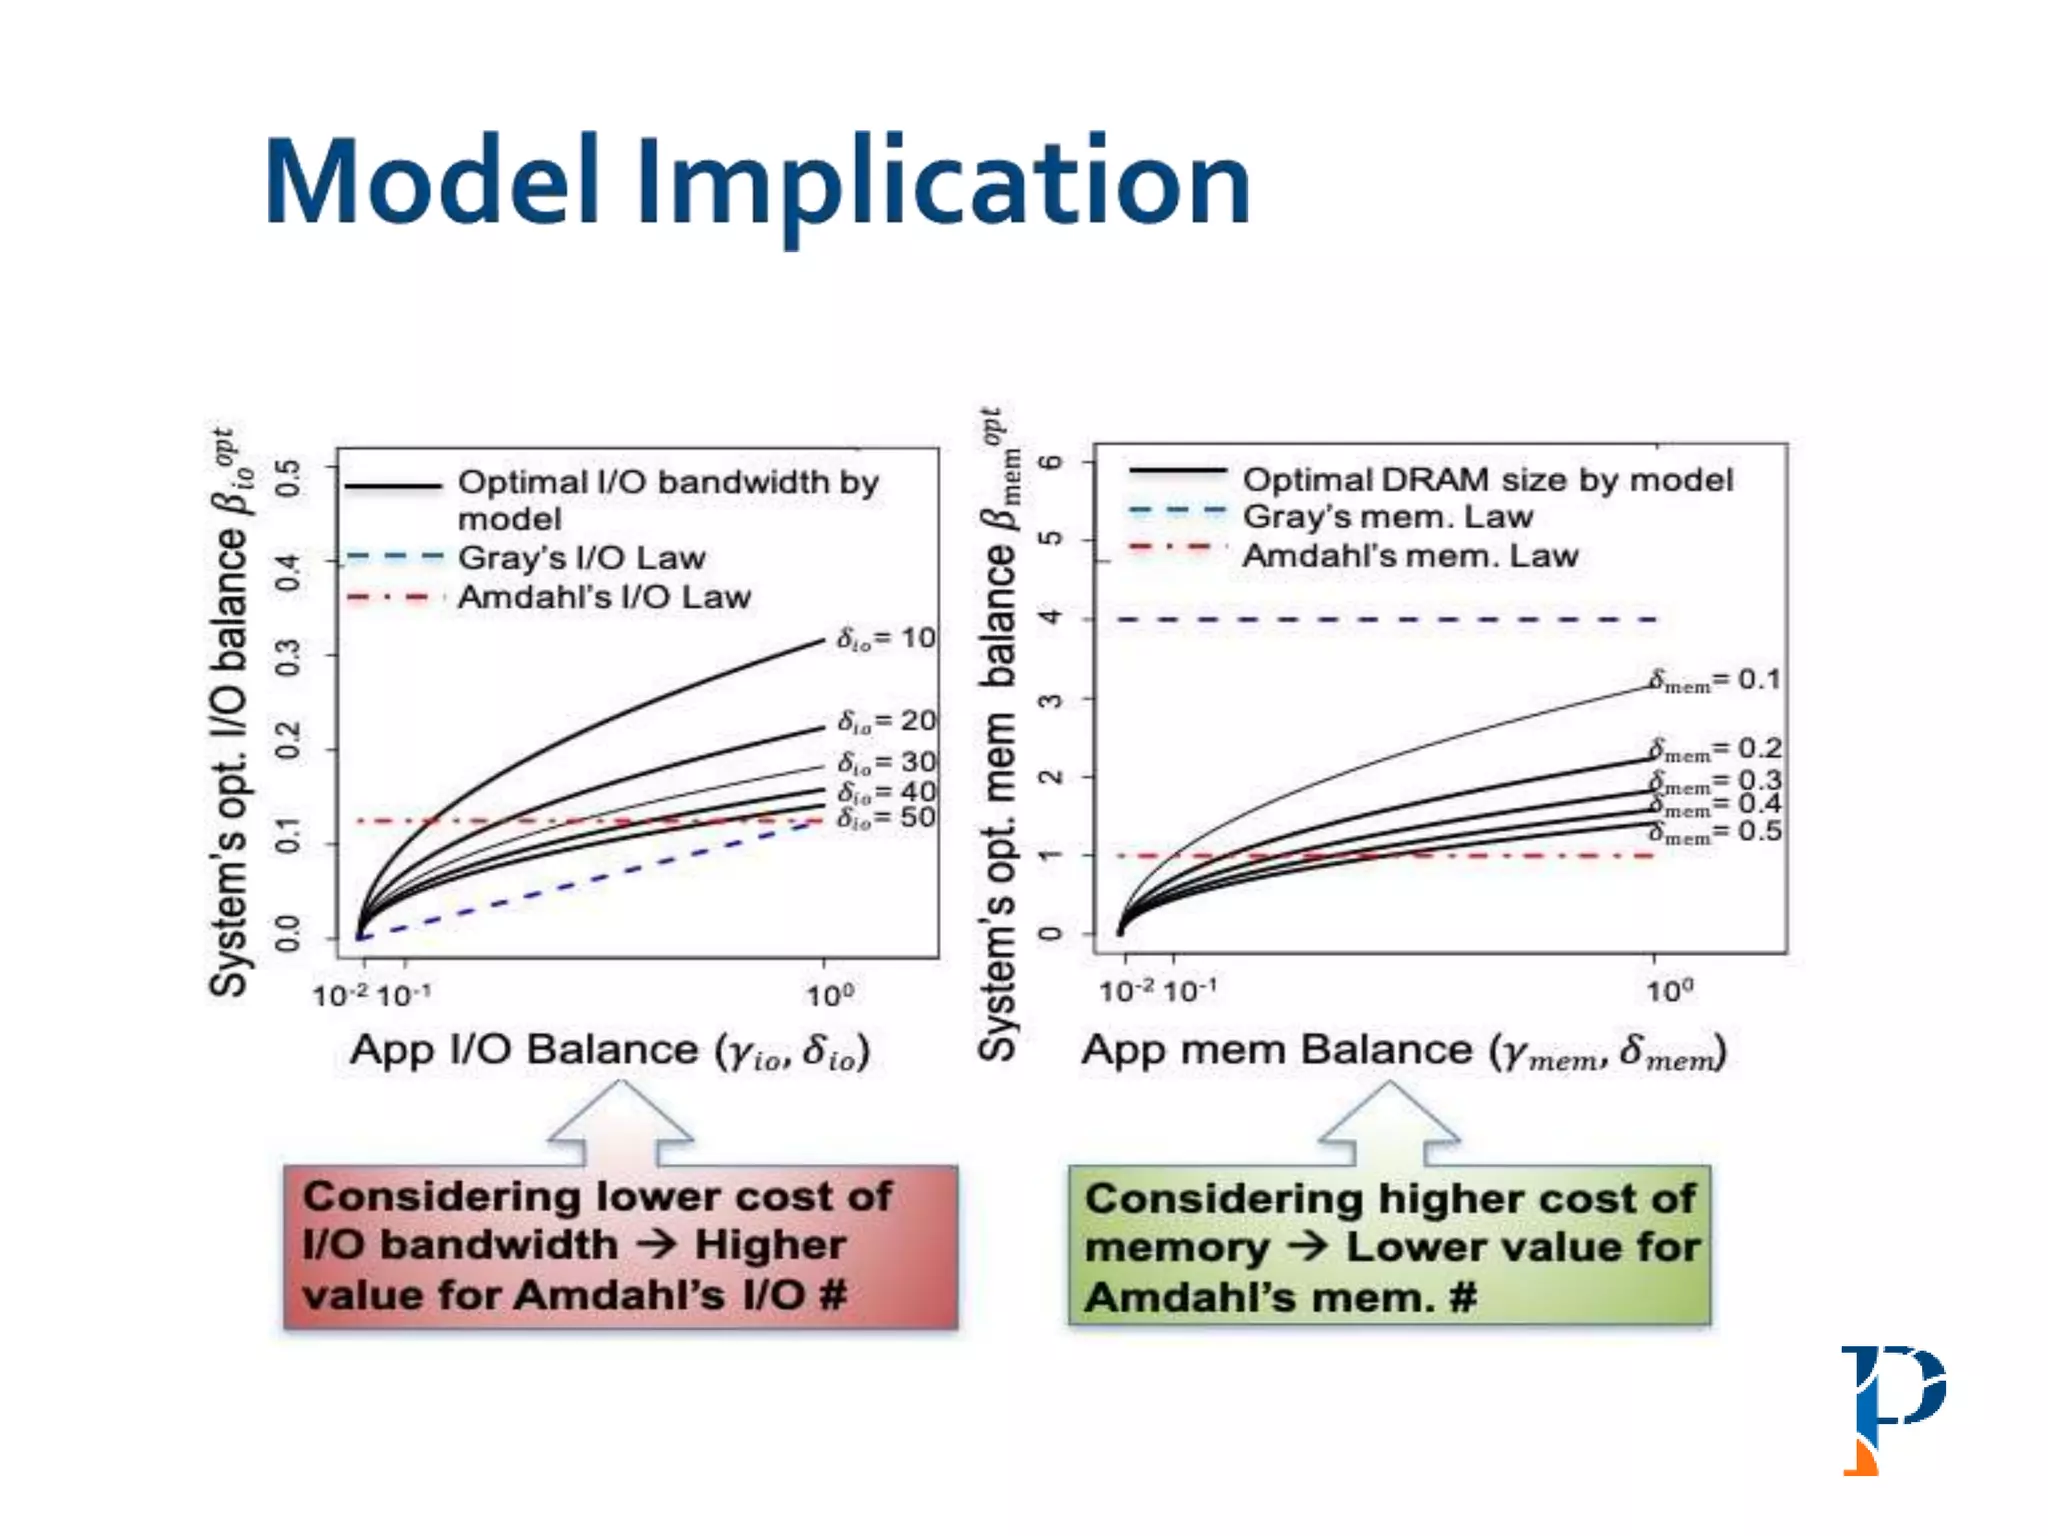
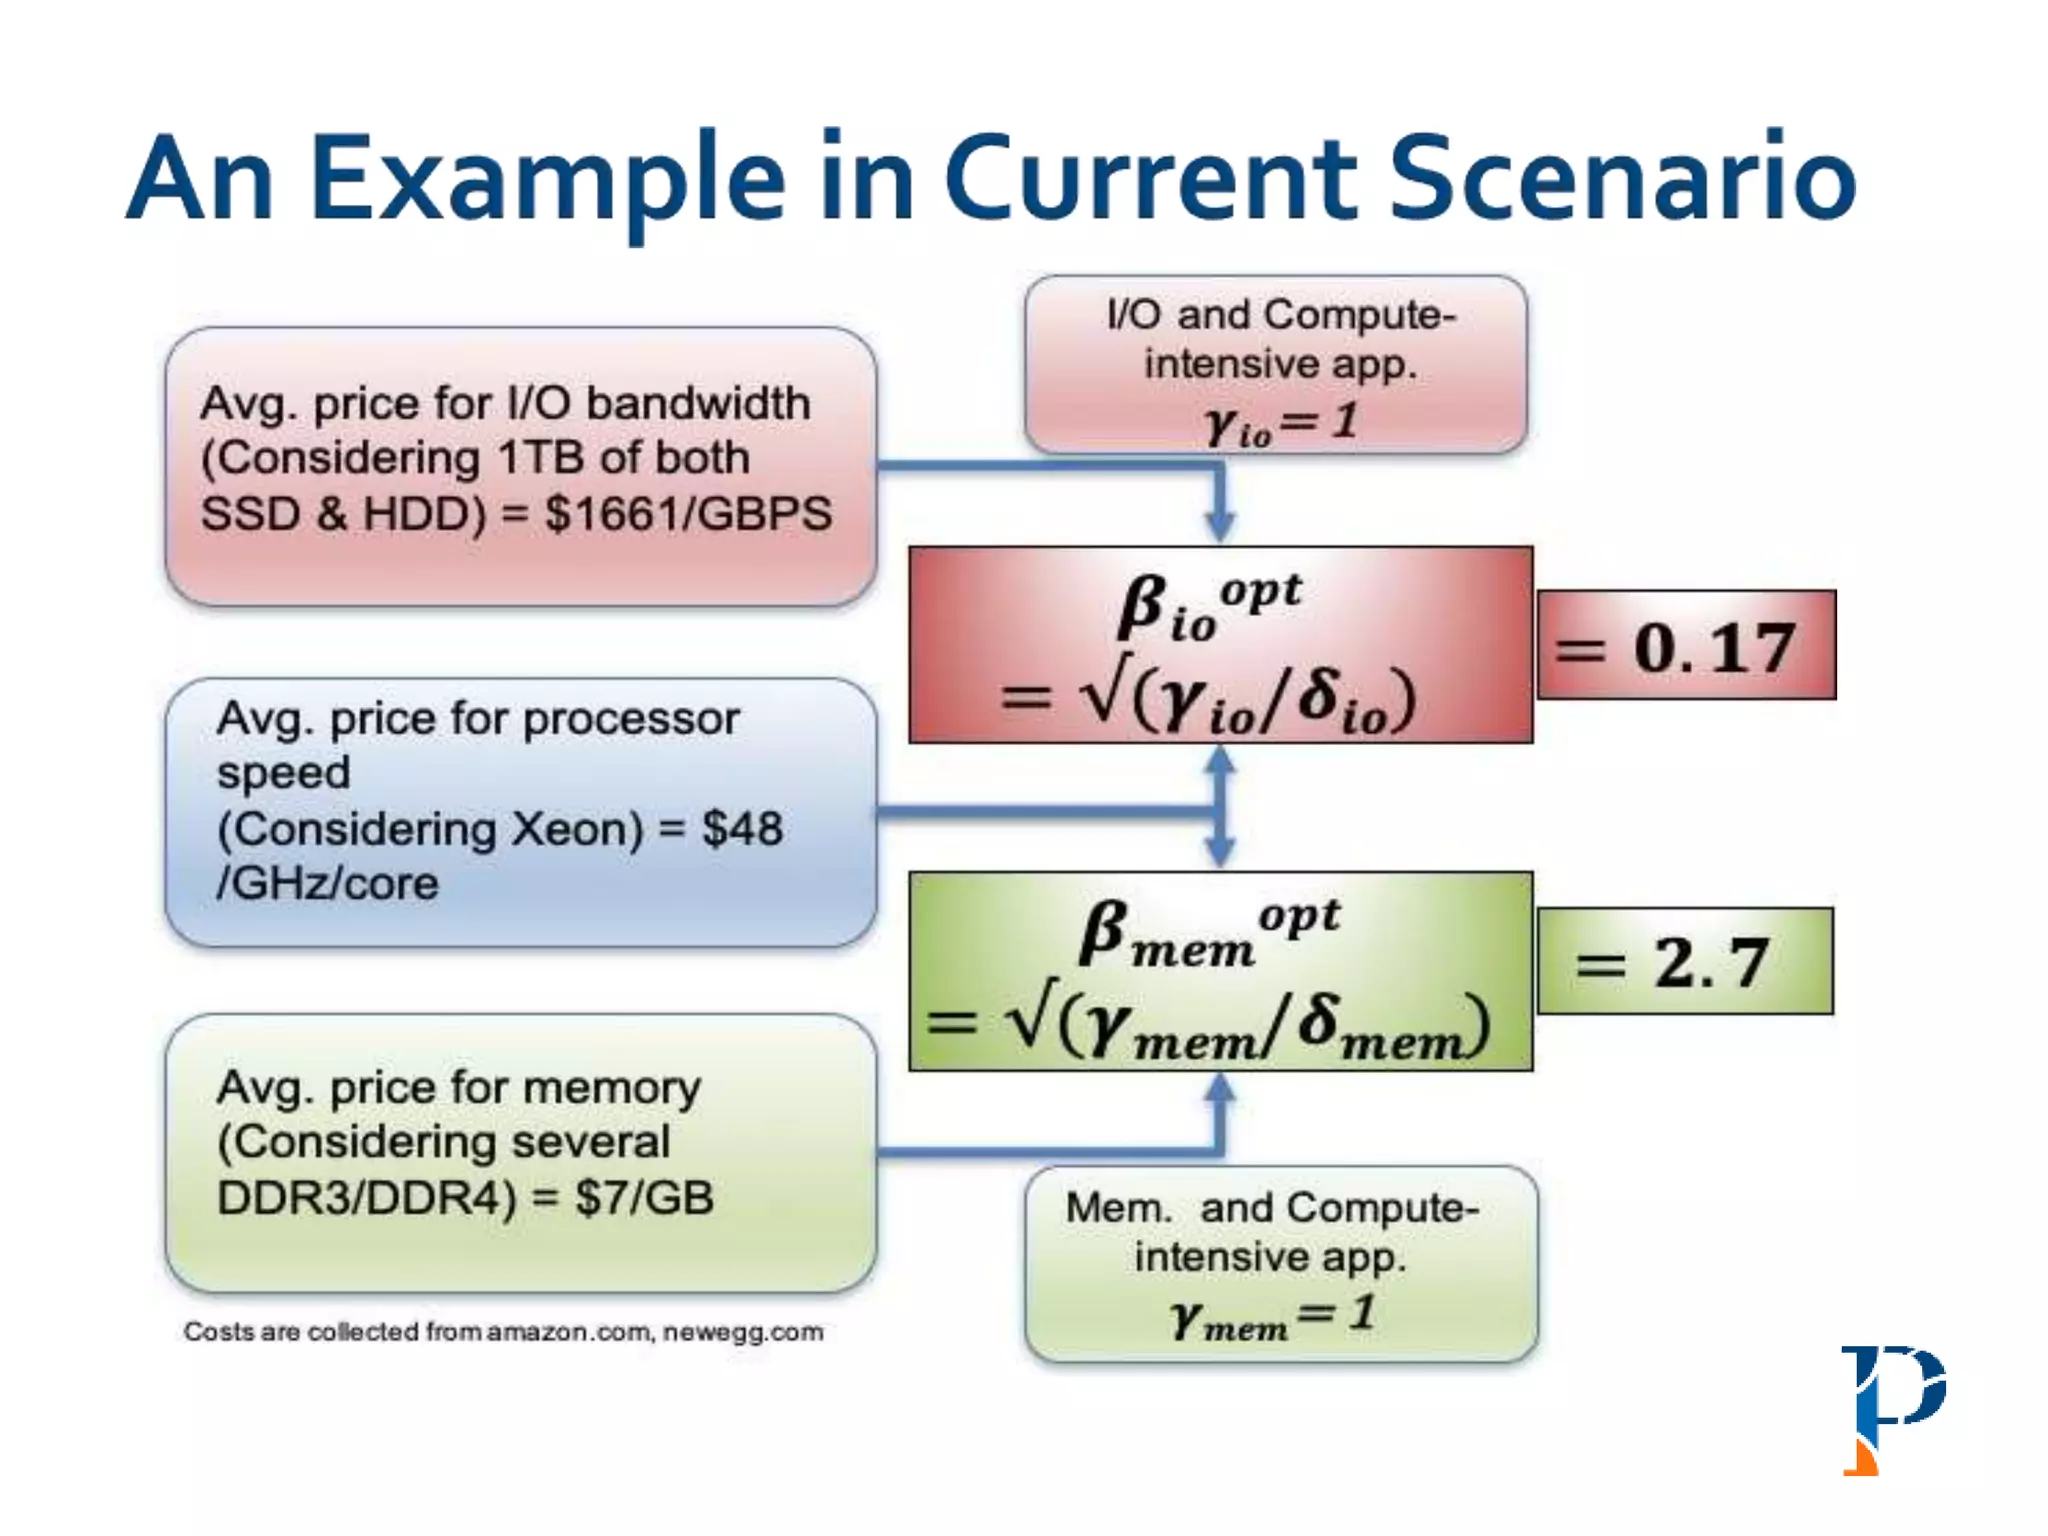
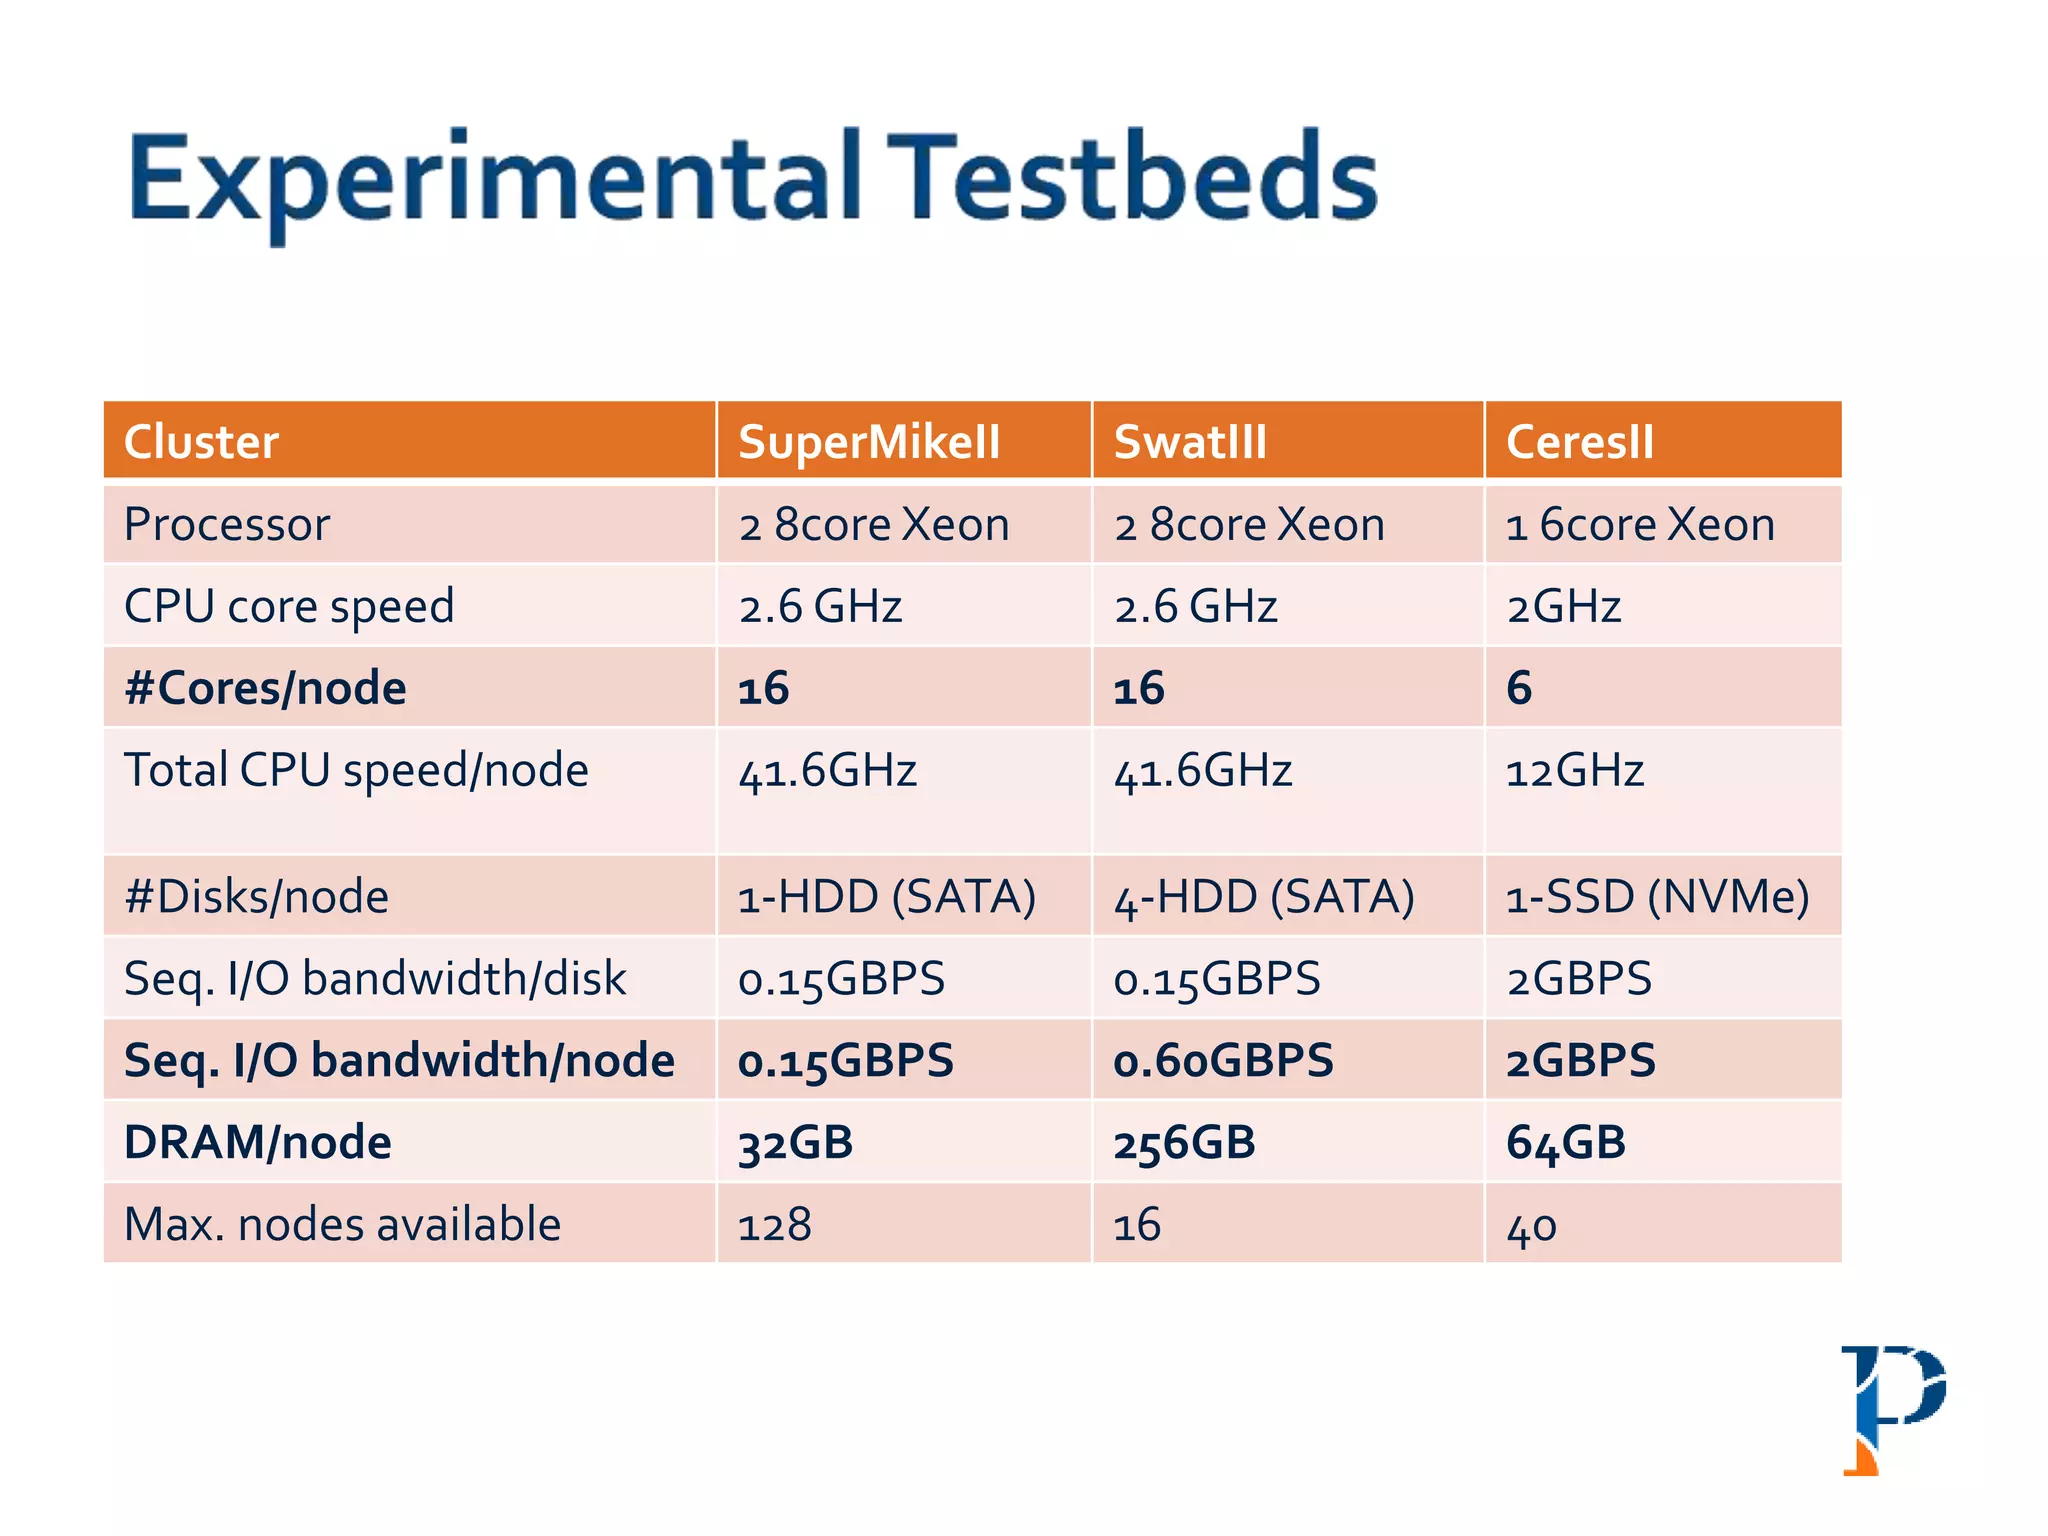
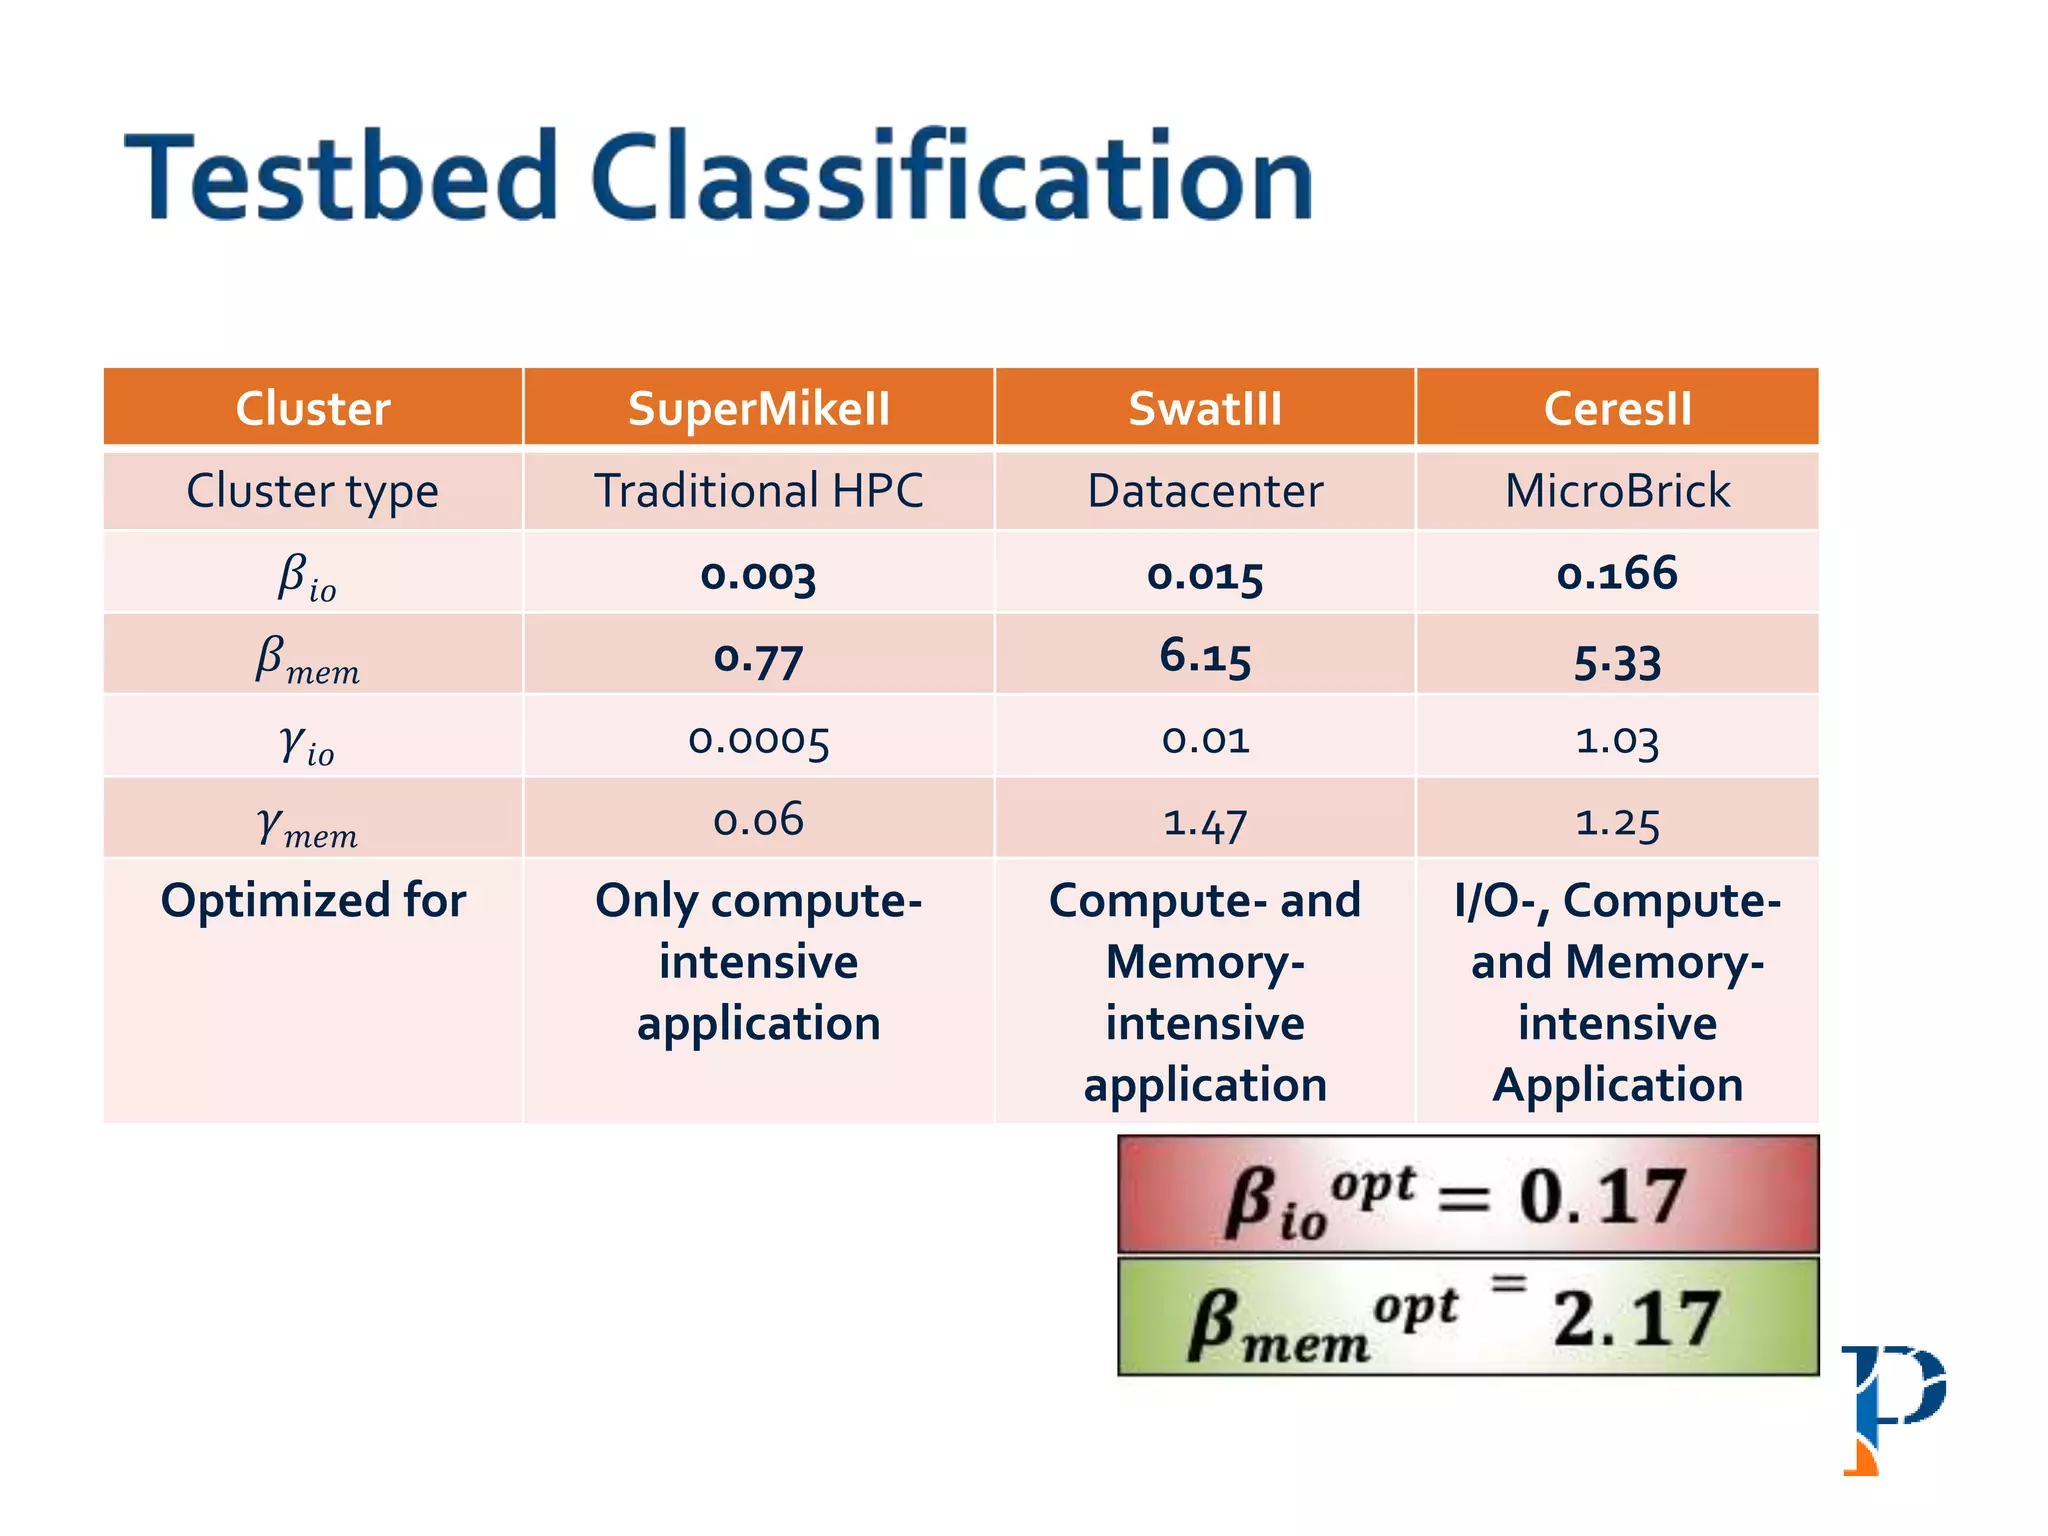
“AugmentingAmdahl’s Second Law: ATheoretical Model for Cost-Effective Balanced HPC
Infrastructure for Data-Driven Science” Arghya Kusum Das, Jaeki Hong, Sayan Goswami,
Richard Platania, Kisung Lee, Wooseok Chang, Seung-Jong Park. IEEE Cloud 2017
[collaboration with SAMSUNG Electronics Ltd, S. Korea]
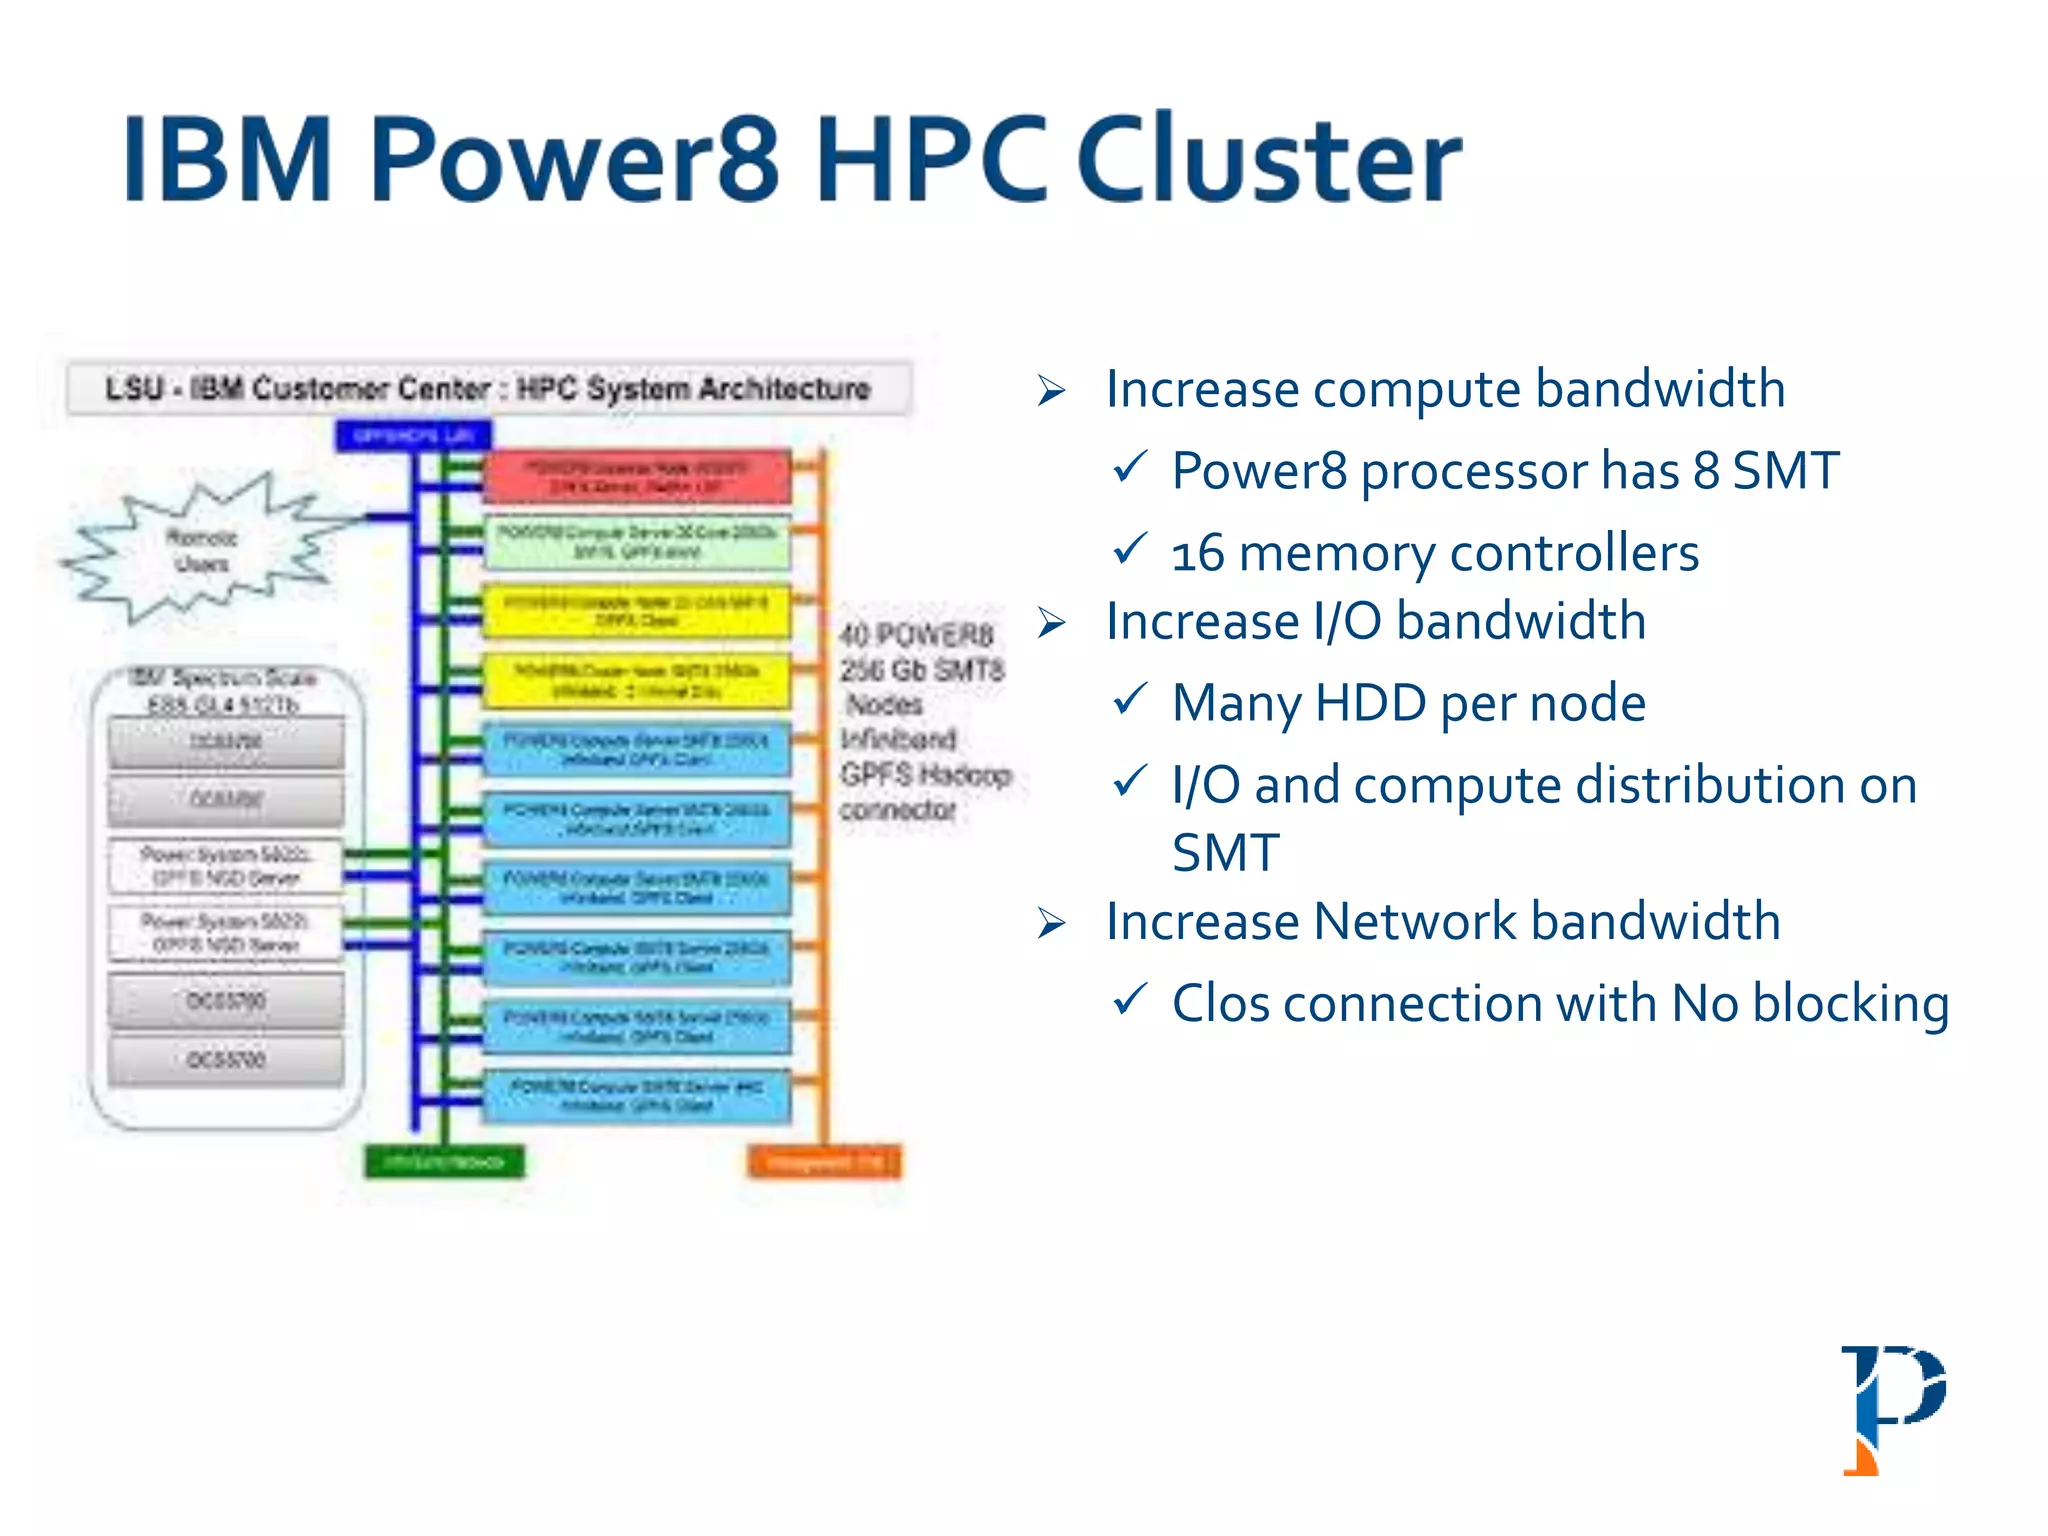
“IBM POWER8® HPC SystemAccelerates Genomics Analysis with SMT8 Multithreading”
Arghya Kusum Das, Sayan Goswami, Richard Platania, Seung-Jong Park, Ram
Ramanujam, Gus Kousoulas, Frank Lee, Ravi arimilli,Terry Leatherland, Joana Wong, John
Simpson,Grace Liu, JinchunWang. DynamicWhite Paper for Louisiana State University
collaboration with IBM
“BIC-LSU: Big Data Research Integration with Cyberinfrastructure for LSU” Chiu, Chui-hui,
Nathan Lewis, Dipak Kumar Singh, Arghya Kusum Das, Mohammad M. Jalazai, Richard
Platania, Sayan Goswami, Kisung Lee, and Seung-Jong Park. XSEDE 2016.](https://image.slidesharecdn.com/talkfinalppt-190828022516/75/Towards-Ultra-Large-Scale-System-Design-of-Scalable-Software-and-Next-Gen-HPC-Cluster-for-Big-Data-Genome-Analysis-78-2048.jpg)