Download to read offline


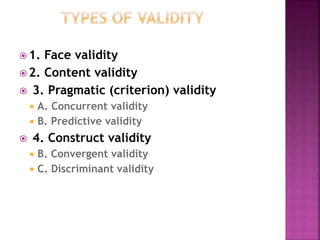


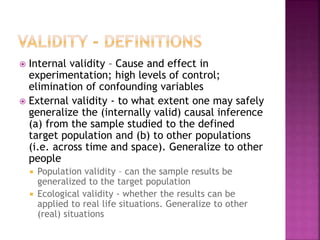
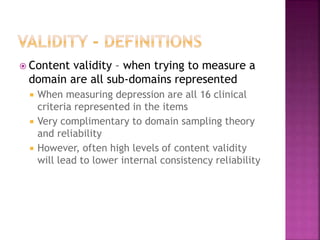
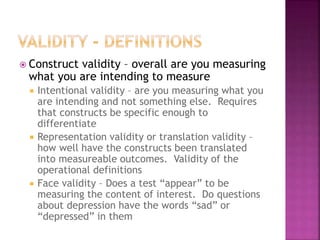
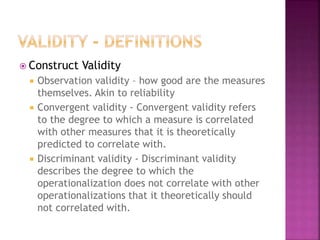
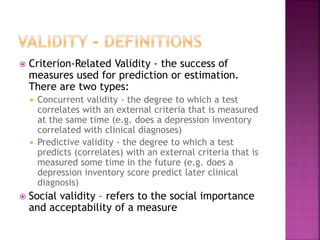
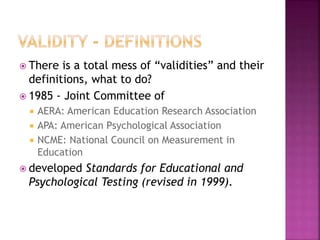
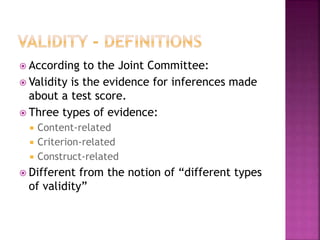
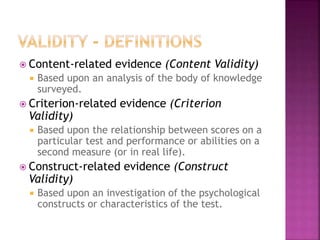
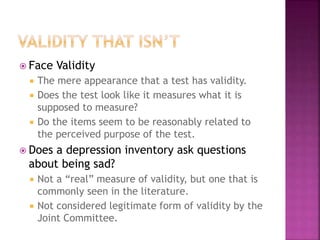

The document discusses the concepts of validity and reliability in measuring psychological constructs. It defines validity as the degree to which a measurement measures what it intends to measure. There are several types of validity discussed, including face validity, content validity, criterion validity (concurrent and predictive), and construct validity. Reliability refers to the consistency of a measurement and is assessed through measures of stability, internal consistency, and equivalence. Key methods for establishing reliability include test-retest analysis and coefficient alpha. Validity and reliability are important considerations in developing rigorous quantitative measures in the social sciences.