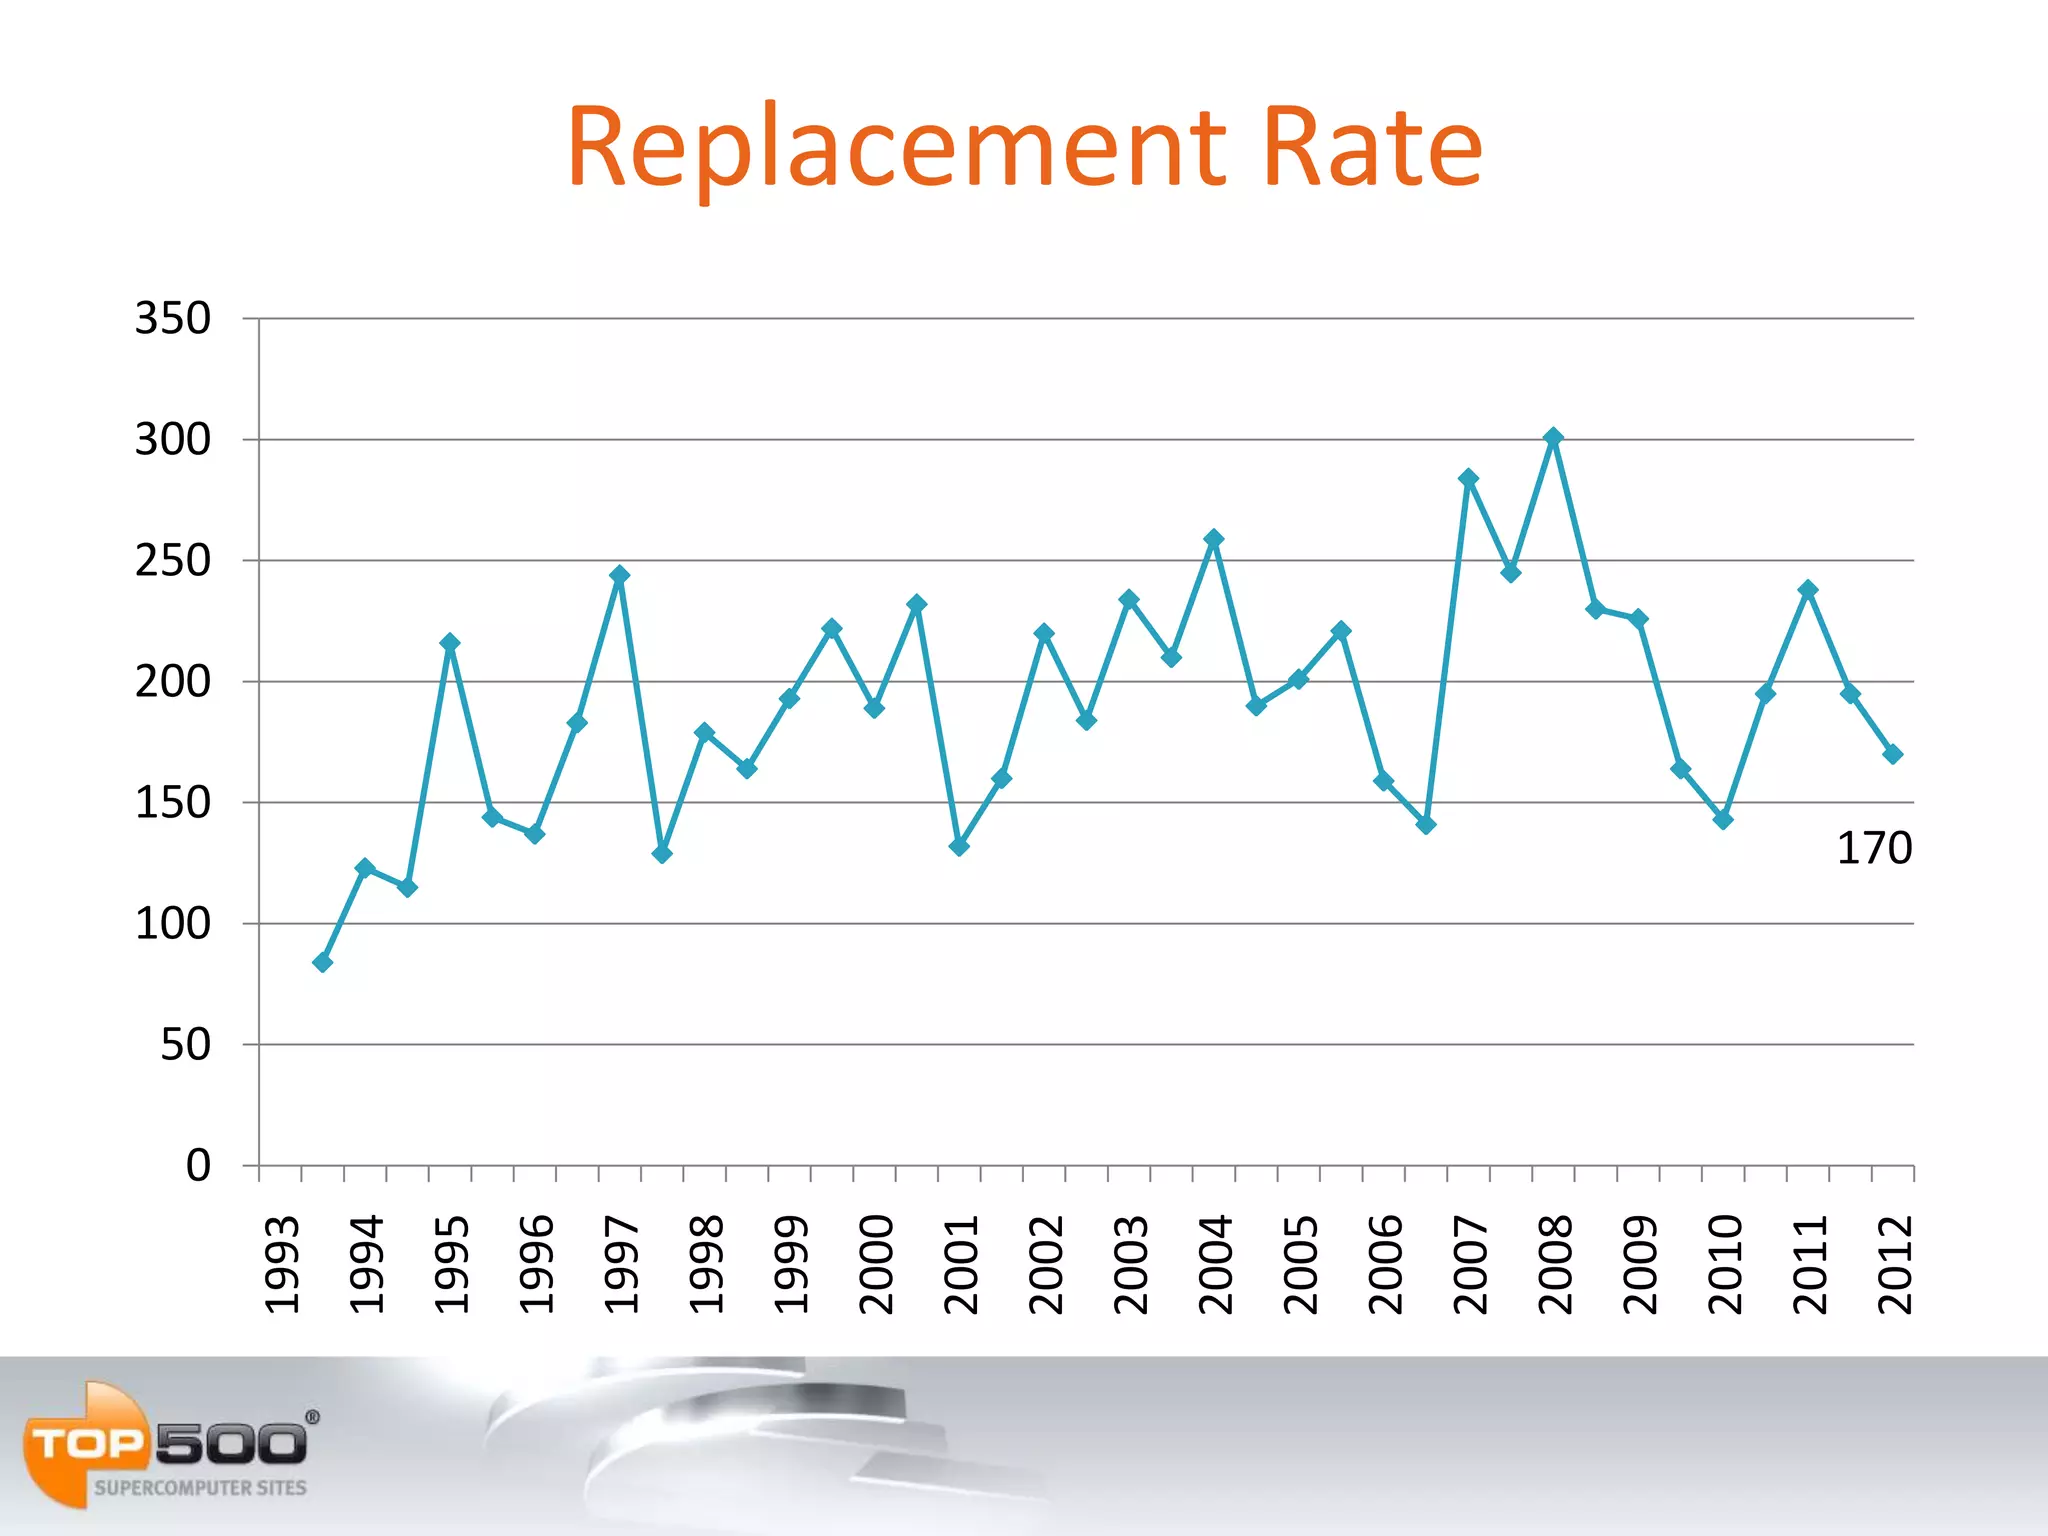
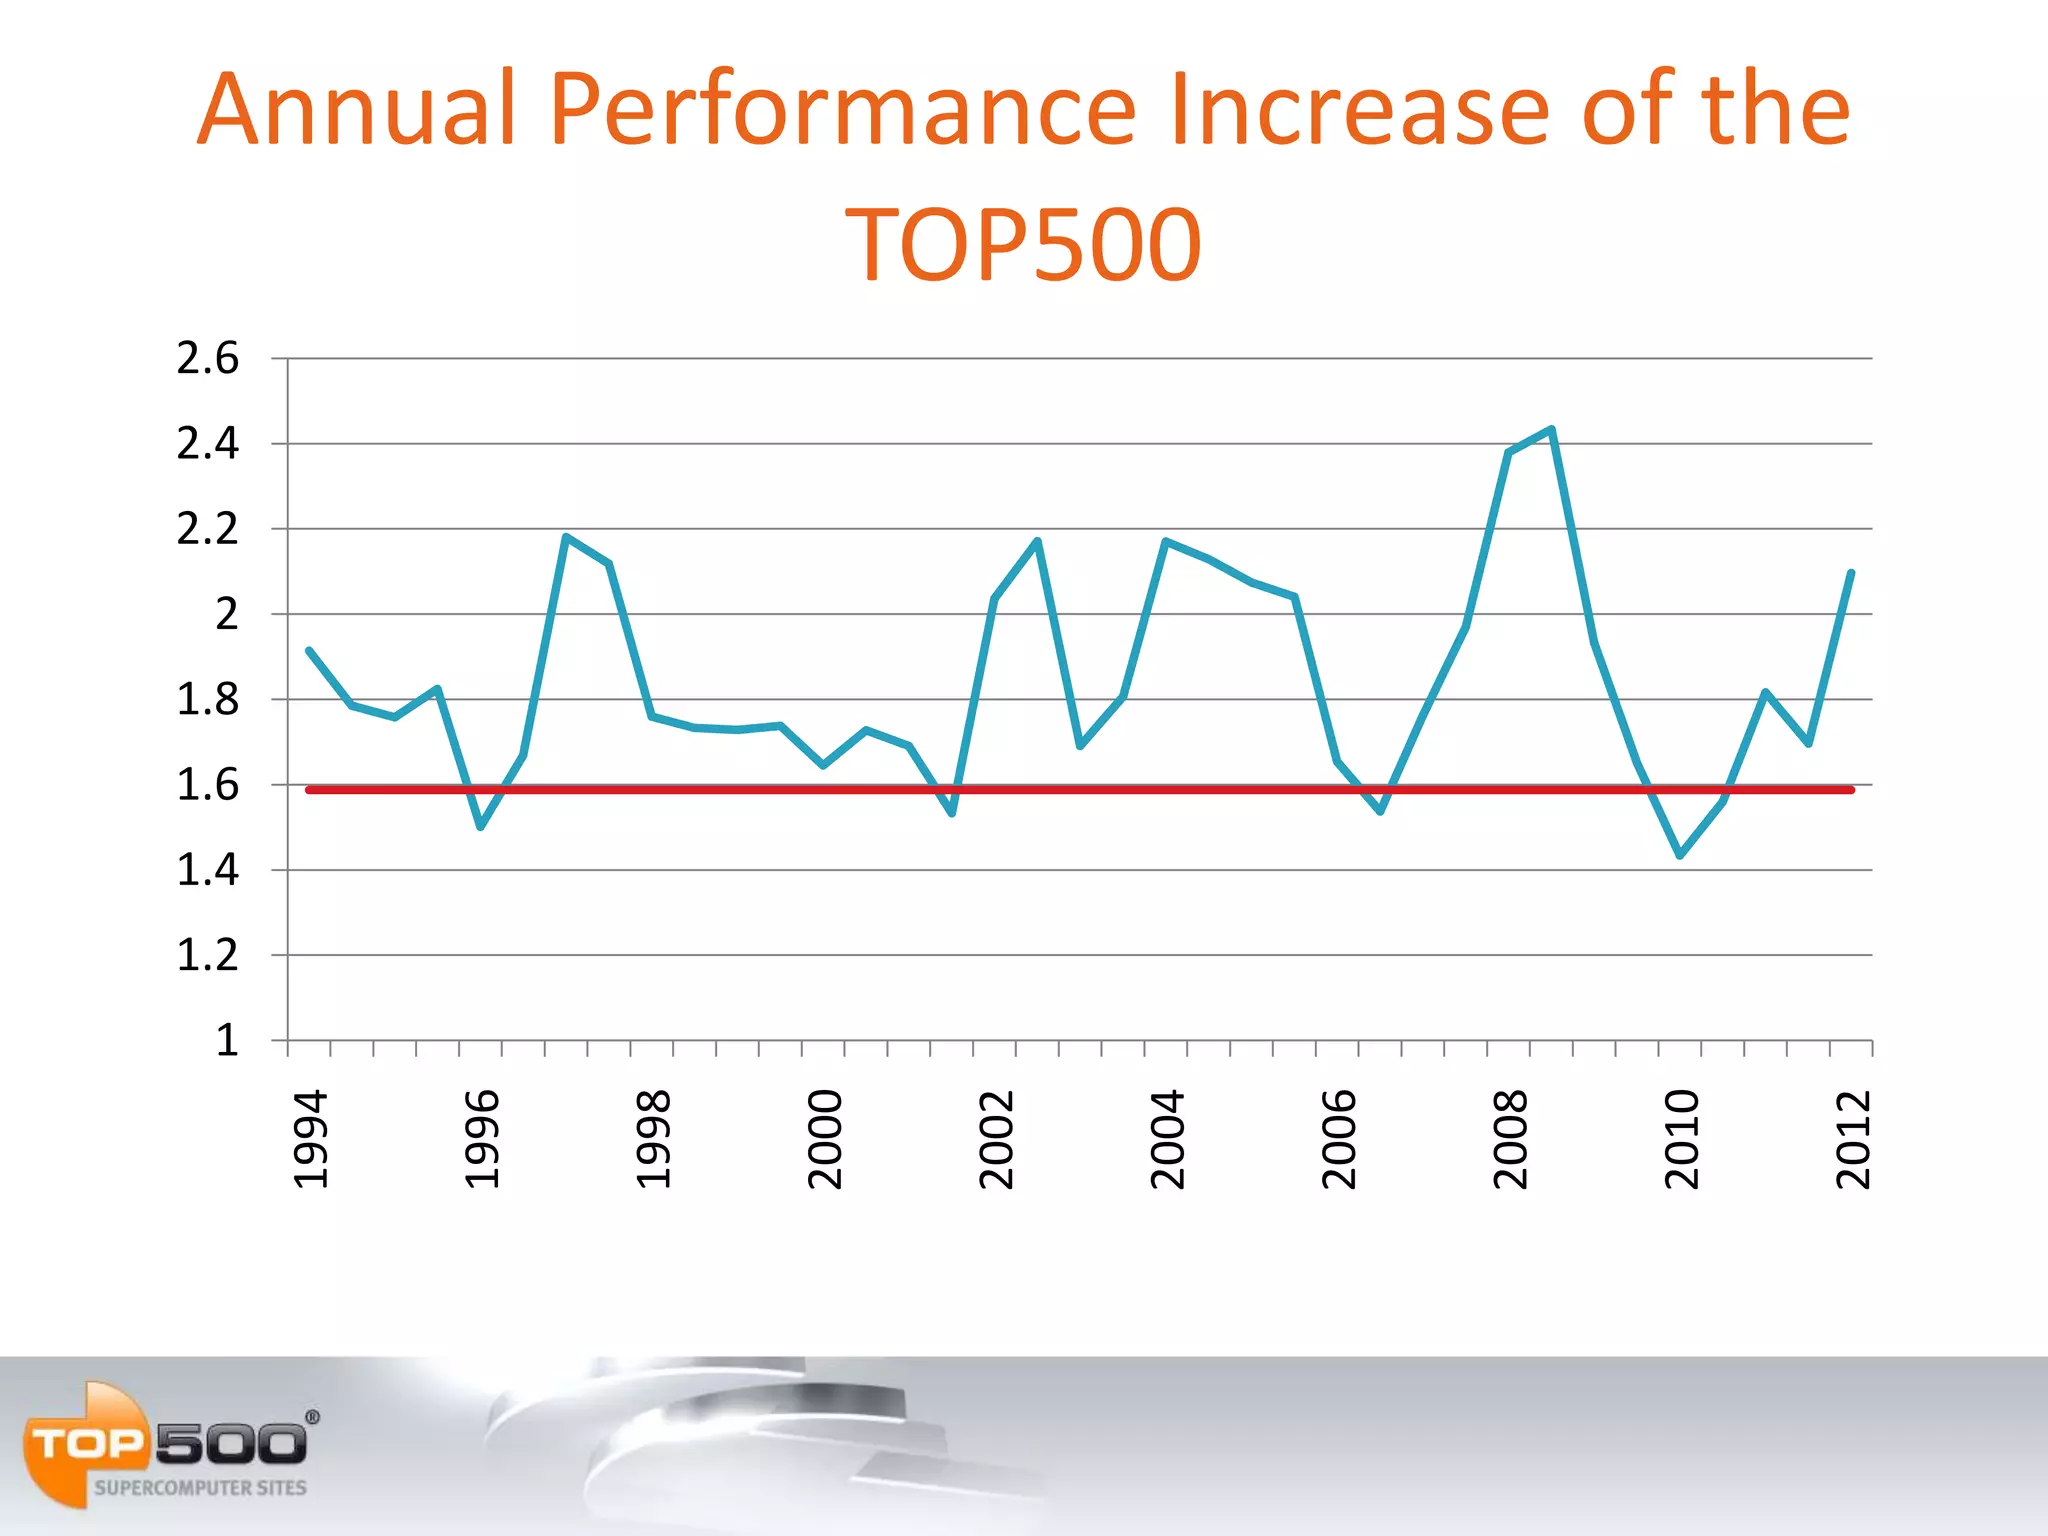
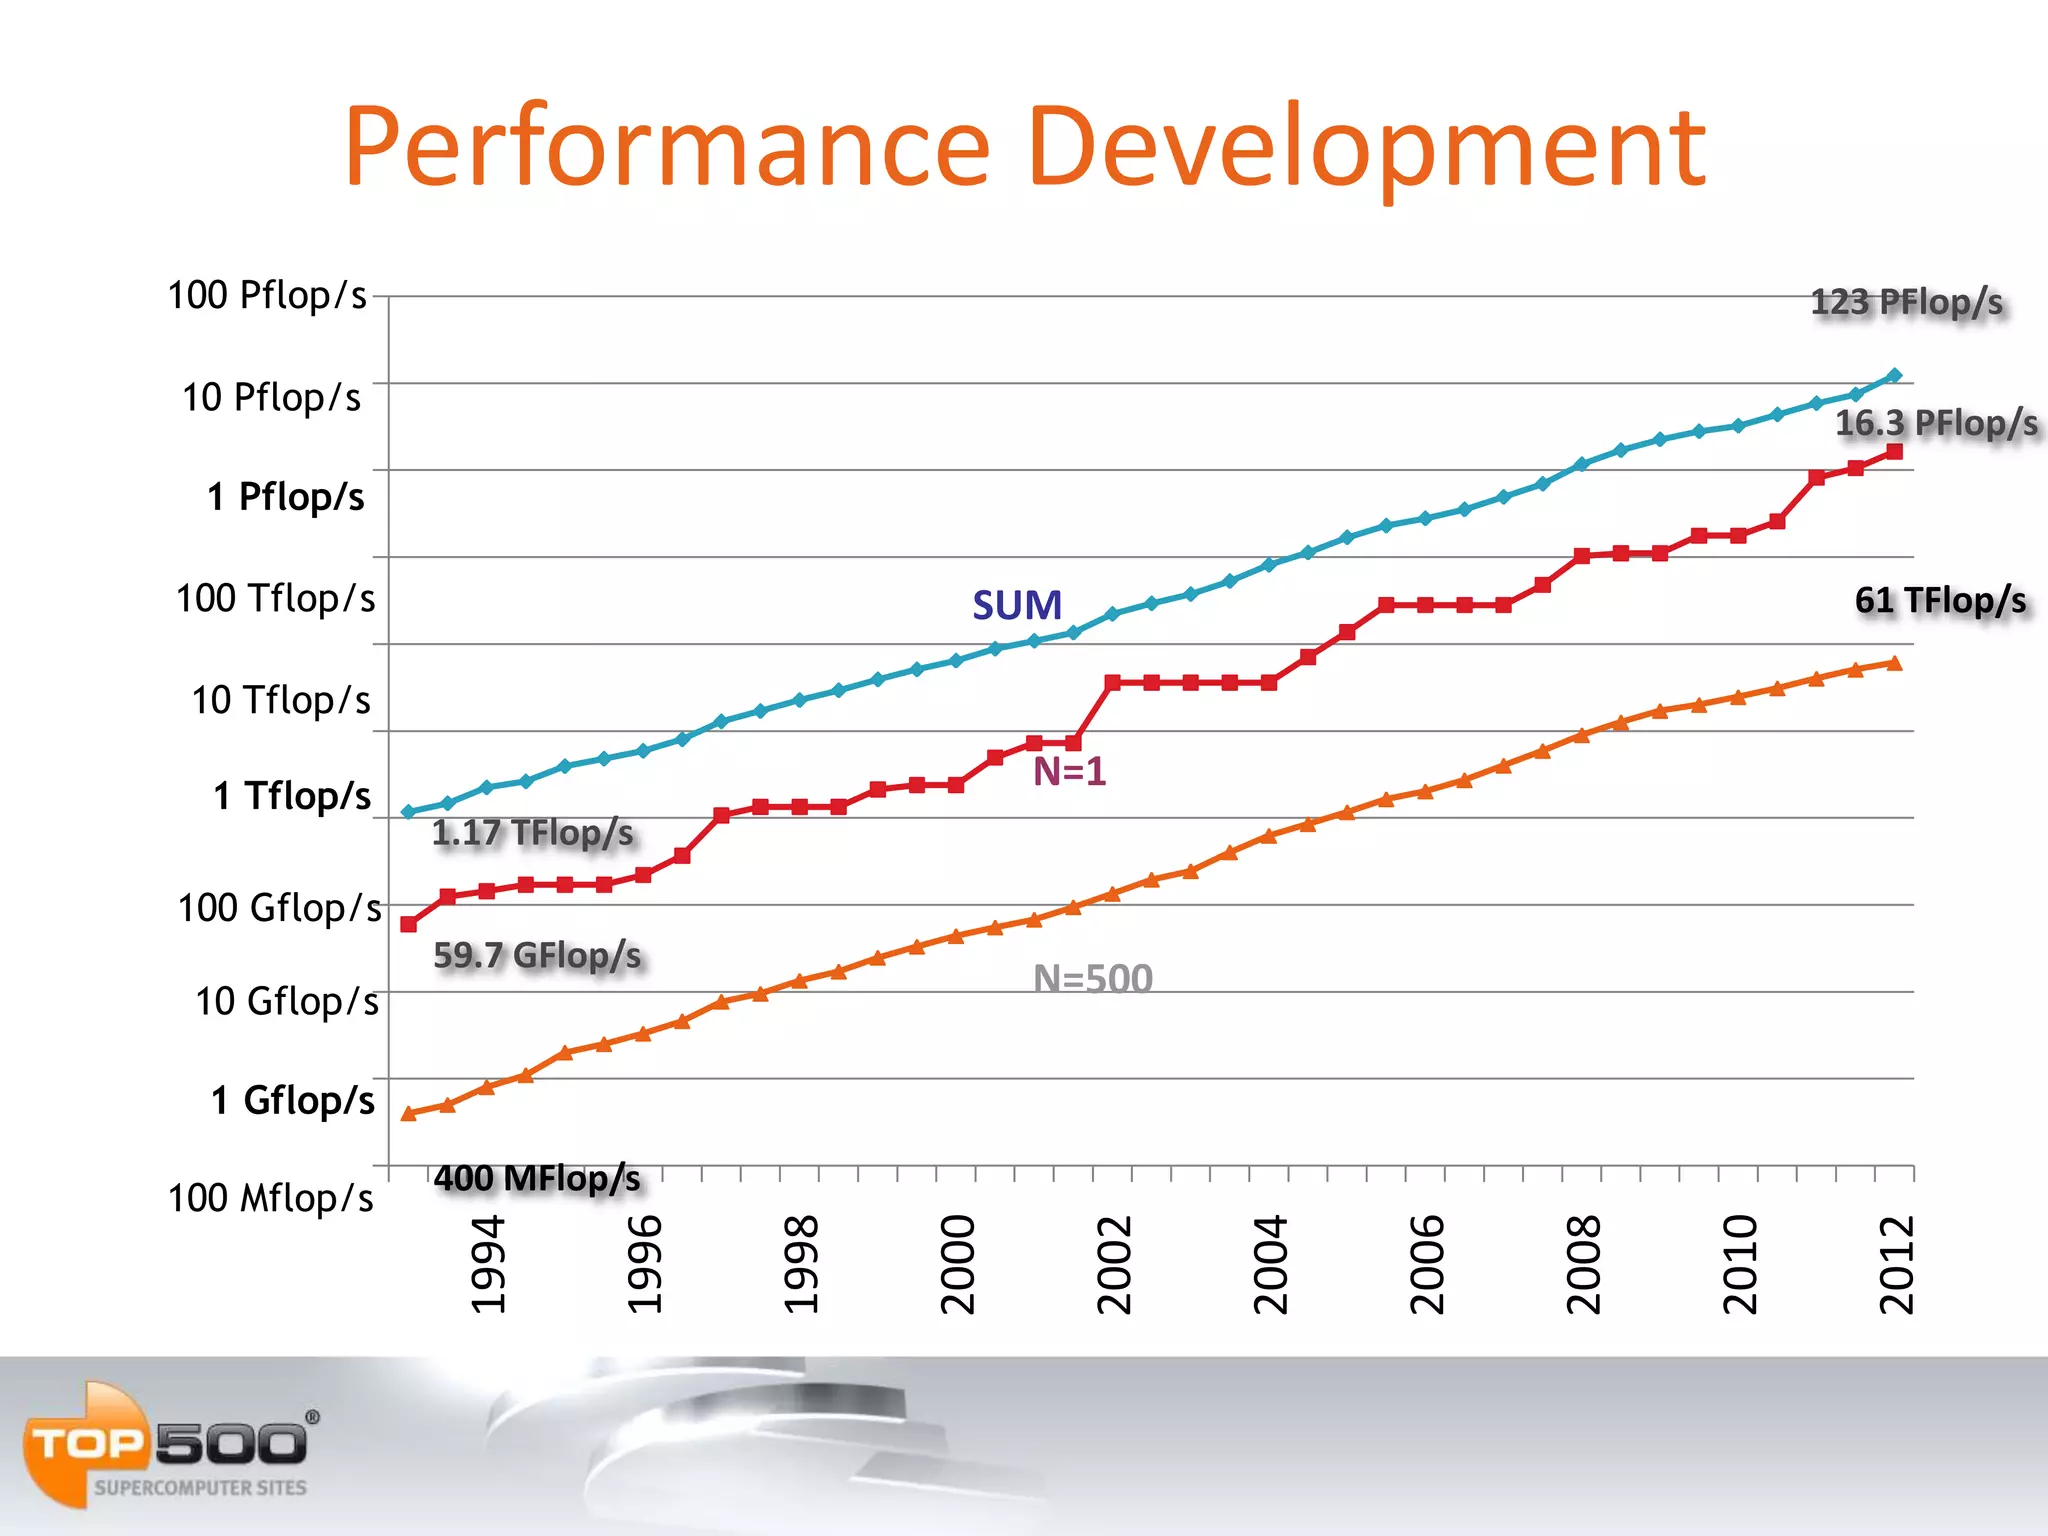
Highlights of the   39th   TOP500 List

      ISC’12, Hamburg, Germany
38th List: The TOP10 – Nov 11
                                                                                                      Rmax Power
Rank             Site             Manufacturer             Computer              Country    Cores
                                                                                                     [Pflops] [MW]
          RIKEN Advanced                                 K Computer
 1           Institute for          Fujitsu         SPARC64 VIIIfx 2.0GHz,       Japan 795,024        10.51 12.66
       Computational Science                          Tofu Interconnect
               National                                   Tianhe-1A
 2     SuperComputer Center         NUDT               NUDT TH MPP,              China 186,368        2.566 4.04
              in Tianjin                           Xeon 6C, NVidia, FT-1000 8C
         Oak Ridge National                                 Jaguar
 3                                   Cray                                         USA      224,162    1.759 6.95
             Laboratory                             Cray XT5, HC 2.6 GHz
               National                                    Nebulae
 4     Supercomputing Centre       Dawning        TC3600 Blade, Intel X5650,     China 120,640        1.271 2.58
            in Shenzhen                            NVidia Tesla C2050 GPU
                                                         TSUBAME-2
       GSIC, Tokyo Institute of
 5                                 NEC/HP        HP ProLiant, Xeon 6C, NVidia,   Japan      73,278    1.192 1.40
            Technology
                                                        Linux/Windows
                                                             Cielo
 6     DOE/NNSA/LANL/SNL             Cray                                         USA      142,272    1.110 3.98
                                                     Cray XE6, 8C 2.4 GHz
       NASA/Ames Research                                   Pleiades
 7                                    SGI                                         USA      111,104    1.088 4.10
           Center/NAS                            SGI Altix ICE 8200EX/8400EX
              DOE/SC/                                      Hopper
 8                                   Cray                                         USA      153,408    1.054 2.91
            LBNL/NERSC                              Cray XE6, 6C 2.1 GHz
           Commissariat a                                  Tera 100
 9       l'Energie Atomique          Bull           Bull bullx super-node        France 138.368       1.050 4.59
                (CEA)                                    S6010/S6030
                                                         Roadrunner
10        DOE/NNSA/LANL              IBM                                          USA      122,400    1.042 2.34
                                                   BladeCenter QS22/LS21
Rmax Power
#


1
             Site

     Lawrence Livermore
                           39th List: The TOP10
                              Manufacturer


                                 IBM
                                                         Computer
                                                         Sequoia
                                                       BlueGene/Q,
                                                                                   Country


                                                                                    USA
                                                                                              Cores   [Pflops] [MW]


                                                                                             1,572,864 16.3   7.89
     National Laboratory
                                              Power BQC 16C 1.6GHz, Custom
                                                      K Computer
   RIKEN Advanced Institute
2                               Fujitsu          SPARC64 VIIIfx 2.0GHz,             Japan     795,024 10.5 12.66
  for Computational Science
                                                   Tofu Interconnect
                                                          Mira
       Argonne National
3                                IBM                 BlueGene/Q,                    USA       786,432 8.16 3.95
          Laboratory
                                              Power BQC 16C 1.6GHz, Custom
                                                        SuperMUC
4   Leibniz Rechenzentrum        IBM               iDataPlex DX360M4,              Germany    147,456 2.90 3.52
                                             Xeon E5 8C 2.7GHz, Infiniband FDR
                                                        Tianhe-1A
    National SuperComputer
5                               NUDT                  NUDT TH MPP,                  China     186,368 2.57 4.04
        Center in Tianjin
                                                 Xeon 6C, NVidia, FT-1000 8C
                                                          Jaguar
      Oak Ridge National
6                                Cray         Cray XK6, Opteron 16C 2.2GHz,         USA       298,592 1.94 5.14
         Laboratory
                                                    Gemini, NVIDIA 2090
                                                          Fermi
7          CINECA                IBM                   BlueGene/Q,                  Italy     163,840 1.73 0.82
                                              Power BQC 16C 1.6GHz, Custom
                                                        JuQUEEN
      Forschungszentrum
8                                IBM                   BlueGene/Q,                 Germany    131,072 1.38 0.66
         Juelich (FZJ)
                                              Power BQC 16C 1.6GHz, Custom
  Commissariat a l'Energie                           Curie thin nodes
9      Atomique                  Bull                  Bullx B510,                 France      77,184 1.36 2.25
    CEA/TGCC-GENCI                           Xeon E5 8C 2.7GHz, Infiniband QDR
                                                        Nebulae
   National Supercomputing
10                            Dawning                 TC3600 Blade,                 China     120,640 1.27 2.58
     Centre in Shenzhen
                                             Intel X5650, NVidia Tesla C2050 GPU
0
           50
                100
                        150
                              200
                                    250
                                          300
                                                350
1993
1994
1995
1996
1997
1998
1999
2000
2001
2002
2003
2004
2005
2006
                                                      Replacement Rate


2007
2008
2009
2010
2011
                      170


2012
Annual Performance Increase of the
             TOP500
2.6
2.4
2.2
 2
1.8
1.6
1.4
1.2
 1
      1994


             1996


                    1998


                           2000


                                  2002


                                         2004


                                                2006


                                                       2008


                                                              2010


                                                                     2012
Performance Development
 100 Pflop/s
   1E+09                                                                             123 PFlop/s

10000000
  10 Pflop/s
                                                                                      16.3 PFlop/s
10000000
   1 Pflop/s
 1000000
  100 Tflop/s                              SUM                                         61 TFlop/s
  100000
  10 Tflop/s
    10000
                                                N=1
    1 Tflop/s
     1000       1.17 TFlop/s
       100
  100 Gflop/s
                59.7 GFlop/s
        10
   10 Gflop/s
                                                N=500

         1
   1 Gflop/s
       0.1      400 MFlop/s
 100 Mflop/s


                                                                                        2012
                  1994


                           1996


                                  1998


                                         2000


                                                  2002


                                                         2004


                                                                2006


                                                                       2008


                                                                              2010
Projected Performance Development
    1E+11
    1E+10
  11E+09
     Eflop/s
   100 Pflop/s
10000000
    10 Pflop/s
10000000
                               SUM
  1 Pflop/s
 1000000
  100000
   100 Tflop/s

    10000
    10 Tflop/s
                                N=1
     1000
  1 Tflop/s
   100 100
       Gflop/s                  N=500
        10
    10 Gflop/s
          1
  1 Gflop/s
        0.1
   100 Mflop/s


                                                      2020
                 1996


                        2002


                                        2008


                                               2014
Performance of Countries
                              100,000
                                                                                         US
                               10,000
Total Performance [Tflop/s]


                                                                                         EU
                                                                                         Japan
                                1,000
                                                                                         China
                                 100

                                  10

                                   1

                                   0
                                        2000


                                               2002


                                                      2004


                                                             2006


                                                                    2008


                                                                           2010


                                                                                  2012
Countries / System Share

                                                  United States
Canada           others                           China
  2% Italy        12%
                                                  Japan
        2%
                                  United States   United Kingdom
  Germany
                                      50%         France
    4%
    France                                        Germany
      4%                                          Canada
                  Japan                           Italy
United Kingdom      7%    China                   others
      5%                   14%
0
           20
                    40
                                       60
                                                   80
                                                                100
                                                                      120
                                                                            140
1993
1994
1995
1996
1997
1998
1999
2000
2001
2002
2003
2004
2005
2006
2007
2008
2009
                                                                                  Asian Countries


2010
2011
2012
                                               India
                                       China


                Japan
                                                       Others


                        Korea, South
European Countries
          200
          180                                                                                              Others
          160                                                                                              Poland
          140                                                                                              Russia
          120                                                                                              Spain
Systems


          100                                                                                              Sweden
          80                                                                                               Switzerland
          60                                                                                               Netherlands
                                                                                                           Italy
          40
                                                                                                           France
          20
                                                                                                           United Kingdom
           0
                                                                                                           Germany
                       2001


                                                                                                    2012
                2000


                              2002
                                     2003
                                            2004
                                                   2005
                                                          2006
                                                                 2007
                                                                        2008
                                                                               2009
                                                                                      2010
                                                                                             2011
Vendors / System Share
  Fujitsu       Others
                                     IBM
     7            46
          Oracle 9%                  HP
    1%
            7                        Cray Inc.
     Dell 1%                   IBM
Bull                           213   Appro
      12
 16                            43%
      3%                             SGI
3%
        SGI                          Bull
        16                           Dell
        3%                           Oracle
Appro
  19 Cray Inc.            HP         Fujitsu
  4%                     137         Others
           27
         6%              27%
Vendors (TOP50) / System Share
                                           IBM
                                           Cray Inc
                                           Bull SA
                 Others
                   14                IBM   Appro
                  28%                 22   Others
                                     44%


  Appro
    3                     Cray Inc
   6%                        7
       Bull SA
                            14%
         4
        8%
Processors / Systems
                           Xeon 5600-series (Westmere-EP)
      2% 1% 1%
      2%                   Xeon 5500-series (Nehalem-EP)
               5%
 3%                        Intel Xeon E5
3%
                           Opteron 6100 "Magny-Cours"
                           Power BQC
 4%
                           Xeon 5400-series "Harpertown"
4%                   49%
                           POWER7
6%                         Opteron 6200 Series "Interlagos"
                           Opteron Quad Core
      9%                   POWER6
                           PowerPC 450
             11%
                           PowerPC 440
                           others
Processors / Performance
                             Power BQC
     2% 1% 1% 1%
                             Xeon 5600 (Westmere-EP)
     3%          4%
                             Intel Xeon E5
3%
                             SPARC64 VIIIfx
                       28%
                             Opteron 6100 "Magny-Cours"
 4%
                             Xeon 5500-series (Nehalem-EP)
5%                           Opteron 6200 "Interlagos"
                             POWER7
6%
                             Xeon 5400-series "Harpertown"
                             PowerPC 450
     9%
                             Opteron Quad Core
                      22%
                             SPARC64 IXfx
           11%
                             Xeon 5500-series (Nehalem-EX)
                             Others
Cores per Socket
          500
          450
          400                                                                                16
          350                                                                                12
          300                                                                                10
Systems


          250                                                                                9
          200                                                                                8
          150                                                                                6
                                                                                             4
          100
                                                                                             2
          50
                                                                                             1
           0
                2002

                       2003

                              2004

                                     2005

                                            2006

                                                   2007

                                                          2008

                                                                 2009

                                                                        2010

                                                                               2011

                                                                                      2012
Cores per Socket

                              1 core
              76         2
                         3    2 cores
                              4 cores
235                      23
                              6 cores
                   64         8 cores
                              9 cores
                         36
                              10 cores
                    1         12 cores
                    16
                              16 cores
        108
Accelerators/ Co-Processors
          60

          50

                                                                Intel MIC
          40
                                                                Clearspeed CSX600
Systems


          30                                                    ATI GPU
                                                                IBM PowerXCell 8i
          20                                                    NVIDIA 2070
                                                                NVIDIA 2050
          10                                                    NVIDIA 2090

          0
               2006


                      2007


                             2008


                                    2009


                                           2010


                                                  2011


                                                         2012
Performance of Accelerators/Co-
                                         Processors
                              18,000
                              16,000                                                    Intel MIC
Total Performance [Tflop/s]


                              14,000                                                    Clearspeed CSX600
                              12,000                                                    ATI GPU
                                                                                        IBM PowerXCell 8i
                              10,000
                                                                                        NVIDIA 20702
                               8,000
                                                                                        NVIDIA 2090
                               6,000                                                    NVIDIA 2050
                               4,000
                               2,000
                                  0
                                                            2009
                                       2006


                                              2007


                                                     2008


                                                                   2010


                                                                          2011


                                                                                 2012
Linpack Efficiency
                     120%

                     100%
Linpack Efficiency


                     80%

                     60%

                     40%

                     20%

                      0%
                            0    100   200   300     400   500
Absolute Power Levels
                 13
                 12
                 11
                 10
Power [MWatts]


                  9
                  8
                  7
                  6
                  5
                  4
                  3
                  2
                  1
                  0
                      0     100   200         300   400   500
                                    TOP500 Rank
Power Consumption
             5
                                         TOP10
             4
Power [MW]


             3
                                             TOP50
             2

             1                               TOP500

             0
                 2008   2009   2010   2011            2012
Power Consumption
             10
              9                 TOP10
              8
              7
Power [MW]


              6
              5
              4                  TOP50
              3
              2
              1                  TOP500
              0
Power Efficiency
                            1200
Linpack/Power [Gflops/kW]


                            1000

                            800
                                                           TOP10
                            600
                                                                      TOP50
                            400

                            200                                      TOP500
                              0
                                   2008      2009   2010      2011     2012
Power Efficiency
                            2,500                                  BlueGene/Q
                                           Max-Efficiency
Linpack/Power [Gflops/kW]


                            2,000

                            1,500
                                                  Cell
                            1,000
                                                                     TOP10
                             500
                                                                                TOP50

                               0                                           TOP500
                                    2008          2009      2010    2011        2012
Most Power Efficient Architectures
                                                                     Rmax/
                             Computer
                                                                     Power
BlueGene/Q, Power BQC 16C 1.60 GHz, Custom                            2,214
Bullx B505, Xeon E5649 6C 2.53GHz, Infiniband QDR, NVIDIA 2090        1,266
Intel Cluster, Xeon E5-2670 8C 2.600GHz, Infiniband FDR, Intel MIC    1,177
Xtreme-X , Xeon E5-2670 8C 2.600GHz, Infiniband QDR, NVIDIA 2090      1,050
SuperServer 2026GT-TRF, Xeon E5645 6C 2.40GHz, Infiniband QDR,
                                                                        954
NVIDIA 2050
iDataPlex DX360M4, Xeon E5-2670 8C 2.600GHz, Infiniband FDR             933
Mole-8.5 Cluster, Xeon X5520 4C 2.27 GHz, Infiniband QDR, NVIDIA
                                                                        919
2050
HP ProLiant SL390s G7 Xeon 6C X5660 2.8Ghz, nVidia Fermi,
                                                                        902
Infiniband QDR
PRIMEHPC FX10, SPARC64 IXfx 16C 1.848GHz, Tofu interconnect             886


                                                               [Mflops/Watt]

Top500 List June 2012

  • 1.
    Highlights of the 39th TOP500 List ISC’12, Hamburg, Germany
  • 2.
    38th List: TheTOP10 – Nov 11 Rmax Power Rank Site Manufacturer Computer Country Cores [Pflops] [MW] RIKEN Advanced K Computer 1 Institute for Fujitsu SPARC64 VIIIfx 2.0GHz, Japan 795,024 10.51 12.66 Computational Science Tofu Interconnect National Tianhe-1A 2 SuperComputer Center NUDT NUDT TH MPP, China 186,368 2.566 4.04 in Tianjin Xeon 6C, NVidia, FT-1000 8C Oak Ridge National Jaguar 3 Cray USA 224,162 1.759 6.95 Laboratory Cray XT5, HC 2.6 GHz National Nebulae 4 Supercomputing Centre Dawning TC3600 Blade, Intel X5650, China 120,640 1.271 2.58 in Shenzhen NVidia Tesla C2050 GPU TSUBAME-2 GSIC, Tokyo Institute of 5 NEC/HP HP ProLiant, Xeon 6C, NVidia, Japan 73,278 1.192 1.40 Technology Linux/Windows Cielo 6 DOE/NNSA/LANL/SNL Cray USA 142,272 1.110 3.98 Cray XE6, 8C 2.4 GHz NASA/Ames Research Pleiades 7 SGI USA 111,104 1.088 4.10 Center/NAS SGI Altix ICE 8200EX/8400EX DOE/SC/ Hopper 8 Cray USA 153,408 1.054 2.91 LBNL/NERSC Cray XE6, 6C 2.1 GHz Commissariat a Tera 100 9 l'Energie Atomique Bull Bull bullx super-node France 138.368 1.050 4.59 (CEA) S6010/S6030 Roadrunner 10 DOE/NNSA/LANL IBM USA 122,400 1.042 2.34 BladeCenter QS22/LS21
  • 3.
    Rmax Power # 1 Site Lawrence Livermore 39th List: The TOP10 Manufacturer IBM Computer Sequoia BlueGene/Q, Country USA Cores [Pflops] [MW] 1,572,864 16.3 7.89 National Laboratory Power BQC 16C 1.6GHz, Custom K Computer RIKEN Advanced Institute 2 Fujitsu SPARC64 VIIIfx 2.0GHz, Japan 795,024 10.5 12.66 for Computational Science Tofu Interconnect Mira Argonne National 3 IBM BlueGene/Q, USA 786,432 8.16 3.95 Laboratory Power BQC 16C 1.6GHz, Custom SuperMUC 4 Leibniz Rechenzentrum IBM iDataPlex DX360M4, Germany 147,456 2.90 3.52 Xeon E5 8C 2.7GHz, Infiniband FDR Tianhe-1A National SuperComputer 5 NUDT NUDT TH MPP, China 186,368 2.57 4.04 Center in Tianjin Xeon 6C, NVidia, FT-1000 8C Jaguar Oak Ridge National 6 Cray Cray XK6, Opteron 16C 2.2GHz, USA 298,592 1.94 5.14 Laboratory Gemini, NVIDIA 2090 Fermi 7 CINECA IBM BlueGene/Q, Italy 163,840 1.73 0.82 Power BQC 16C 1.6GHz, Custom JuQUEEN Forschungszentrum 8 IBM BlueGene/Q, Germany 131,072 1.38 0.66 Juelich (FZJ) Power BQC 16C 1.6GHz, Custom Commissariat a l'Energie Curie thin nodes 9 Atomique Bull Bullx B510, France 77,184 1.36 2.25 CEA/TGCC-GENCI Xeon E5 8C 2.7GHz, Infiniband QDR Nebulae National Supercomputing 10 Dawning TC3600 Blade, China 120,640 1.27 2.58 Centre in Shenzhen Intel X5650, NVidia Tesla C2050 GPU
  • 4.
    0 50 100 150 200 250 300 350 1993 1994 1995 1996 1997 1998 1999 2000 2001 2002 2003 2004 2005 2006 Replacement Rate 2007 2008 2009 2010 2011 170 2012
  • 5.
    Annual Performance Increaseof the TOP500 2.6 2.4 2.2 2 1.8 1.6 1.4 1.2 1 1994 1996 1998 2000 2002 2004 2006 2008 2010 2012
  • 7.
    Performance Development 100Pflop/s 1E+09 123 PFlop/s 10000000 10 Pflop/s 16.3 PFlop/s 10000000 1 Pflop/s 1000000 100 Tflop/s SUM 61 TFlop/s 100000 10 Tflop/s 10000 N=1 1 Tflop/s 1000 1.17 TFlop/s 100 100 Gflop/s 59.7 GFlop/s 10 10 Gflop/s N=500 1 1 Gflop/s 0.1 400 MFlop/s 100 Mflop/s 2012 1994 1996 1998 2000 2002 2004 2006 2008 2010
  • 8.
    Projected Performance Development 1E+11 1E+10 11E+09 Eflop/s 100 Pflop/s 10000000 10 Pflop/s 10000000 SUM 1 Pflop/s 1000000 100000 100 Tflop/s 10000 10 Tflop/s N=1 1000 1 Tflop/s 100 100 Gflop/s N=500 10 10 Gflop/s 1 1 Gflop/s 0.1 100 Mflop/s 2020 1996 2002 2008 2014
  • 9.
    Performance of Countries 100,000 US 10,000 Total Performance [Tflop/s] EU Japan 1,000 China 100 10 1 0 2000 2002 2004 2006 2008 2010 2012
  • 10.
    Countries / SystemShare United States Canada others China 2% Italy 12% Japan 2% United States United Kingdom Germany 50% France 4% France Germany 4% Canada Japan Italy United Kingdom 7% China others 5% 14%
  • 11.
    0 20 40 60 80 100 120 140 1993 1994 1995 1996 1997 1998 1999 2000 2001 2002 2003 2004 2005 2006 2007 2008 2009 Asian Countries 2010 2011 2012 India China Japan Others Korea, South
  • 12.
    European Countries 200 180 Others 160 Poland 140 Russia 120 Spain Systems 100 Sweden 80 Switzerland 60 Netherlands Italy 40 France 20 United Kingdom 0 Germany 2001 2012 2000 2002 2003 2004 2005 2006 2007 2008 2009 2010 2011
  • 13.
    Vendors / SystemShare Fujitsu Others IBM 7 46 Oracle 9% HP 1% 7 Cray Inc. Dell 1% IBM Bull 213 Appro 12 16 43% 3% SGI 3% SGI Bull 16 Dell 3% Oracle Appro 19 Cray Inc. HP Fujitsu 4% 137 Others 27 6% 27%
  • 14.
    Vendors (TOP50) /System Share IBM Cray Inc Bull SA Others 14 IBM Appro 28% 22 Others 44% Appro 3 Cray Inc 6% 7 Bull SA 14% 4 8%
  • 15.
    Processors / Systems Xeon 5600-series (Westmere-EP) 2% 1% 1% 2% Xeon 5500-series (Nehalem-EP) 5% 3% Intel Xeon E5 3% Opteron 6100 "Magny-Cours" Power BQC 4% Xeon 5400-series "Harpertown" 4% 49% POWER7 6% Opteron 6200 Series "Interlagos" Opteron Quad Core 9% POWER6 PowerPC 450 11% PowerPC 440 others
  • 16.
    Processors / Performance Power BQC 2% 1% 1% 1% Xeon 5600 (Westmere-EP) 3% 4% Intel Xeon E5 3% SPARC64 VIIIfx 28% Opteron 6100 "Magny-Cours" 4% Xeon 5500-series (Nehalem-EP) 5% Opteron 6200 "Interlagos" POWER7 6% Xeon 5400-series "Harpertown" PowerPC 450 9% Opteron Quad Core 22% SPARC64 IXfx 11% Xeon 5500-series (Nehalem-EX) Others
  • 17.
    Cores per Socket 500 450 400 16 350 12 300 10 Systems 250 9 200 8 150 6 4 100 2 50 1 0 2002 2003 2004 2005 2006 2007 2008 2009 2010 2011 2012
  • 18.
    Cores per Socket 1 core 76 2 3 2 cores 4 cores 235 23 6 cores 64 8 cores 9 cores 36 10 cores 1 12 cores 16 16 cores 108
  • 19.
    Accelerators/ Co-Processors 60 50 Intel MIC 40 Clearspeed CSX600 Systems 30 ATI GPU IBM PowerXCell 8i 20 NVIDIA 2070 NVIDIA 2050 10 NVIDIA 2090 0 2006 2007 2008 2009 2010 2011 2012
  • 20.
    Performance of Accelerators/Co- Processors 18,000 16,000 Intel MIC Total Performance [Tflop/s] 14,000 Clearspeed CSX600 12,000 ATI GPU IBM PowerXCell 8i 10,000 NVIDIA 20702 8,000 NVIDIA 2090 6,000 NVIDIA 2050 4,000 2,000 0 2009 2006 2007 2008 2010 2011 2012
  • 21.
    Linpack Efficiency 120% 100% Linpack Efficiency 80% 60% 40% 20% 0% 0 100 200 300 400 500
  • 22.
    Absolute Power Levels 13 12 11 10 Power [MWatts] 9 8 7 6 5 4 3 2 1 0 0 100 200 300 400 500 TOP500 Rank
  • 23.
    Power Consumption 5 TOP10 4 Power [MW] 3 TOP50 2 1 TOP500 0 2008 2009 2010 2011 2012
  • 24.
    Power Consumption 10 9 TOP10 8 7 Power [MW] 6 5 4 TOP50 3 2 1 TOP500 0
  • 25.
    Power Efficiency 1200 Linpack/Power [Gflops/kW] 1000 800 TOP10 600 TOP50 400 200 TOP500 0 2008 2009 2010 2011 2012
  • 26.
    Power Efficiency 2,500 BlueGene/Q Max-Efficiency Linpack/Power [Gflops/kW] 2,000 1,500 Cell 1,000 TOP10 500 TOP50 0 TOP500 2008 2009 2010 2011 2012
  • 27.
    Most Power EfficientArchitectures Rmax/ Computer Power BlueGene/Q, Power BQC 16C 1.60 GHz, Custom 2,214 Bullx B505, Xeon E5649 6C 2.53GHz, Infiniband QDR, NVIDIA 2090 1,266 Intel Cluster, Xeon E5-2670 8C 2.600GHz, Infiniband FDR, Intel MIC 1,177 Xtreme-X , Xeon E5-2670 8C 2.600GHz, Infiniband QDR, NVIDIA 2090 1,050 SuperServer 2026GT-TRF, Xeon E5645 6C 2.40GHz, Infiniband QDR, 954 NVIDIA 2050 iDataPlex DX360M4, Xeon E5-2670 8C 2.600GHz, Infiniband FDR 933 Mole-8.5 Cluster, Xeon X5520 4C 2.27 GHz, Infiniband QDR, NVIDIA 919 2050 HP ProLiant SL390s G7 Xeon 6C X5660 2.8Ghz, nVidia Fermi, 902 Infiniband QDR PRIMEHPC FX10, SPARC64 IXfx 16C 1.848GHz, Tofu interconnect 886 [Mflops/Watt]

Editor's Notes

  • #6 Annual versus Moore’s Law1.85 versus 1.59
  • #15 Fujitsu, Dell, and Dawning have 2 each
  • #22 Some very high efficiency systems use TurboBoost – wrong peak!
  • #23 #123 is ASCI Purple = older technology = less power efficient
  • #27 K computer: "K" here draws upon the Japanese word "Kei" for 1016(ten quadrillions), representing the system's performance goal of 10 petaflops. In its original sense, "Kei" expresses a large gateway in Japanese, and it is hoped that the system will be a new gateway to computational science.