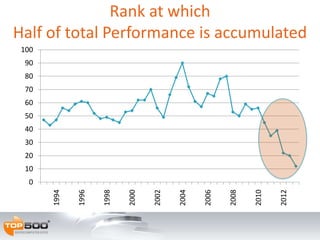
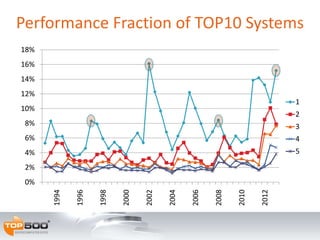
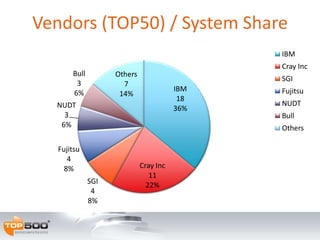
The document summarizes highlights from the 41st TOP500 list of the most powerful supercomputers in the world. It shows that China's Tianhe-2 held the top spot, providing over 33 petaflops of performance while consuming 17.8 megawatts of power. The US held over half of the total systems on the list and over half of the total performance. Power consumption of the TOP500 systems increased significantly from 2008 to 2013 while power efficiency also rose considerably over that period.
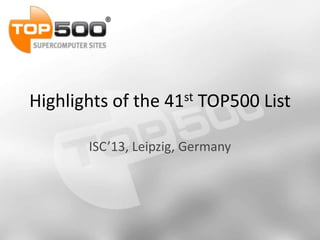

![41st List: The TOP10# Site Manufacturer Computer Country Cores Rmax
[Pflops]
Power
[MW]
1
National University of
Defense Technology
NUDT
Tianhe-2
NUDT TH-IVB-FEP,
Xeon 12C 2.2GHz, IntelXeon Phi
China 3,120,000 33.9 17.8
2
Oak Ridge National
Laboratory
Cray
Titan
Cray XK7, Opteron 16C 2.2GHz,
Gemini, NVIDIA K20x
USA 560,640 17.6 8.21
3
Lawrence Livermore
National Laboratory
IBM
Sequoia
BlueGene/Q,
Power BQC 16C 1.6GHz, Custom
USA 1,572,864 17.2 7.89
4
RIKEN Advanced Institute
for Computational Science
Fujitsu
K Computer
SPARC64 VIIIfx 2.0GHz,
Tofu Interconnect
Japan 795,024 10.5 12.7
5
Argonne National
Laboratory
IBM
Mira
BlueGene/Q,
Power BQC 16C 1.6GHz, Custom
USA 786,432 8.59 3.95
6
Texas Advanced
Computing Center/UT
Dell
Stampede
PowerEdge C8220,
Xeon E5 8C 2.7GHz, Intel Xeon Phi
USA 462,462 5.17 4.51
7
Forschungszentrum
Juelich (FZJ)
IBM
JuQUEEN
BlueGene/Q,
Power BQC 16C 1.6GHz, Custom
Germany 458,752 5.01 2.30
8
Lawrence Livermore
National Laboratory
IBM
Vulcan
BlueGene/Q,
Power BQC 16C 1.6GHz, Custom
USA 393,216 4.29 1.97
9 Leibniz Rechenzentrum IBM
SuperMUC
iDataPlex DX360M4,
Xeon E5 8C 2.7GHz, Infiniband FDR
Germany 147,456 2.90 3.52
10
National SuperComputer
Center in Tianjin
NUDT
Tianhe-1A
NUDT TH MPP,
Xeon 6C, NVidia, FT-1000 8C
China 186,368 2.57 4.04](https://image.slidesharecdn.com/top500jun2013export-130618165135-phpapp02/85/Top500-June-2013-2-320.jpg)
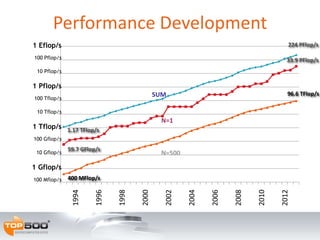
![Performance of Accelerators
0
10
20
30
40
50
60
70
80
2006
2007
2008
2009
2010
2011
2012
2013
TotalPerformance[Pflop/s]
Clearspeed
ATI Radeon
IBM Cell
Intel Xeon Phi
Nvidia Fermi
Nvidia Kepler](https://image.slidesharecdn.com/top500jun2013export-130618165135-phpapp02/85/Top500-June-2013-8-320.jpg)
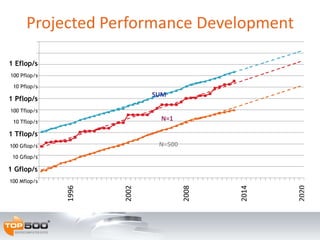
![Performance of Countries
0
1
10
100
1,000
10,000
100,000
2000
2002
2004
2006
2008
2010
2012
TotalPerformance[Tflop/s]
US
EU
Japan
China](https://image.slidesharecdn.com/top500jun2013export-130618165135-phpapp02/85/Top500-June-2013-14-320.jpg)
![0.01
0.1
1
10
0 100 200 300 400 500
Power[MWatts]
TOP500 Rank
Absolute Power Levels](https://image.slidesharecdn.com/top500jun2013export-130618165135-phpapp02/85/Top500-June-2013-18-320.jpg)
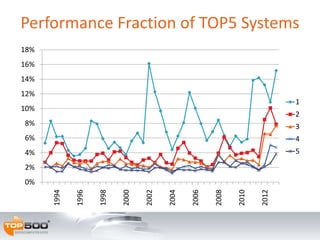
![Power Consumption
0
1
2
3
4
5
6
7
8
2008 2009 2010 2011 2012 2013
Power[MW]
TOP10
TOP50
TOP500
3.25 x in 5 y
3.13 x in 5 y
5.04 x in 5 y](https://image.slidesharecdn.com/top500jun2013export-130618165135-phpapp02/85/Top500-June-2013-19-320.jpg)
![Power Consumption
0
1
2
3
4
5
6
7
8
9
10
11
12
13
14
Power[MW]
TOP10
TOP50
TOP500](https://image.slidesharecdn.com/top500jun2013export-130618165135-phpapp02/85/Top500-June-2013-20-320.jpg)
![Power Consumption
0.1
1
10
100
Power[MW]
TOP10
TOP50
TOP500](https://image.slidesharecdn.com/top500jun2013export-130618165135-phpapp02/85/Top500-June-2013-21-320.jpg)
![Power Efficiency
0
200
400
600
800
1,000
1,200
1,400
1,600
1,800
2008 2009 2010 2011 2012 2013
Linpack/Power[Gflops/kW]
TOP10
TOP50
TOP500](https://image.slidesharecdn.com/top500jun2013export-130618165135-phpapp02/85/Top500-June-2013-22-320.jpg)
![Power Efficiency
0
500
1,000
1,500
2,000
2,500
3,000
3,500
2008 2009 2010 2011 2012 2013
Linpack/Power[Gflops/kW]
TOP10
TOP50
TOP500
Max-Efficiency
BlueGene/Q
Cell
Intel Mic
AMD FirePro](https://image.slidesharecdn.com/top500jun2013export-130618165135-phpapp02/85/Top500-June-2013-23-320.jpg)
![Most Power Efficient Architectures
Computer
Rmax/
Power
Adtech, ASUS, Xeon 8C 2.0GHz, Infiniband FDR, AMD FirePro 2,973
Appro GreenBlade, Xeon 8C 2.6GHz, Infiniband FDR, Intel Xeon Phi 2,450
BlueGene/Q, Power BQC 16C 1.60 GHz, Custom 2,300
Cray XK7, Opteron 16C 2.1GHz, Gemini, NVIDIA Kepler 2,243
Eurotech Aurora HPC, Xeon 8C 3.1GHz, Infiniband QDR, NVIDIA K20 2,193
iDataPlex DX360M4, Xeon 8C 2.6GHz, Infiniband QDR, Intel Xeon Phi 1,935
Tianhe-2, NUDT, Intel Xeon 6C 2.2GHz, TH Express-2, Intel Xeon Phi 1,902
RSC Tornado, Xeon 8C 2.9GHz, Infiniband FDR, Intel Xeon Phi 1,687
SGI Rackable, Xeon 8C 2.6GHz, Infiniband FDR, Intel Xeon Phi 1,613
Chundoong Cluster, Xeon 8C 2GHz, Infiniband QDR, AMD Radeon HD 1,467
[Mflops/Watt]](https://image.slidesharecdn.com/top500jun2013export-130618165135-phpapp02/85/Top500-June-2013-24-320.jpg)


![[IGC2018] AMD Don Woligroski - WHY Ryzen](https://cdn.slidesharecdn.com/ss_thumbnails/igc2018amddonwoligroski-whyryzen-181023014303-thumbnail.jpg?width=640&height=640&fit=bounds)


![Getting Started with Apache Spark: Big Data Made Simple [Free Meetup]](https://cdn.slidesharecdn.com/ss_thumbnails/apachesparkgettingstarted-260203175547-8361bcc3-thumbnail.jpg?width=640&height=640&fit=bounds)


