
Recommended
Recommended
More Related Content
What's hot
What's hot (20)
Viewers also liked
Viewers also liked (11)
Similar to Top 5 West African (WAF) power markets - 2014
Similar to Top 5 West African (WAF) power markets - 2014 (20)
Recently uploaded
Recently uploaded (20)
Top 5 West African (WAF) power markets - 2014
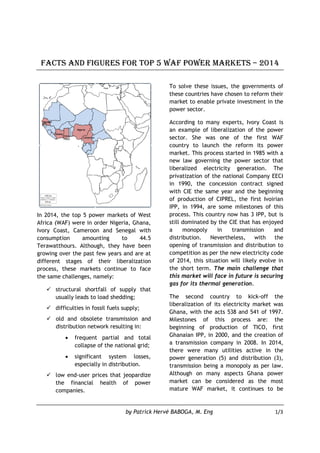
- 1. by Patrick Hervé BABOGA, M. Eng 1/3 FACTS AND FIGURES FOR TOP 5 WAF POWER MARKETS – 2014 In 2014, the top 5 power markets of West Africa (WAF) were in order Nigeria, Ghana, Ivory Coast, Cameroon and Senegal with consumption amounting to 44.5 Terawatthours. Although, they have been growing over the past few years and are at different stages of their liberalization process, these markets continue to face the same challenges, namely: structural shortfall of supply that usually leads to load shedding; difficulties in fossil fuels supply; old and obsolete transmission and distribution network resulting in: frequent partial and total collapse of the national grid; significant system losses, especially in distribution. low end-user prices that jeopardize the financial health of power companies. To solve these issues, the governments of these countries have chosen to reform their market to enable private investment in the power sector. According to many experts, Ivory Coast is an example of liberalization of the power sector. She was one of the first WAF country to launch the reform its power market. This process started in 1985 with a new law governing the power sector that liberalized electricity generation. The privatization of the national Company EECI in 1990, the concession contract signed with CIE the same year and the beginning of production of CIPREL, the first Ivoirian IPP, in 1994, are some milestones of this process. This country now has 3 IPP, but is still dominated by the CIE that has enjoyed a monopoly in transmission and distribution. Nevertheless, with the opening of transmission and distribution to competition as per the new electricity code of 2014, this situation will likely evolve in the short term. The main challenge that this market will face in future is securing gas for its thermal generation. The second country to kick-off the liberalization of its electricity market was Ghana, with the acts 538 and 541 of 1997. Milestones of this process are: the beginning of production of TICO, first Ghanaian IPP, in 2000, and the creation of a transmission company in 2008. In 2014, there were many utilities active in the power generation (5) and distribution (3), transmission being a monopoly as per law. Although on many aspects Ghana power market can be considered as the most mature WAF market, it continues to be
- 2. by Patrick Hervé BABOGA, M. Eng 2/3 dominated by state-owned companies, namely VRA, BPA, GRIDCO, ECG and NEDCO. The main challenge of the Ghanaian power market for the foreseeable future will be the setting of appropriate end-user tariffs that will reestablish financial health of the sector without jeopardizing demand. Senegal was the third of the top 5 WAF markets to start the reorganization of its power sector with a law published in 1998. This process led to a privatization agreement in 1999 that was cancelled 2000 and to date SENELEC is still a state-owned company. Despite this unsuccessful privatization, IPP started production as early as 1999, with commissioning of the GTI Dakar Plant. Senegal had in 2014, two independent power producers, two dedicated capacity in Malian hydro dams and is leasing additional engines to meet its domestics needs. SENELEC remains the dominant player of this market and is active in the generation, transmission and distribution. The main challenge that this market will face in future is the access to cheap primary resource or electricity (Banda Gas project and the FSRU project are interesting alternatives). The fourth market to take a step in the liberalization process in the WAF Zone was Cameroon with the electricity code of 1998 and the sell-out in 2001, of 56 % interest in National Company SONEL, by the State. Some milestones of this process are: the beginning of production of DPDC, first private utility in 2009 and the commissioning in 2013 of the biggest generation capacity to come online for more than 30 years (the 216 MW Kribi plant). Although having two IPP, Cameroonian electricity market continues to be dominated by ENEO the successor of SONEL that has enjoyed monopoly in transmission and distribution and also operates hydro and thermal plants. This monopoly was ended with the new electricity code of 2011 and the creation of a transmission company in 2015. Given the important generation capacity under construction, the main challenge of this market will be to develop and upgrade the grid (merge the three existing network). The poor performance of its electricity market has obliged Nigeria to start liberalization of this sector with the granting of express approvals to some companies. This approach resulted in the commissioning of AES Barge in 2001, the first Nigerian IPP, and of the Agip Okpai plant in 2005. In parallel, Nigeria kicked-off the revision of its regulation, to stimulate private financing. This led to the enactment in 2005 of the Electric Power Sector Reform. The main achievement of this reform occurred in 2013 with the creation of 5 power generation companies, one transmission company and 11 distribution companies, all successors of the Power Holding Company of Nigeria. This reform has also enabled the arrival of many additional IPP since 2005. Thus, Nigeria had at the end of the year 2014, more than 30 utilities and was the biggest WAF market. In the coming years, this market will face two main challenges: reducing transmission and distribution losses (46 % in 2014) and setting the appropriate electricity tariffs. The following factsheet highlights facts and figures on these markets for 2014.
- 3. Rank County Main indicators Production Transmission Ditribution Consumption Comments 1 Nigeria Population : 177,500,000 GDP (MUSD) : 568,500 Area : 923,768 km 2 Installed Capacity : 11.732 GW Available capacity : 7.485 GW Net production : 29,244 GWh Load Factor : 28.5 % Fuel : Natural gas, hydro Utilities : 22 producing utilities (PHCN succesors, IPP, NIPP, IOC) Peak load 4.144 GW Network length : 15,022 km Lines type : 330/132 kV losses : 9.7 % Number of networks : 1 Operator : TCN (State owned) 9 collapses of the grid Lines length : 356,363 km MV : 33/11 kV LV: 415/220 V 18 % of netwok losses + 28 % of collection losses Operators : 11 distribution companies Consumption : 21,654 GWh Number of subscribers : 8,645,000 Consumption per capita : 126 kWh Average end-user price : 144.60 USD/MWh Electricity access 45 % PHCN historical power company was privatized in 2013 Second Multi-Year Tarrif Order (MYTO 2) is under implentation and tariffs are more cost reflective Regulatory agencies : NERC, ECN Unavailability of gas, water shortages and grid constraints affects power generation and transmission Exports power to Togo, Benin and Niger Gas cost : 3.3 USD/MMBTU 2 Ghana Population : 26,790,000 GDP (MUSD) : 38,620 Area : 238,535 km 2 Installed Capacity : 2.830 GW Net production : 12,963 GWh Load factor 52.3 % Fuel : Hydro, natural gas, light crude oil (LCO), solar Utilities : VRA, BPA (State owned) TICO, CEL, SAPP, (IPP) Peak load 2.061 GW Network length : 4,450 km Lines type : 330/225/161/65 kV Losses : 4.3 % Number of networks : 1 Operator : GRIDCO (State Owned) Lines length : 91,382 km MV : 34,5/33/30/20/11 kV LV: 415/220 V losses : 25.2 % Operators : ECG, NEDCO (State Owned) and EPC (Private owned) Consumption : 10,182 GWh Number of subscribers : 2,658,602 1 Consumption per capita : 380 kWh Average end-user price : 158.07 USD/MWh Electricity access 80 % SAIDI : 215/106 hrs per customer 1 SAIFI : 135 per customer 1 IPP generation started in 2000 (commissioning of TICO) Automatic Adjustment Formula (AAF) is under implementation and tariffs are more cost reflective Regulatory agencies : PURC, EC Poor performance of the WAGP has obliged Ghana to rely on LCO for thermal production Exports power to Togo, Benin and Burkina Gas cost : 8.7 USD/MMBTU LCO cost : 110.2 USD/bbl 3 Ivory Coast Population : 22,160,000 GDP (MUSD) : 34,250 Area : 322,463 km 2 Installed Capacity : 1.632 GW Net production : 8,152 GWh Load factor 57.0 % Fuel : Natural gas, Hydro, fuel-oil, diesel Utilities : CIE (15 % State owned), CIPREL, AGGREKO, AZITO (IPP) Peak load 1.148 GW Network length : 4,697 km Lines type : 225/90 kV Losses : 6.4 % Number of networks : 1 Operator : CIE Lines length : 37,961 km MV : 30/11 kV LV: 380/220 V losses : 17.6 % Operator : CIE Consumption : 5,563 GWh Number of subscribers : 1,311,741 Consumption per capita : 251 kWh Average end-user price : 138.7 USD/MWh Electricity access 77 % SAIDI : 40 hrs per customer EECI historical power comany was privatized in 1990 Prices are regulated, not cost reflective and rarely modified Regulatory agency : ANARE Exports power to Togo, Benin, Burkina, Mali and Ghana Gas cost : 5.3 USD/MMBTU Fuel-oil cost : 972.2 USD/MT 4 Cameroon Population : 22,770,000 GDP (MUSD) : 32,050 Area : 475,440 km 2 Installed Capacity : 1.249 GW Net production : 6,080 GWh Load factor 55.6 % Fuel : Hydro, Natural gas, fuel-oil, diesel, Solar Utilities : ENEO (44 % State owned), KPDC, DPDC (IPP) Peak load 0.790 GW Network length : 2,232 km Lines type : 225/110/90 kV Losses : 5.6 % Number of networks : 3 Operator : ENEO Lines length : 34,358 km MV : 30/15 kV LV: 380/220 V losses : 30.9 % Operator : ENEO Consumption : 4,360 GWh Number of subscribers : 951,496 Consumption per capita : 191 kWh Average end-user price : 129,40 USD/MWh Electricity access : 50 % SAIDI : 105.2 hrs per customer SAIFI : 305 per customer SONEL historical power company was privatized in 2001 Prices are regulated and rarely modified Regulatory agency : ARSEL Transmission company created in 2015 Fuel-oil cost : 476.2 USD/MT Diesel cost : 1,213.2 USD/MT 5 Senegal Population : 14,670,000 GDP (MUSD) : 15,660 Area : 196,190 km 2 Installed Capacity : 0.828 GW Net production : 3,227 GWh Load factor 44.0 % Fuel : Fuel-oil, hydro, natural gas, diesel Utilities : SENELEC (State owned), GTI, KONOUNE (IPP), MANANTALI, FELOU (Dedicated capacity), AGGREKO, APR Energy (Leased capcity) Peak load 0.466 GW1 Network length : 511 km1 Lines type : 225/90 kV Losses : 2.4 % Number of networks : 3 Operator : SENELEC Lines length : 16,466 km 1 MV : 30/6.6 kV LV: 380/220/127 V losses : 18.4 % Operator : SENELEC Consumption : 2,565 GWh Number of Subscribers : 1,050,228 Consumption per capita : 194 kWh Average end-user price : 237.69 USD/MWh Electricity access : 60 % END = 21 GWh The privatization deal with the consortium of Hydro-Quebec and Elyo was canceled by Senegal in 2000 Prices are regulated, not cost reflective and rarely modified Regulatory agency : CRSE Senegal has 60 and 15 MW of dedicated capacity in Manantali and Felou hydro dams (Mali) Fuel-oil cost : 710.0 USD/MT Diesel cost : 1,083.1 USD/MT Gas price : 8.9 USD/MMBTU 1 2012 data Sources : Regulators, Utilities, Ministries of Enegy, International Energy Agency, World bank, African Development Bank By Patrick Hervé BABOGA, M. Eng. 3/3