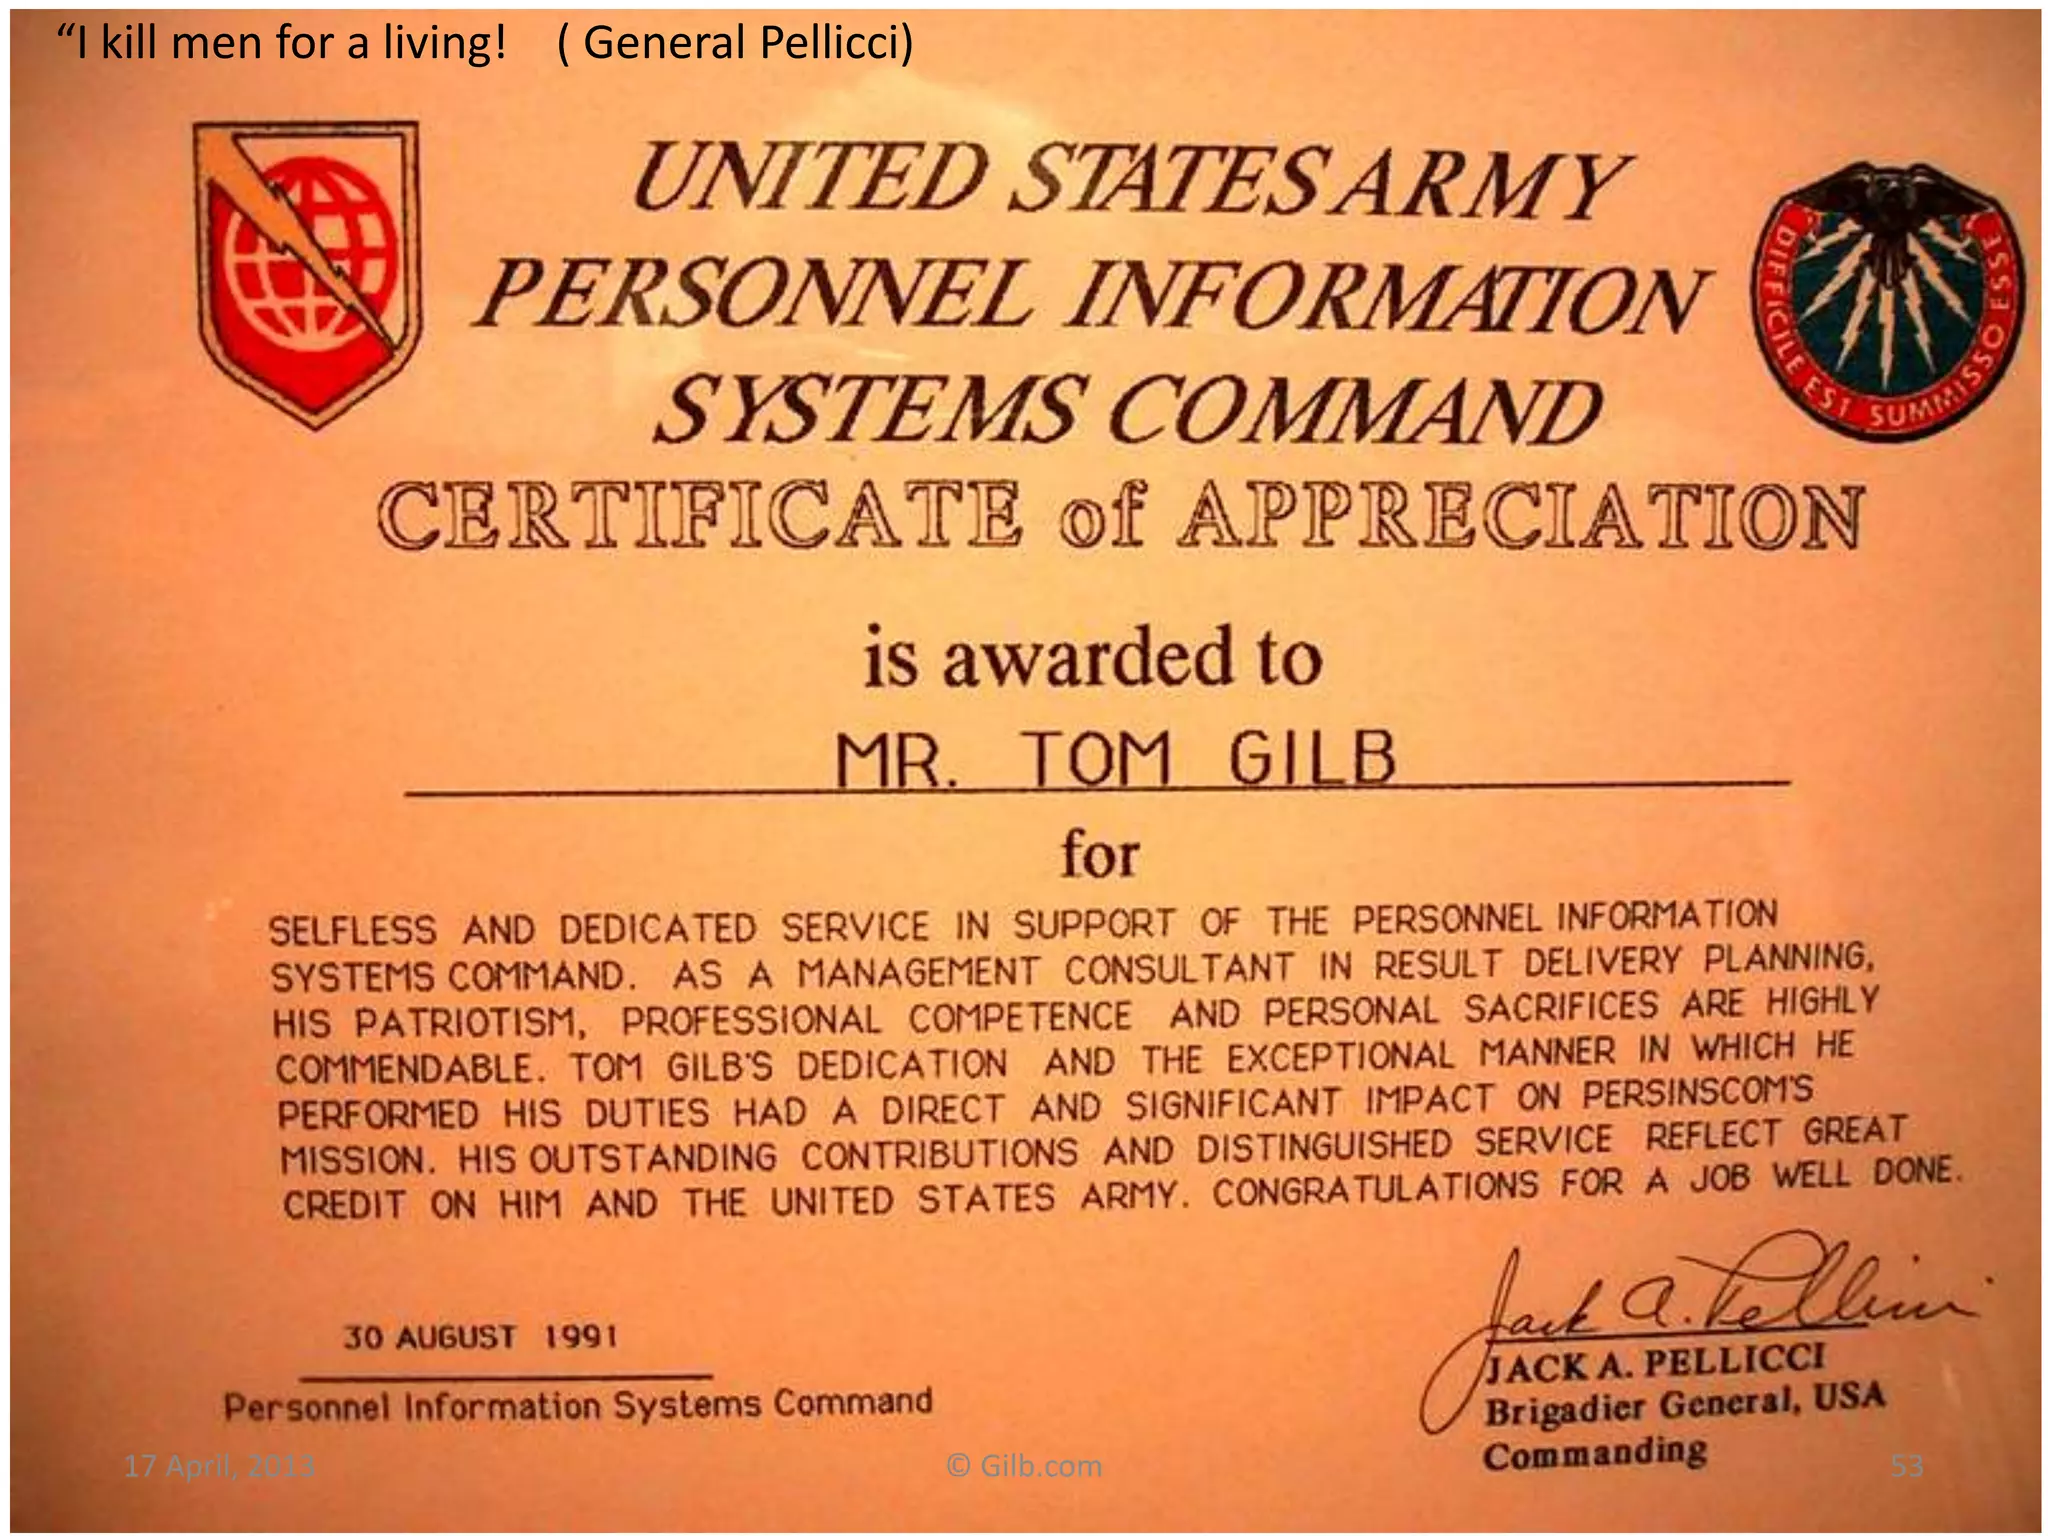
Downloaded 36 times
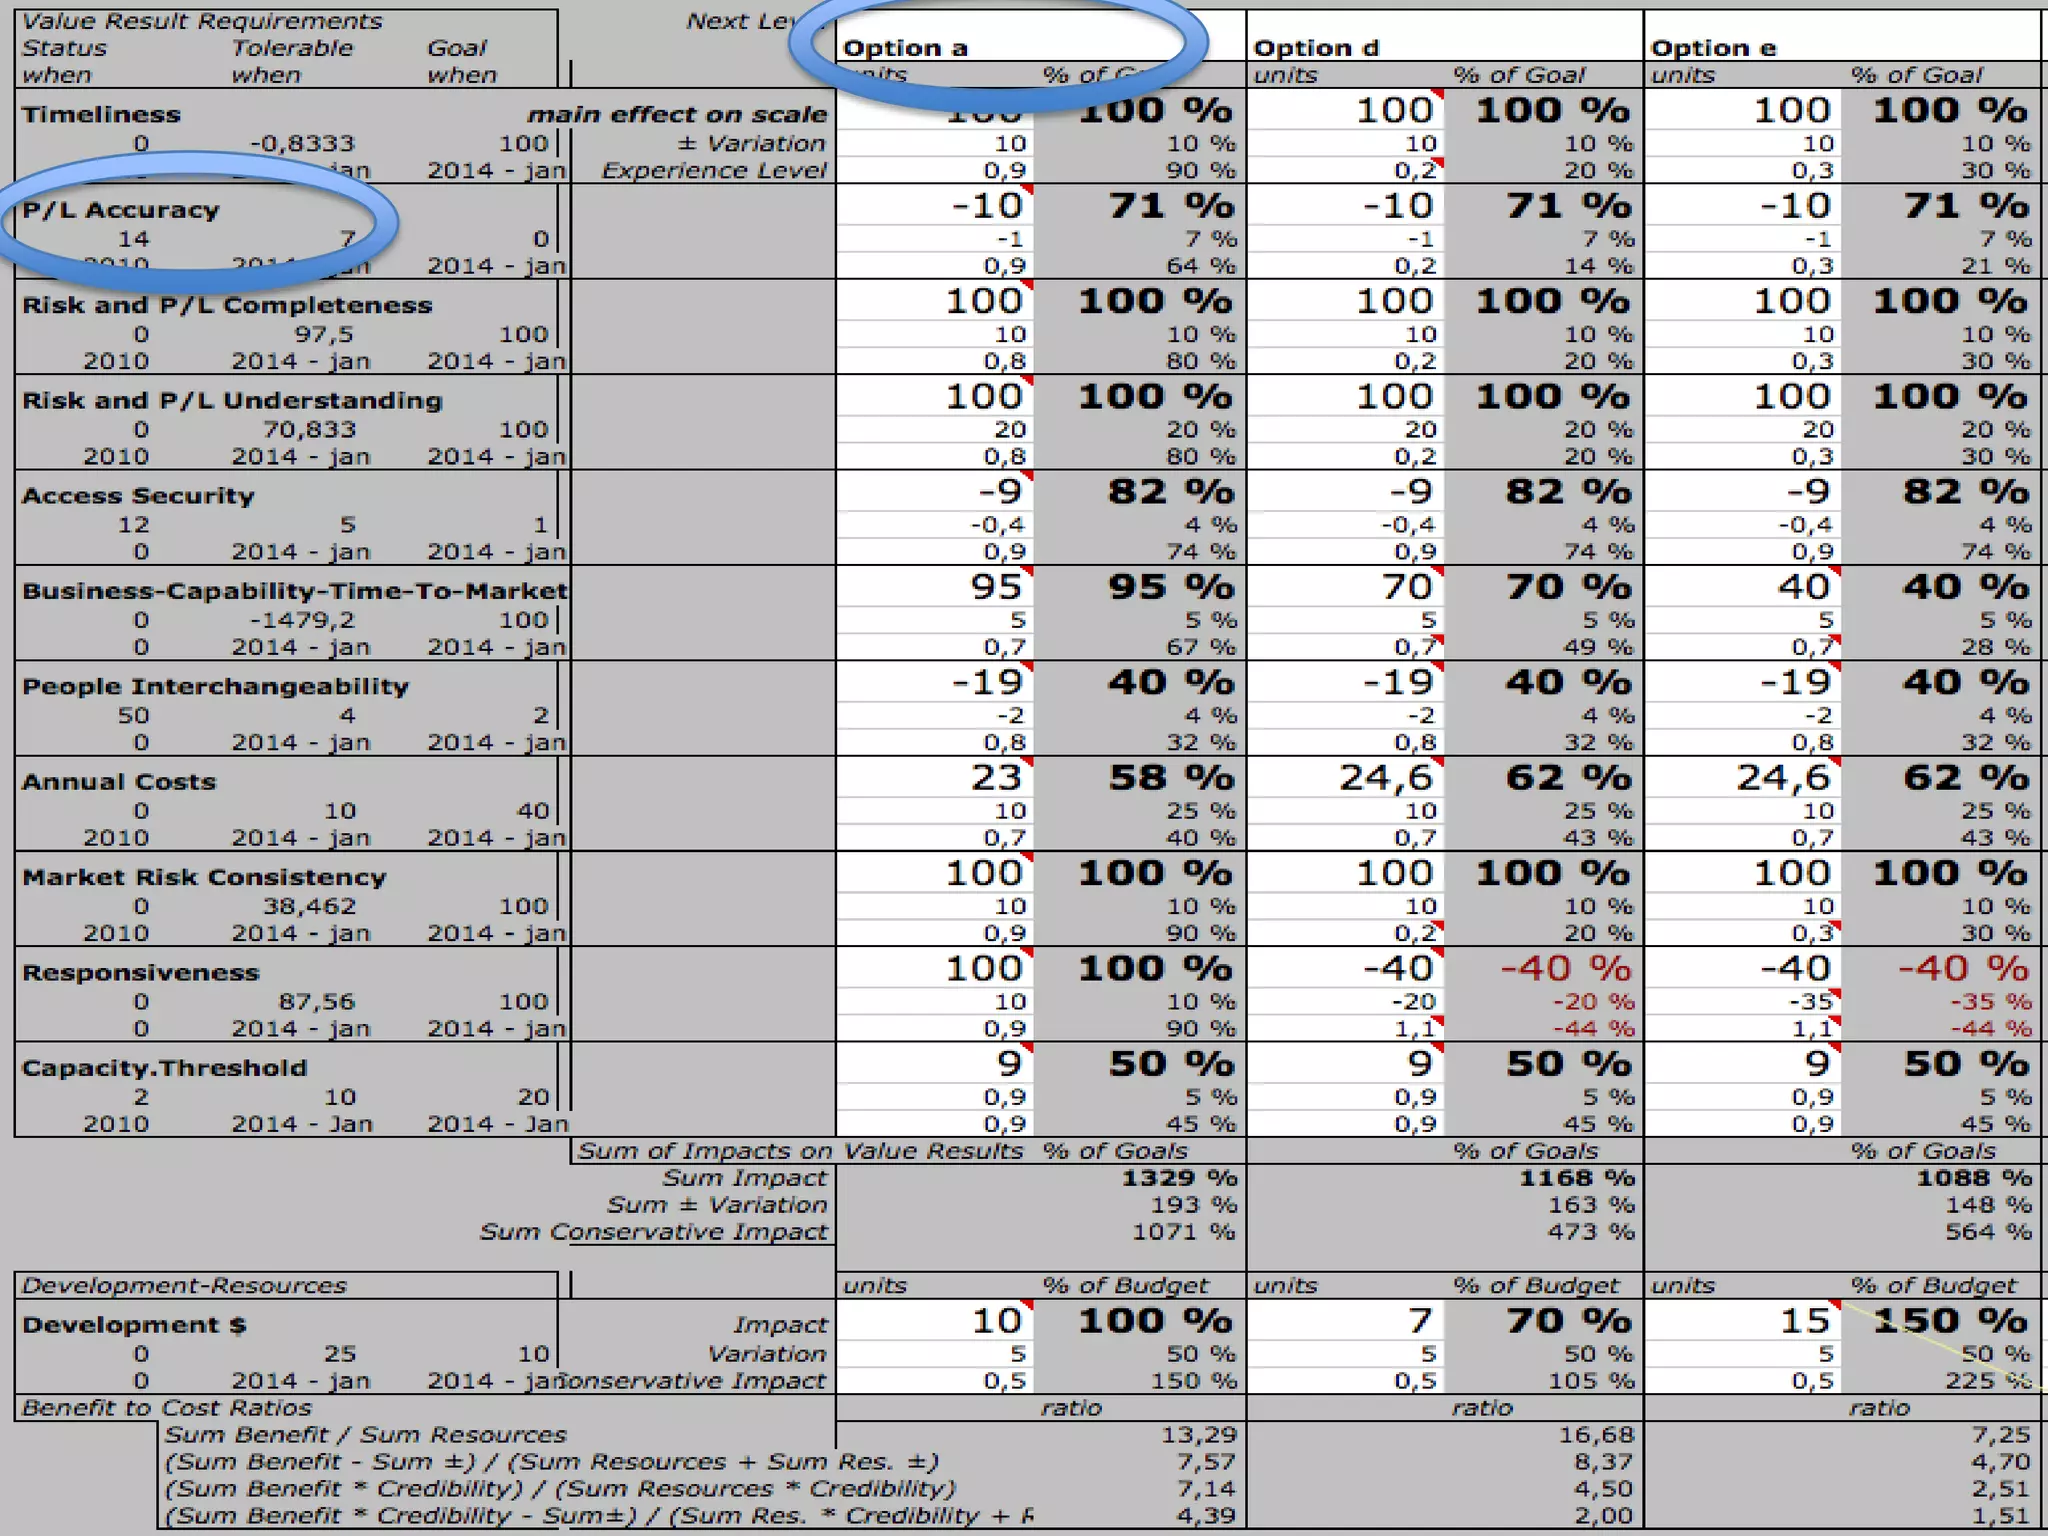
![Slide 17
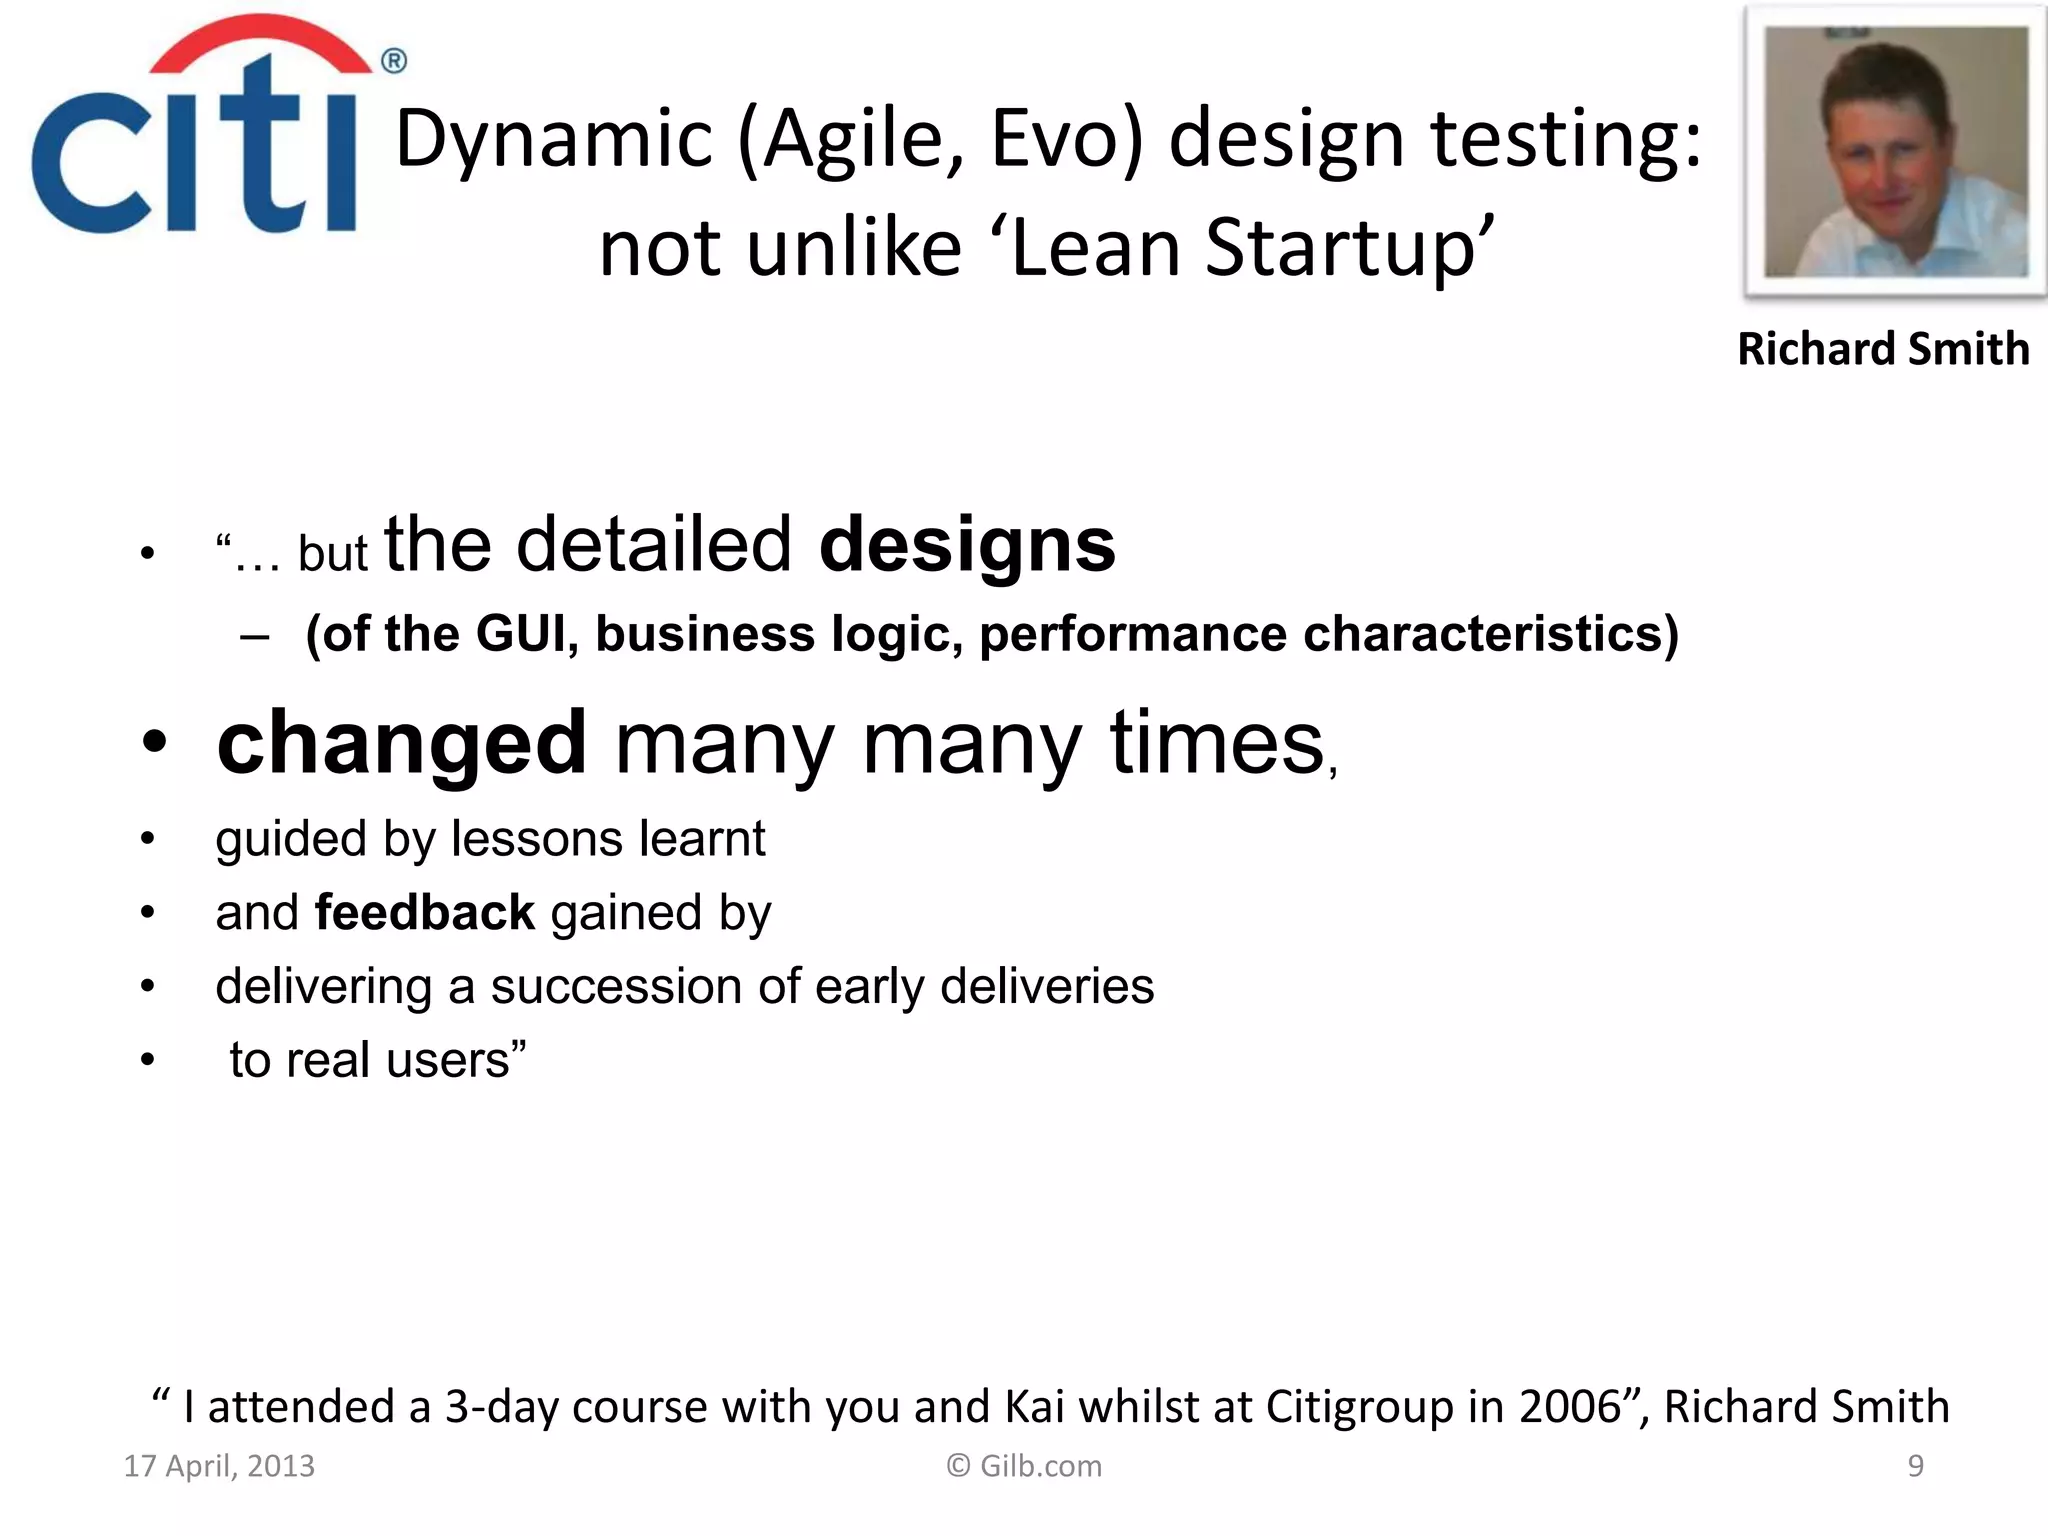
Sample of Objectives/Strategy definitions
US Army Example: PERSINSCOM: Personnel System
• Example of one of the Objectives:
Customer Service:
Type: Critical Top level Systems Objective
Gist: Improve customer perception of quality of service
provided.
Scale: Violations of Customer Agreement per Month.
Meter: Log of Violations.
Past [Last Year] Unknown Number State of PERSCOM
Management Review
Record [NARDAC] 0 ? NARDAC Reports Last Year
Fail : <must be better than Past, Unknown number> CG
Goal [This Year, PERSINCOM] 0 “Go for the Record” Group
SWAG
.
Wednesday, 17 April 2013 © Tom@Gilb.com Top10 Method](https://image.slidesharecdn.com/gilbprojectmanagementdrivenbythetoptencriticalimprovementsquantifiedbcsapm15april2013-130417105854-phpapp02/75/Project-management-driven-by-the-top-ten-critical-improvements-qu-17-2048.jpg)
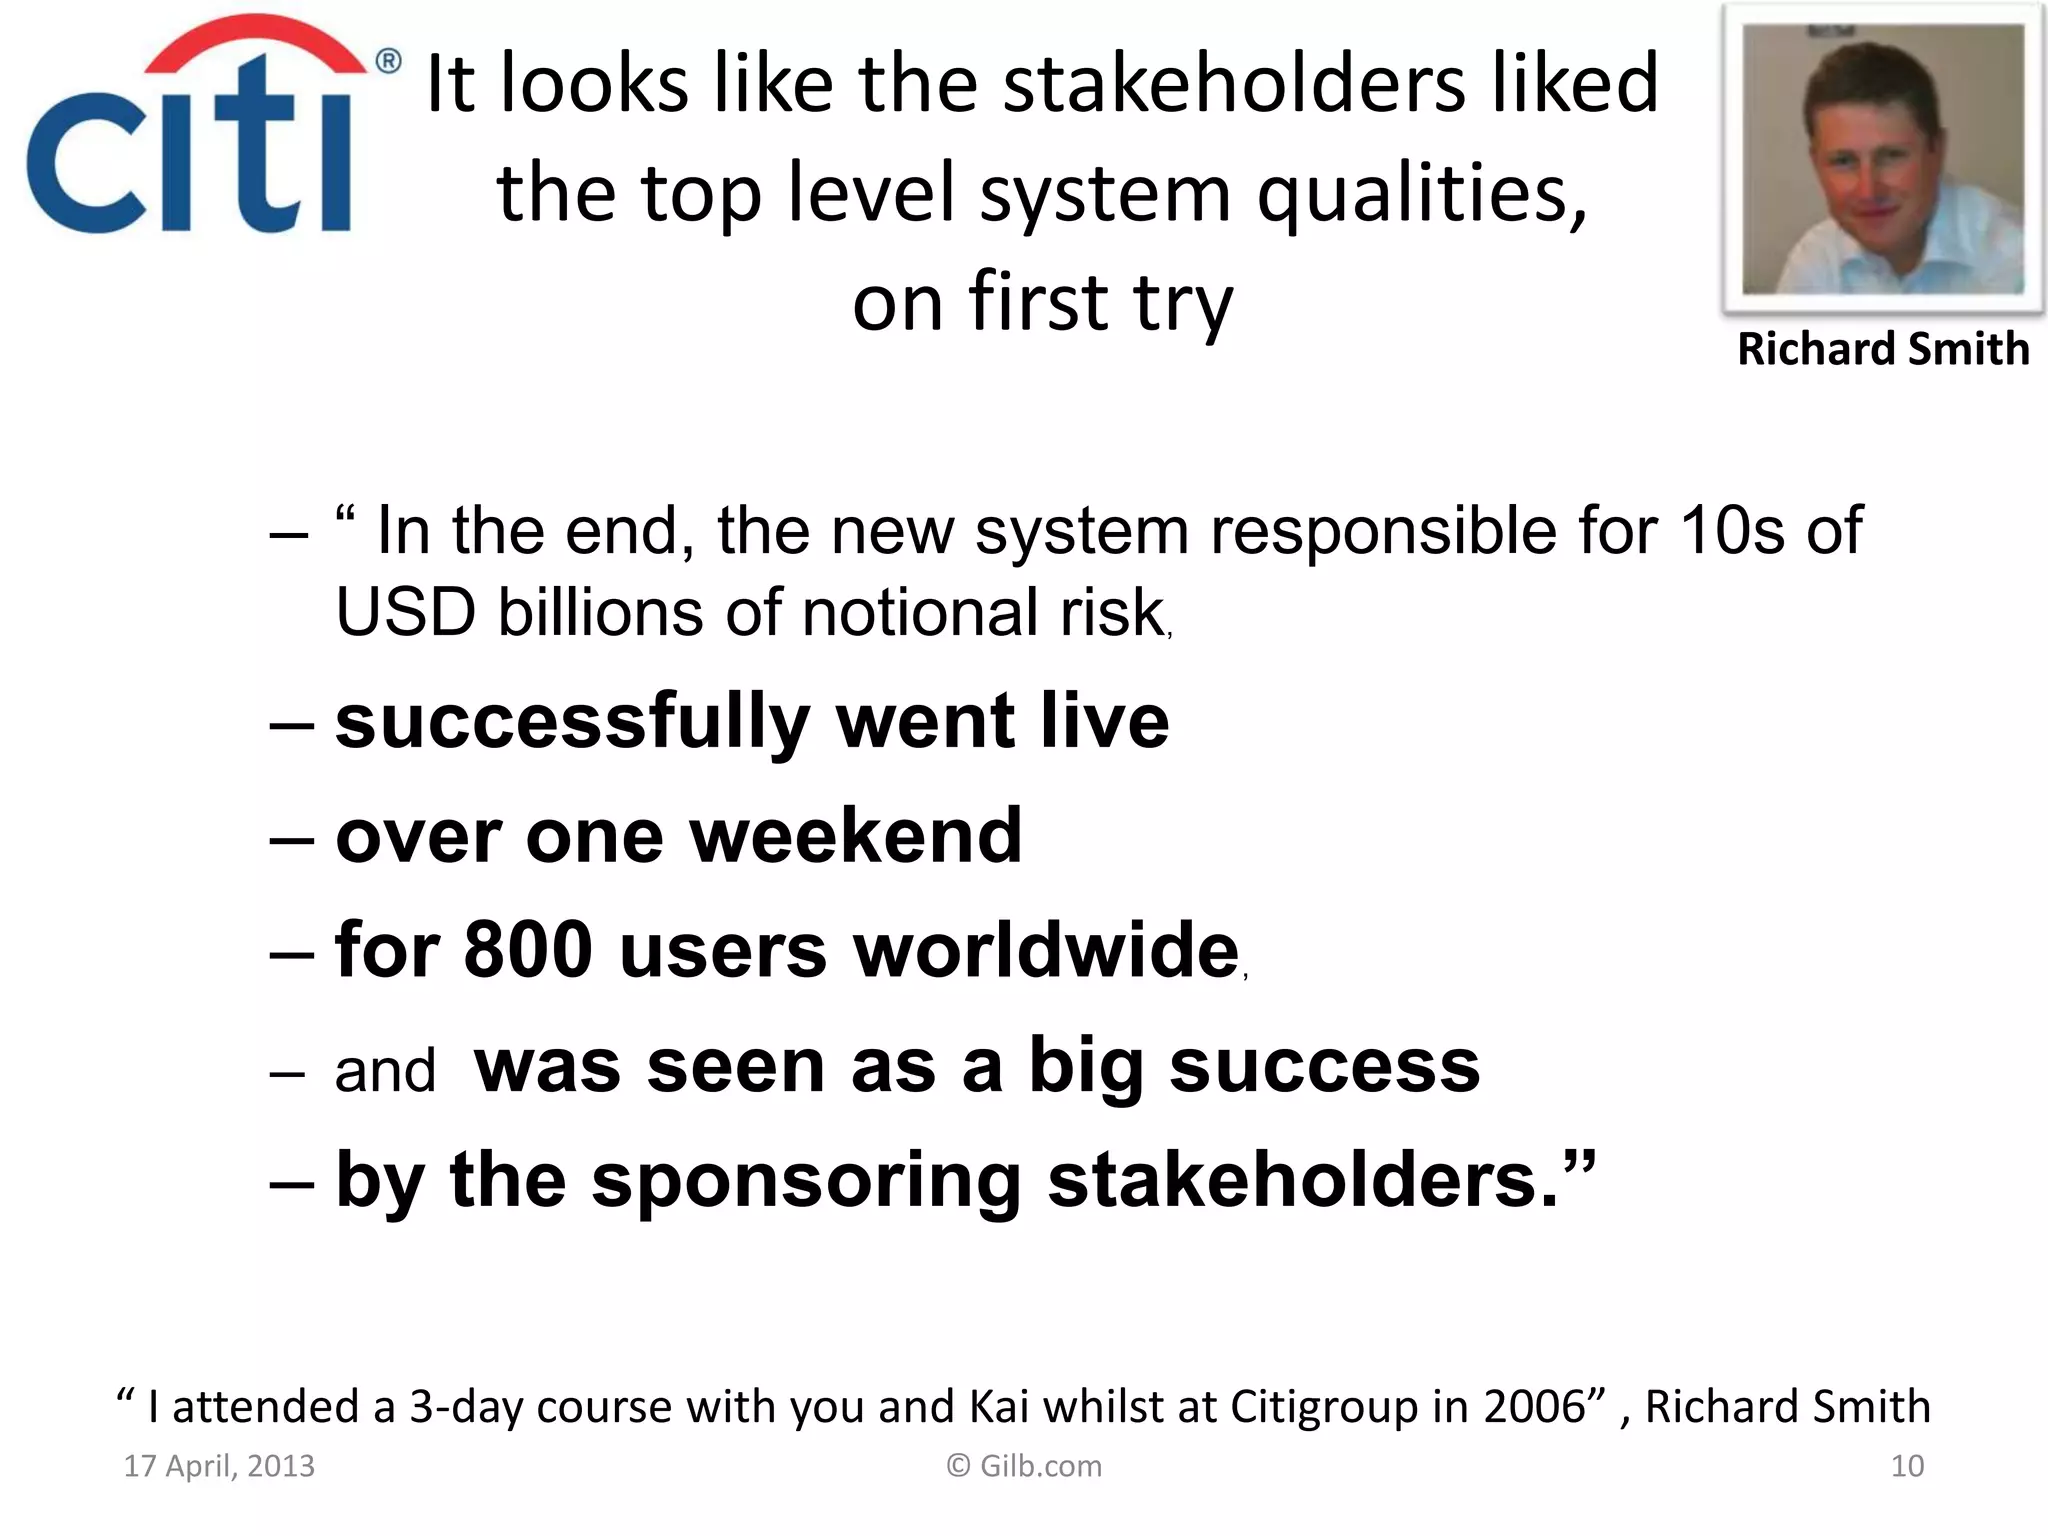
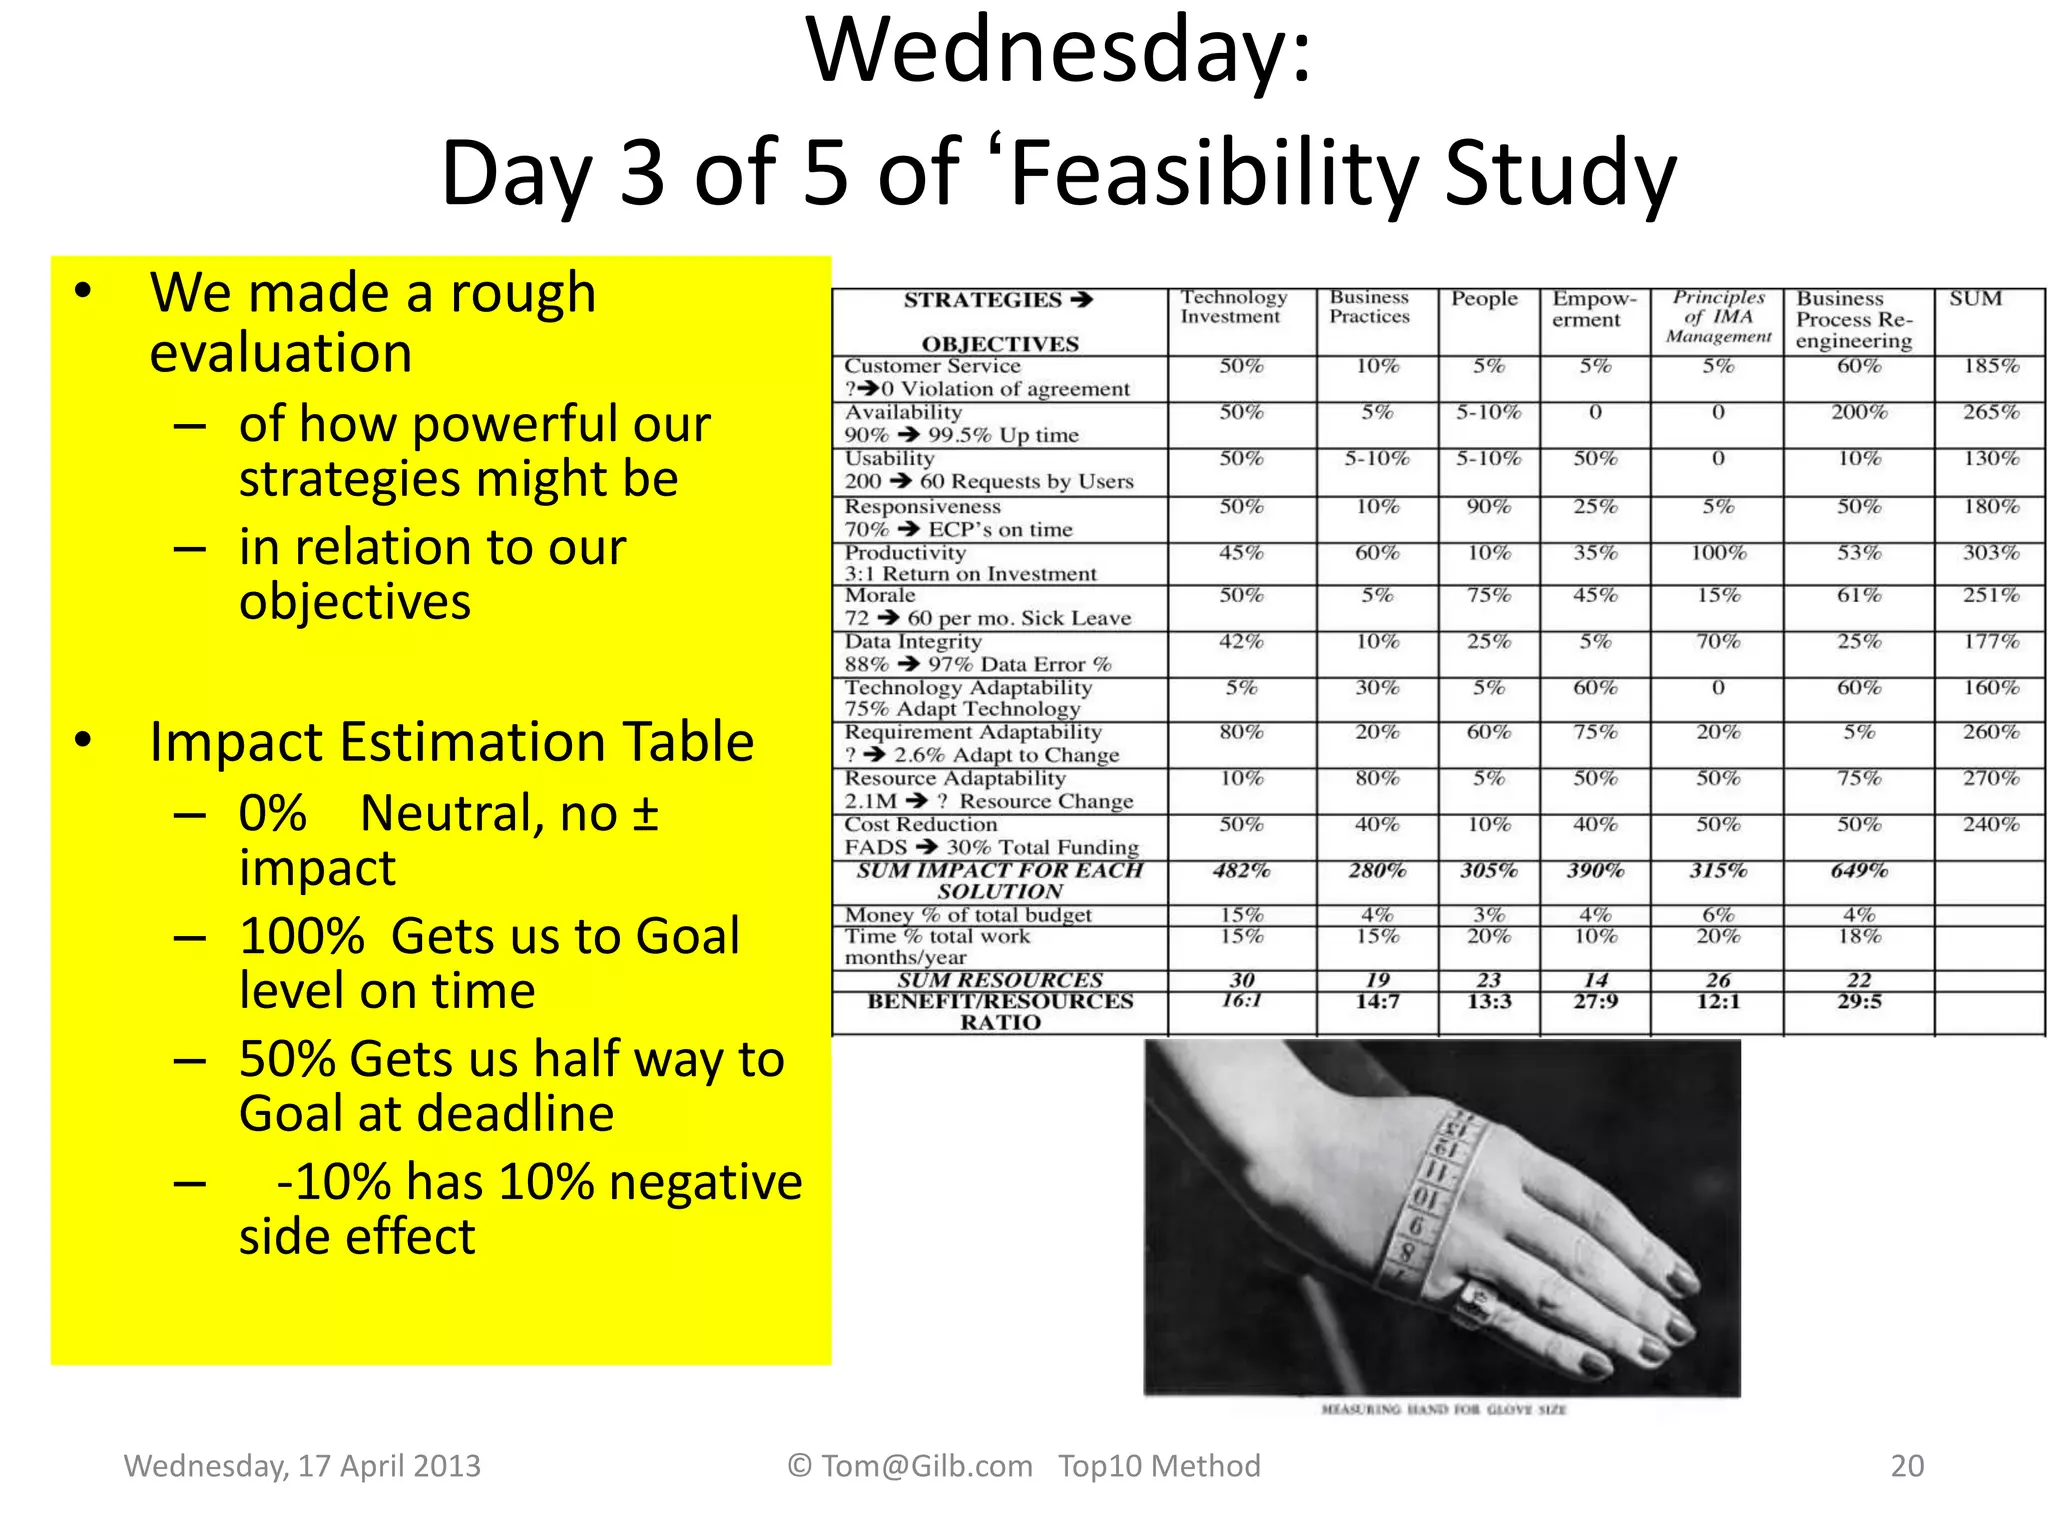
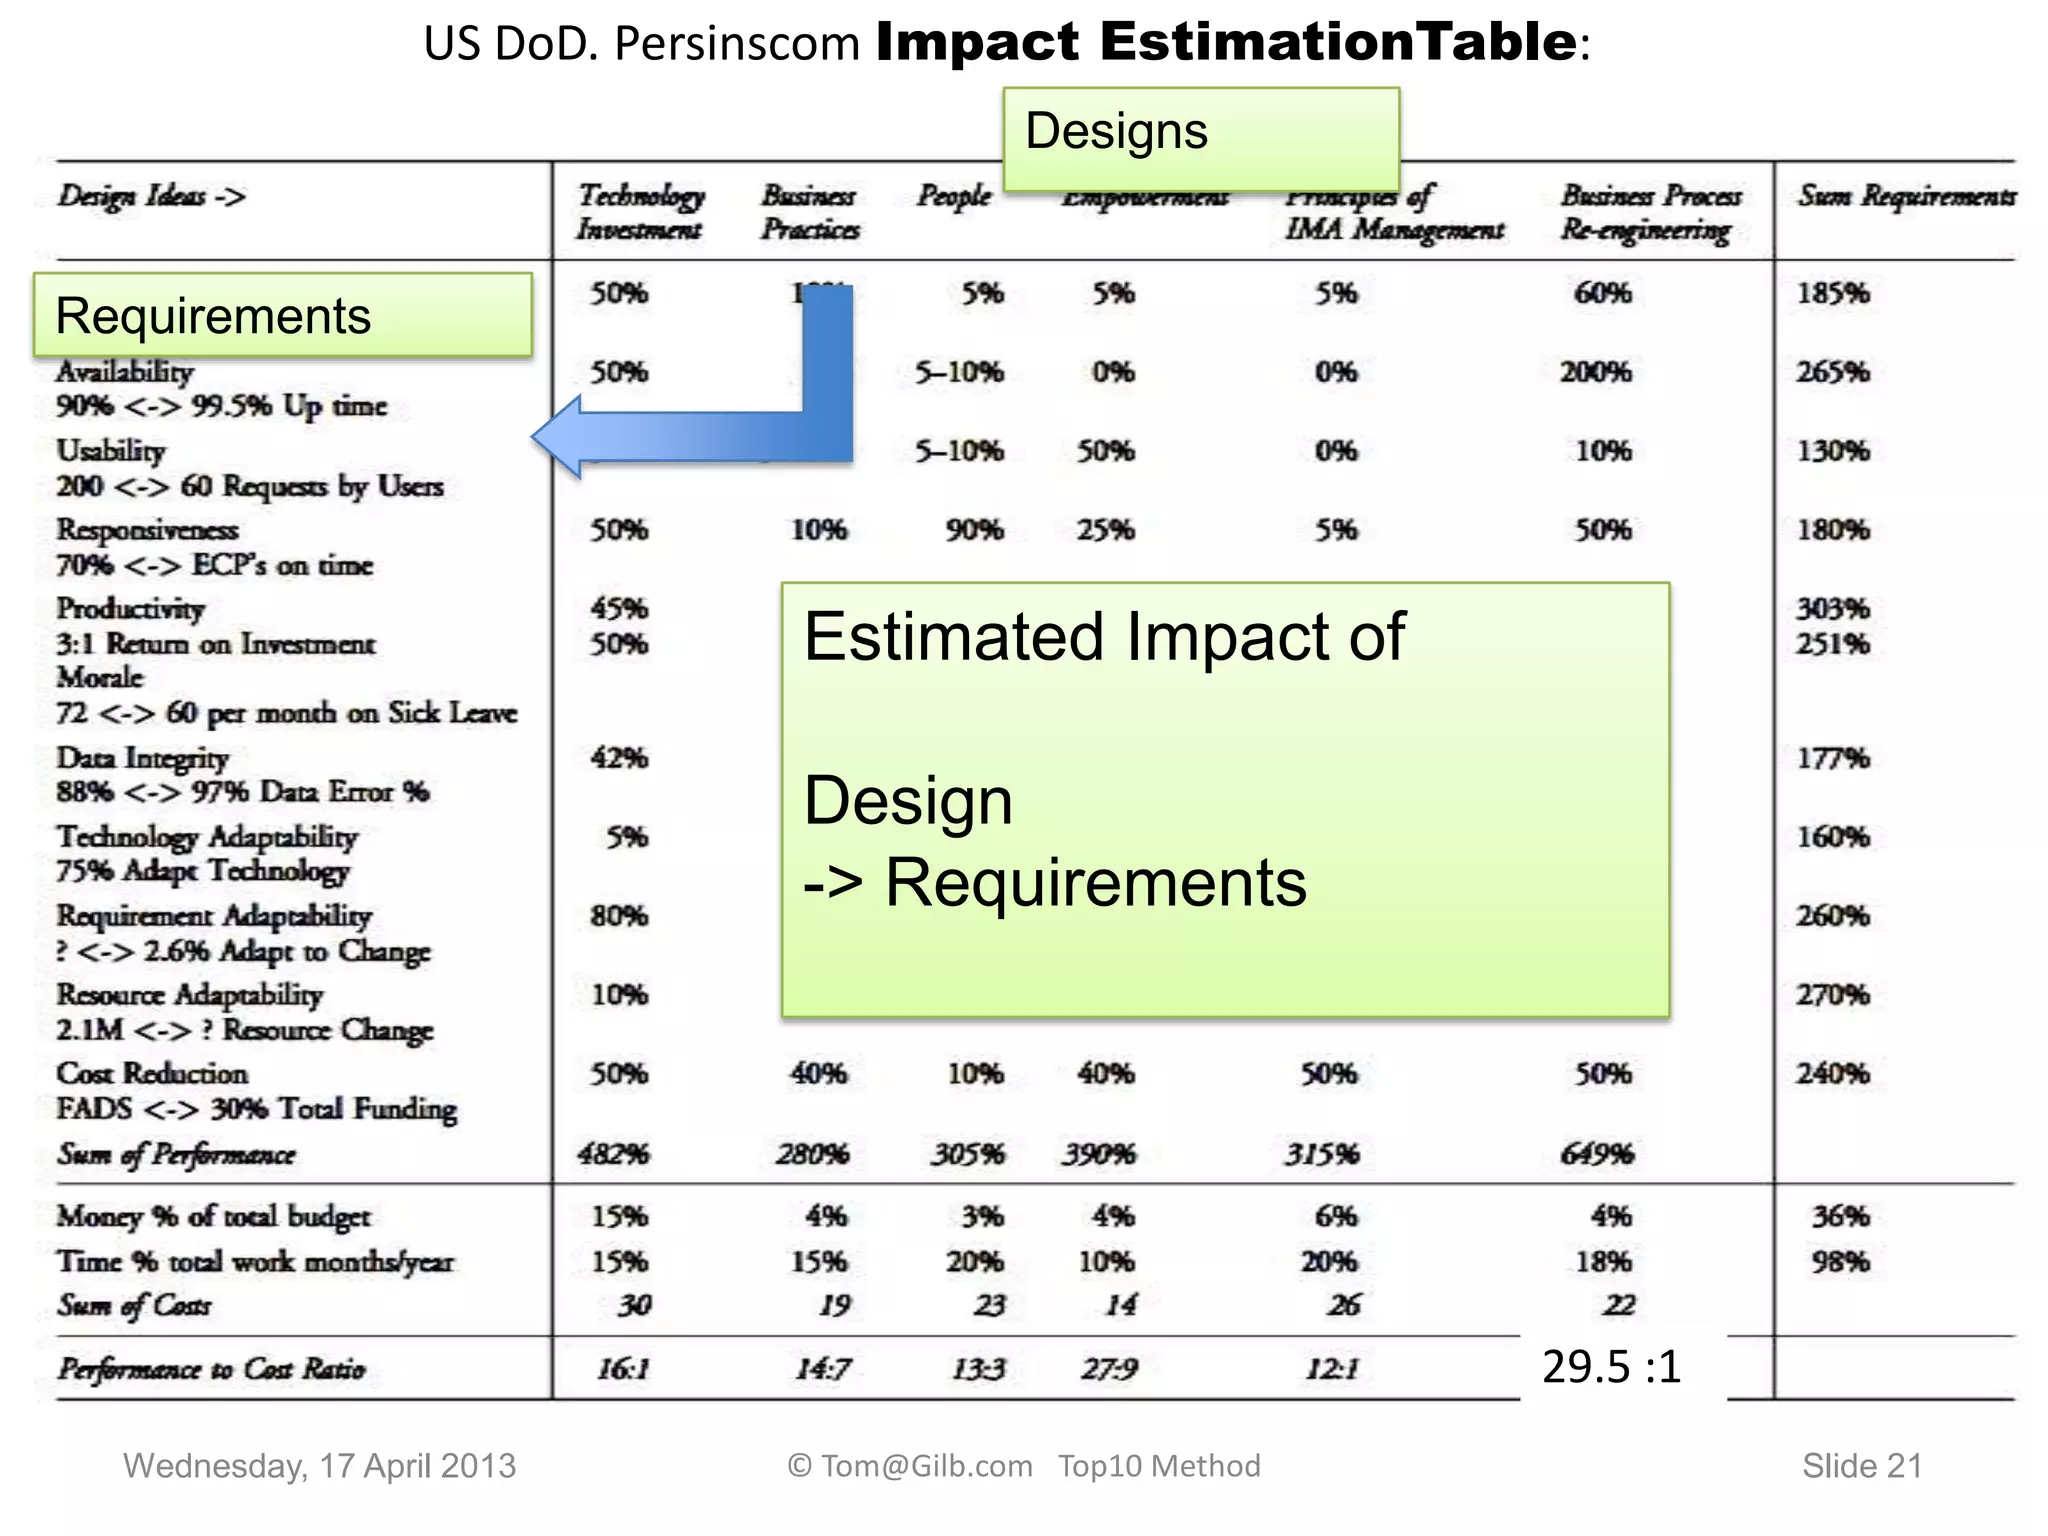
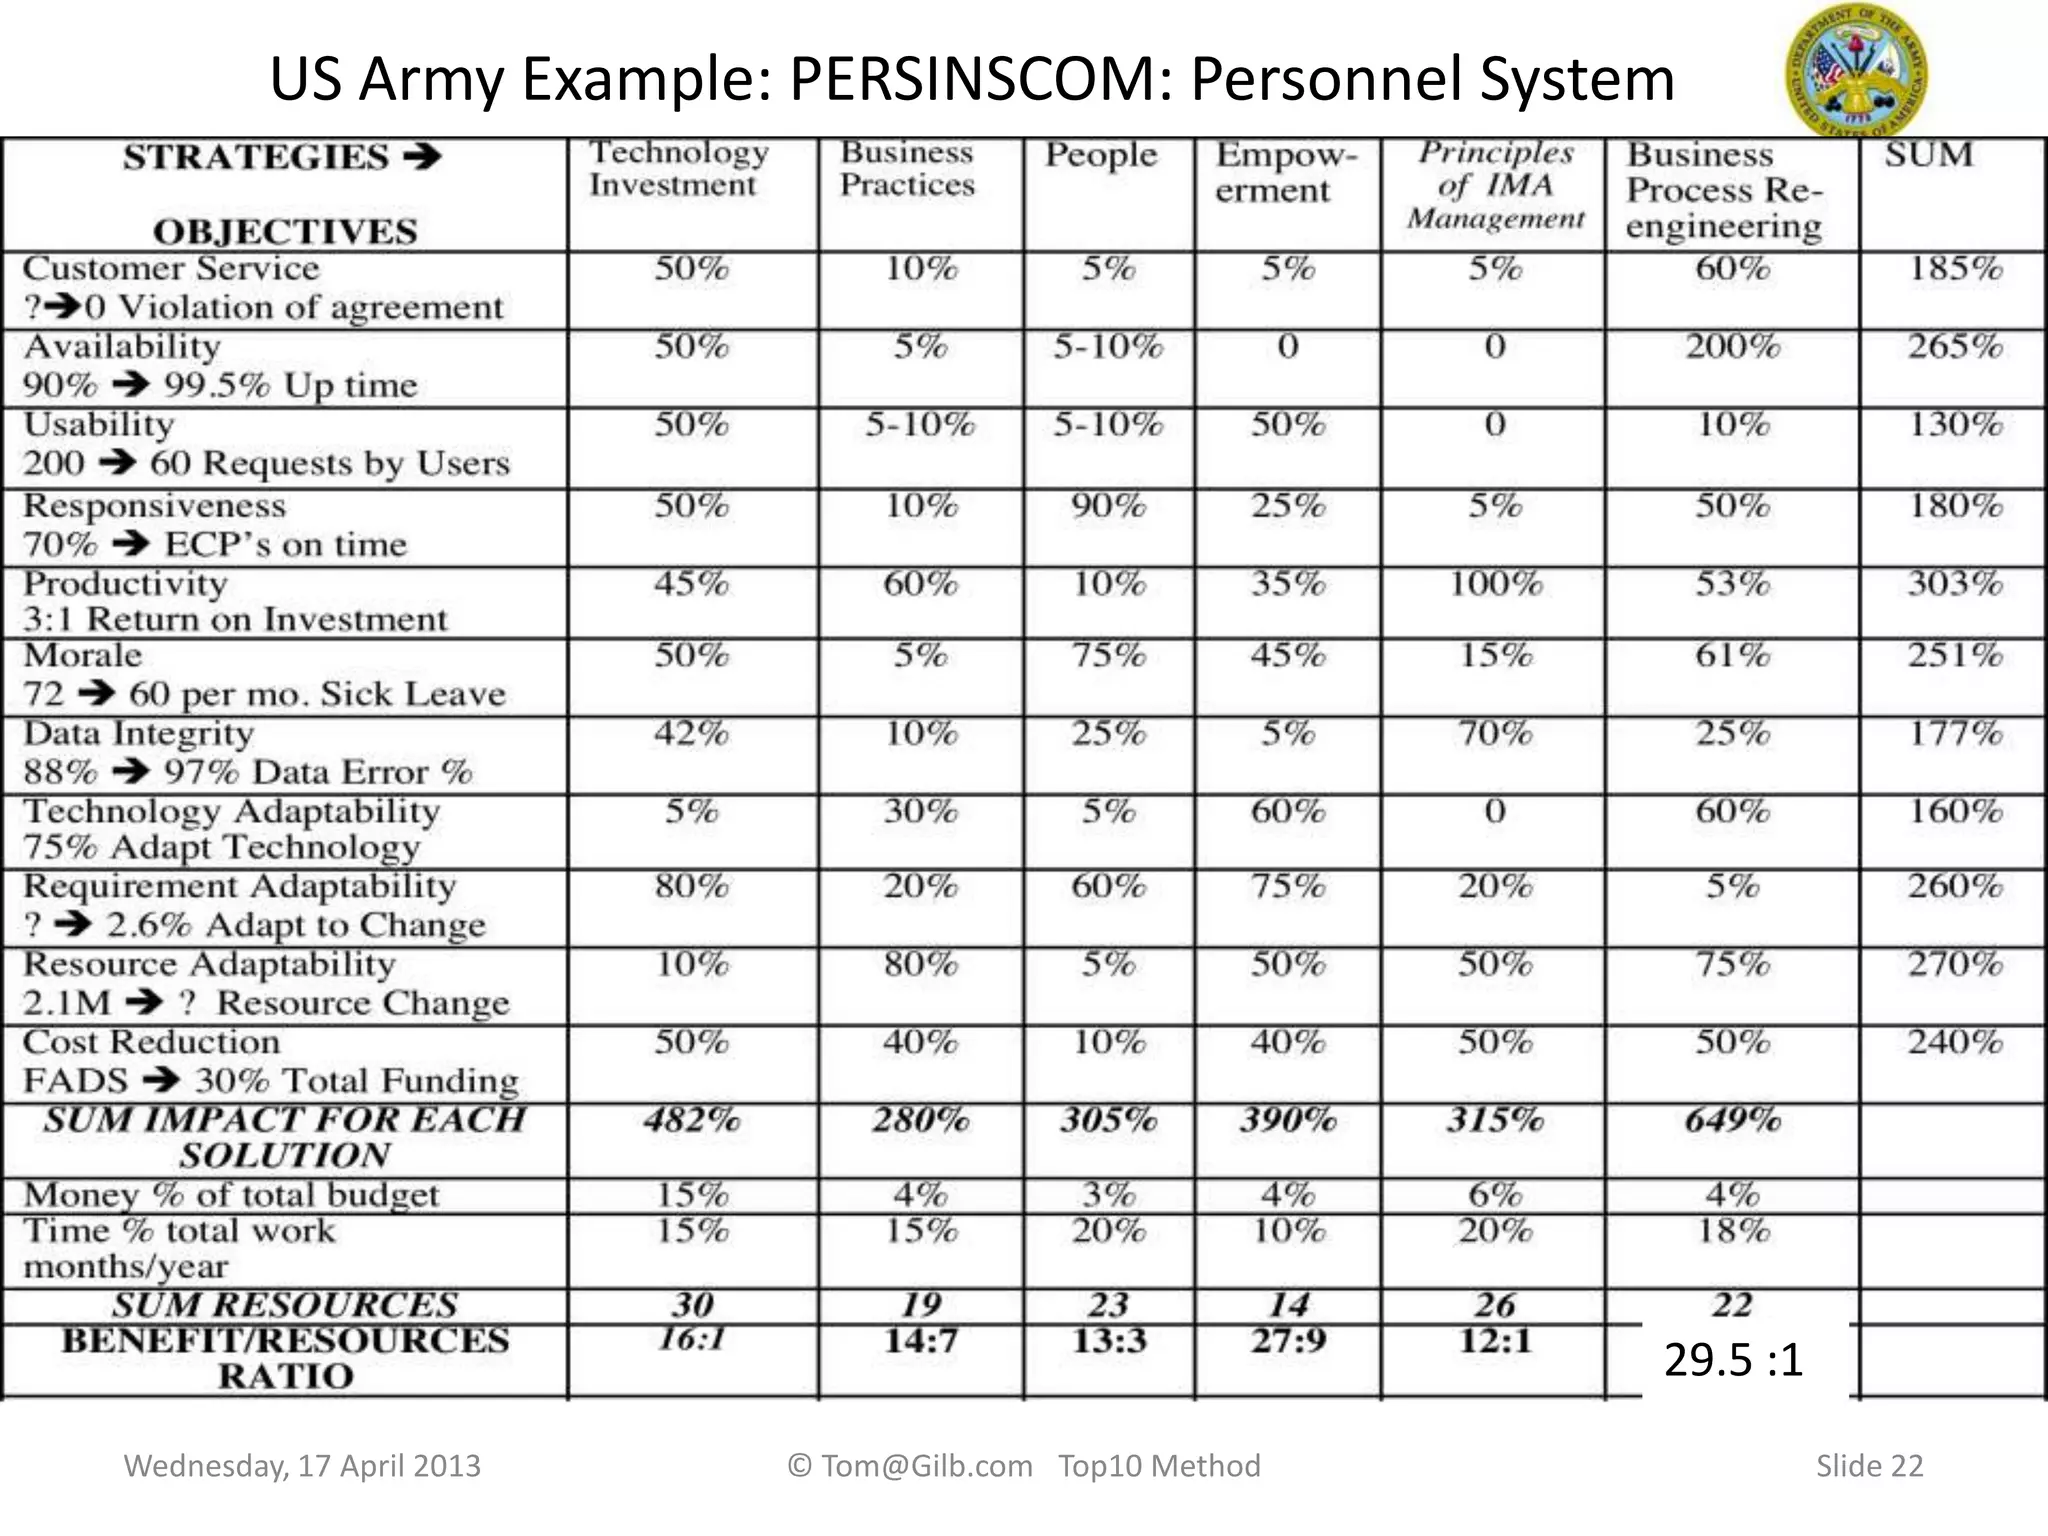
![Slide 19
Sample of Objectives/Strategy definitions
US Army Example: PERSINSCOM: Personnel System
Example of a real Impact Estimation table from a Pro-Bono Client (US DoD, US Army, PERSINSCOM).
Thanks to the Task Force, LTC Dan Knight and Br. Gen. Jack Pallici for full support in u sing my methods.
Source: Draft, Personnel Enterprise, IMA End-State 95 Plan, Vision 21, 2 Dec. 1991. “Not procurement sensitive”.
Example of one of the Objectives:
Customer Service:
Gist: Improve customer perception of quality of service provided.
Scale: Violations of Customer Agreement per Month.
Meter: Log of Violations.
Past [1991] Unknown Number State of PERSCOM Management Review
Record [NARDAC] 0 ? NARDAC Reports 1991
Must : <better than Past, Unknown number> CG
Plan [1991, PERSINCOM] 0 “Go for the Record” Group SWAG
Technology Investment:
Exploit investment in high return technology. Impacts: productivity, customer service and conserves resources.
An example of one of the strategies defined.
A Strategy (Top Level of Detail)
Technology Investment:
Gist: Exploit investment in high
return technology.
Impacts: productivity, customer
service and conserves resources.
Wednesday, 17 April 2013 © Tom@Gilb.com Top10 Method](https://image.slidesharecdn.com/gilbprojectmanagementdrivenbythetoptencriticalimprovementsquantifiedbcsapm15april2013-130417105854-phpapp02/75/Project-management-driven-by-the-top-ten-critical-improvements-qu-19-2048.jpg)
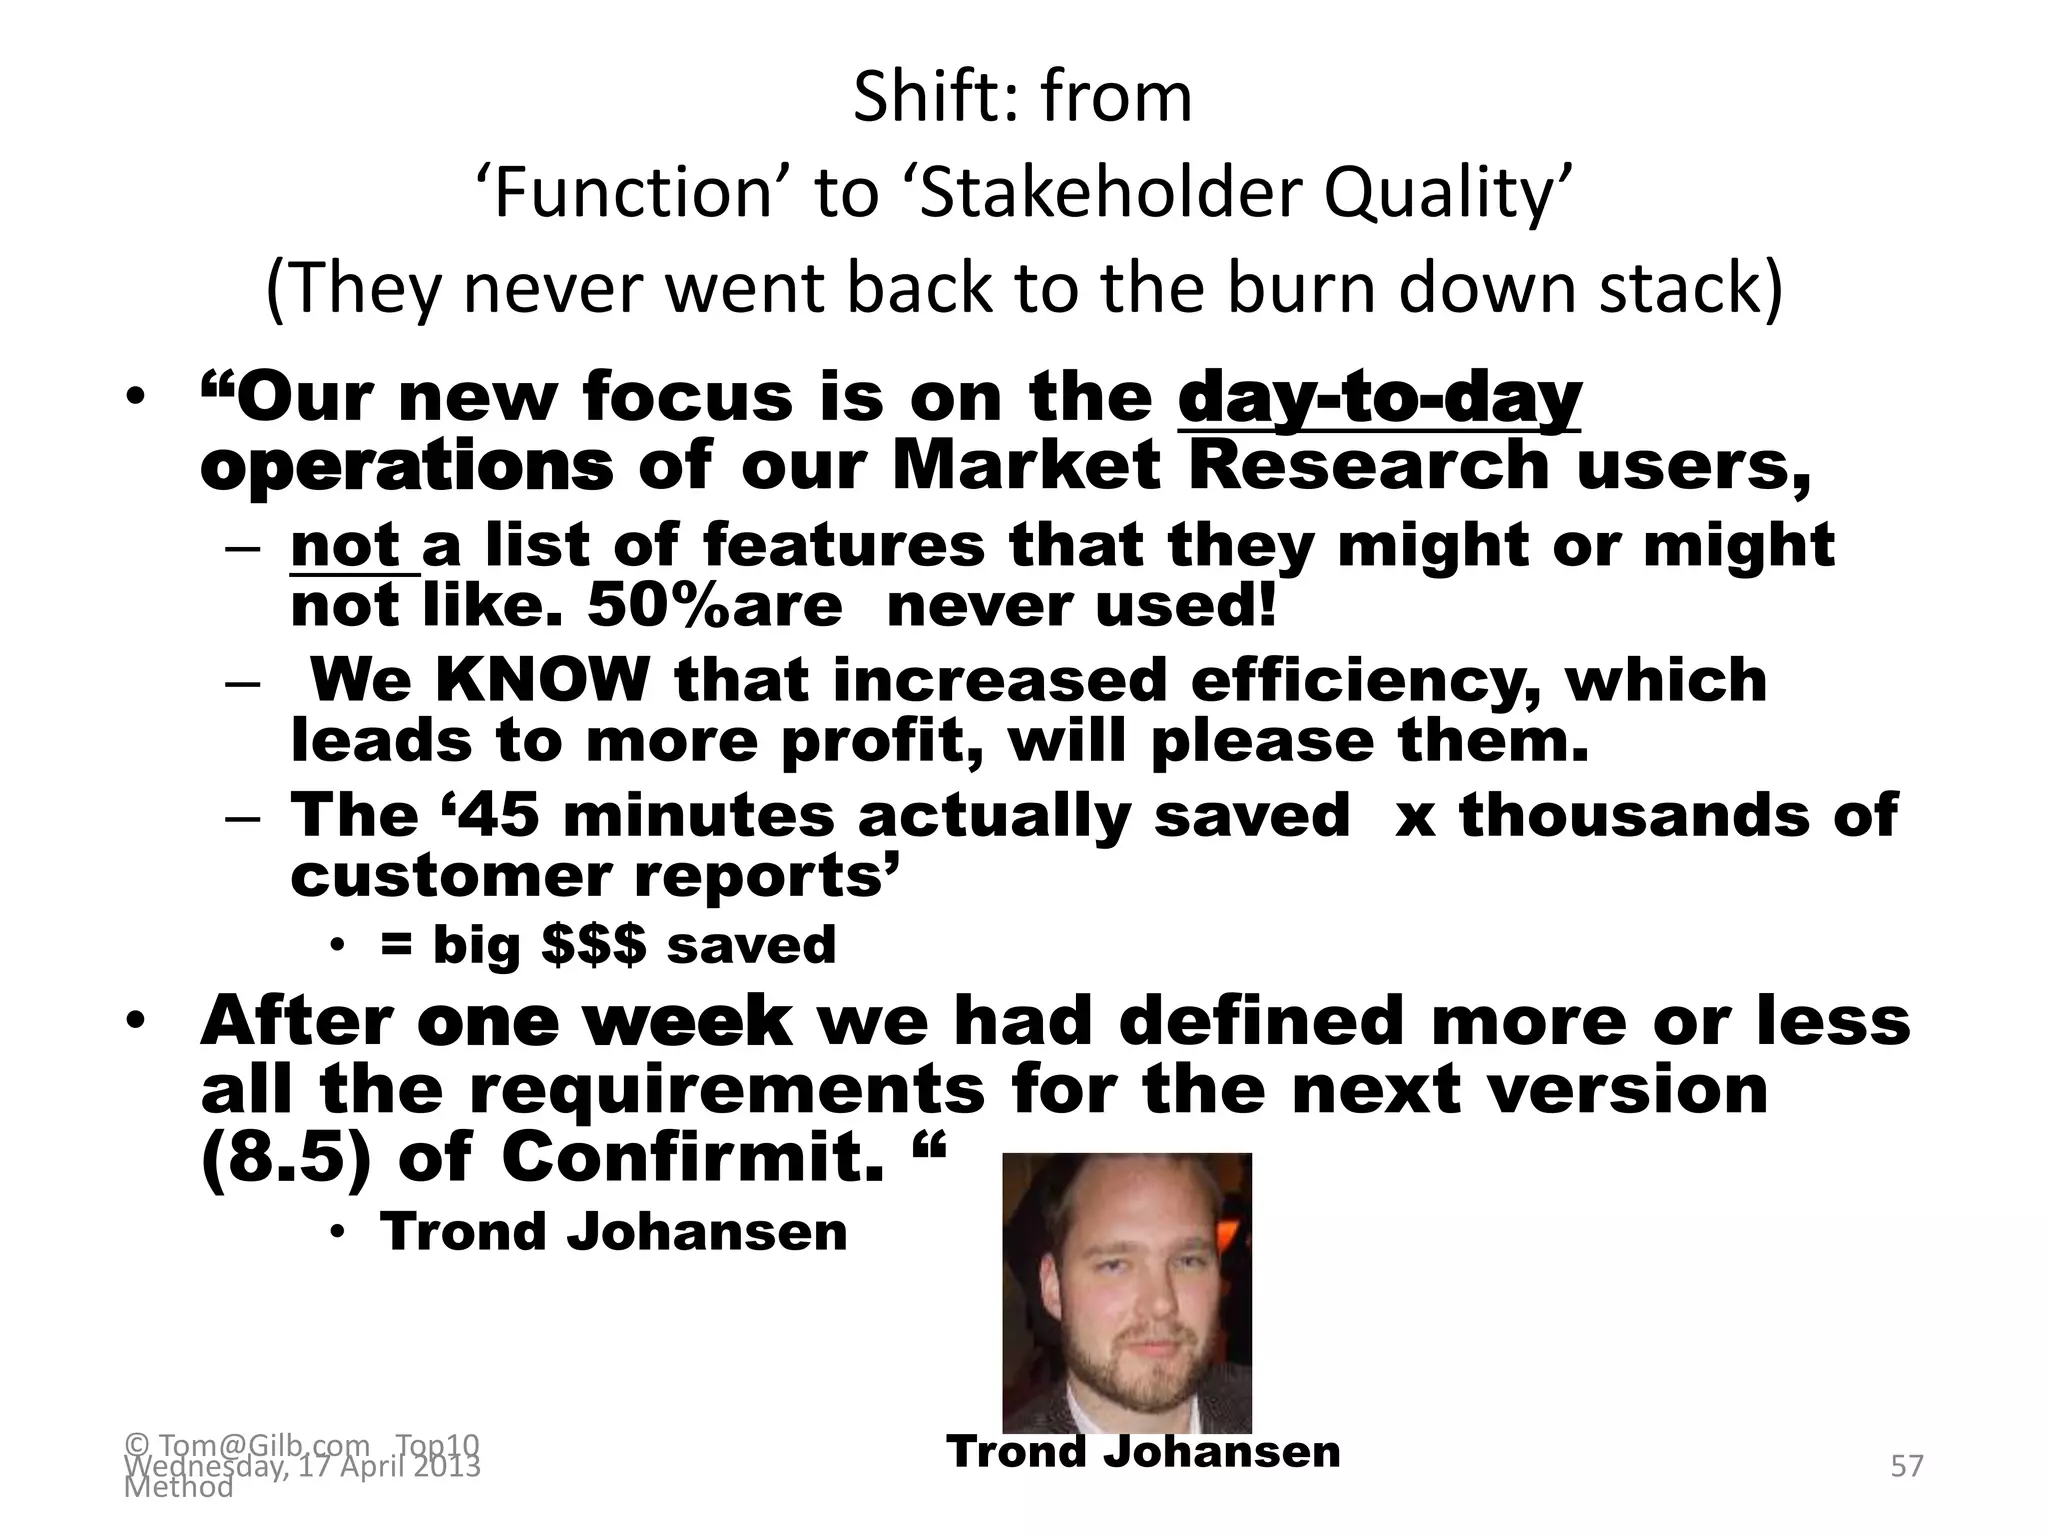
![Lack of clear top level project objectives has seen real projects fail
for $100+ million: personal experience, real case
Bad Objectives, for 8 years
1. Central to The Corporations business strategy is to be the
world’s premier integrated <domain> service provider.
2. Will provide a much more efficient user experience
3. Dramatically scale back the time frequently needed after
the last data is acquired to time align, depth
correct, splice, merge, recompute and/or do whatever else is
needed to generate the desired products
4. Make the system much easier to understand and use than
has been the case for previous system.
5. A primary goal is to provide a much more productive system
development environment than was previously the case.
6. Will provide a richer set of functionality for supporting next-
generation logging tools and applications.
7. Robustness is an essential system requirement (see partial
rewrite in example at right)
8. Major improvements in data quality over current practice
Quantified Objectives (in Planguage),
What they should have done
8 years earlier!
Robustness.Testability:
Type: Software Quality Requirement.
Version: 20 Oct 2006-10-20
Status: Demo draft,
Stakeholder: {Operator, Tester}.
Ambition: Rapid-duration automatic testing of
<critical complex tests>, with extreme operator setup
and initiation.
Scale: the duration of a defined
[Volume] of testing, or a defined
[Type], by a defined [Skill Level] of
system operator, under defined
[Operating Conditions].
Goal [All Customer Use, Volume = 1,000,000 data
items, Type = WireXXXX Vs DXX, Skill = First Time
Novice, Operating Conditions = Field, {Sea Or
Desert}. <10 mins.
17 April, 2013 © Gilb.com 28](https://image.slidesharecdn.com/gilbprojectmanagementdrivenbythetoptencriticalimprovementsquantifiedbcsapm15april2013-130417105854-phpapp02/75/Project-management-driven-by-the-top-ten-critical-improvements-qu-28-2048.jpg)
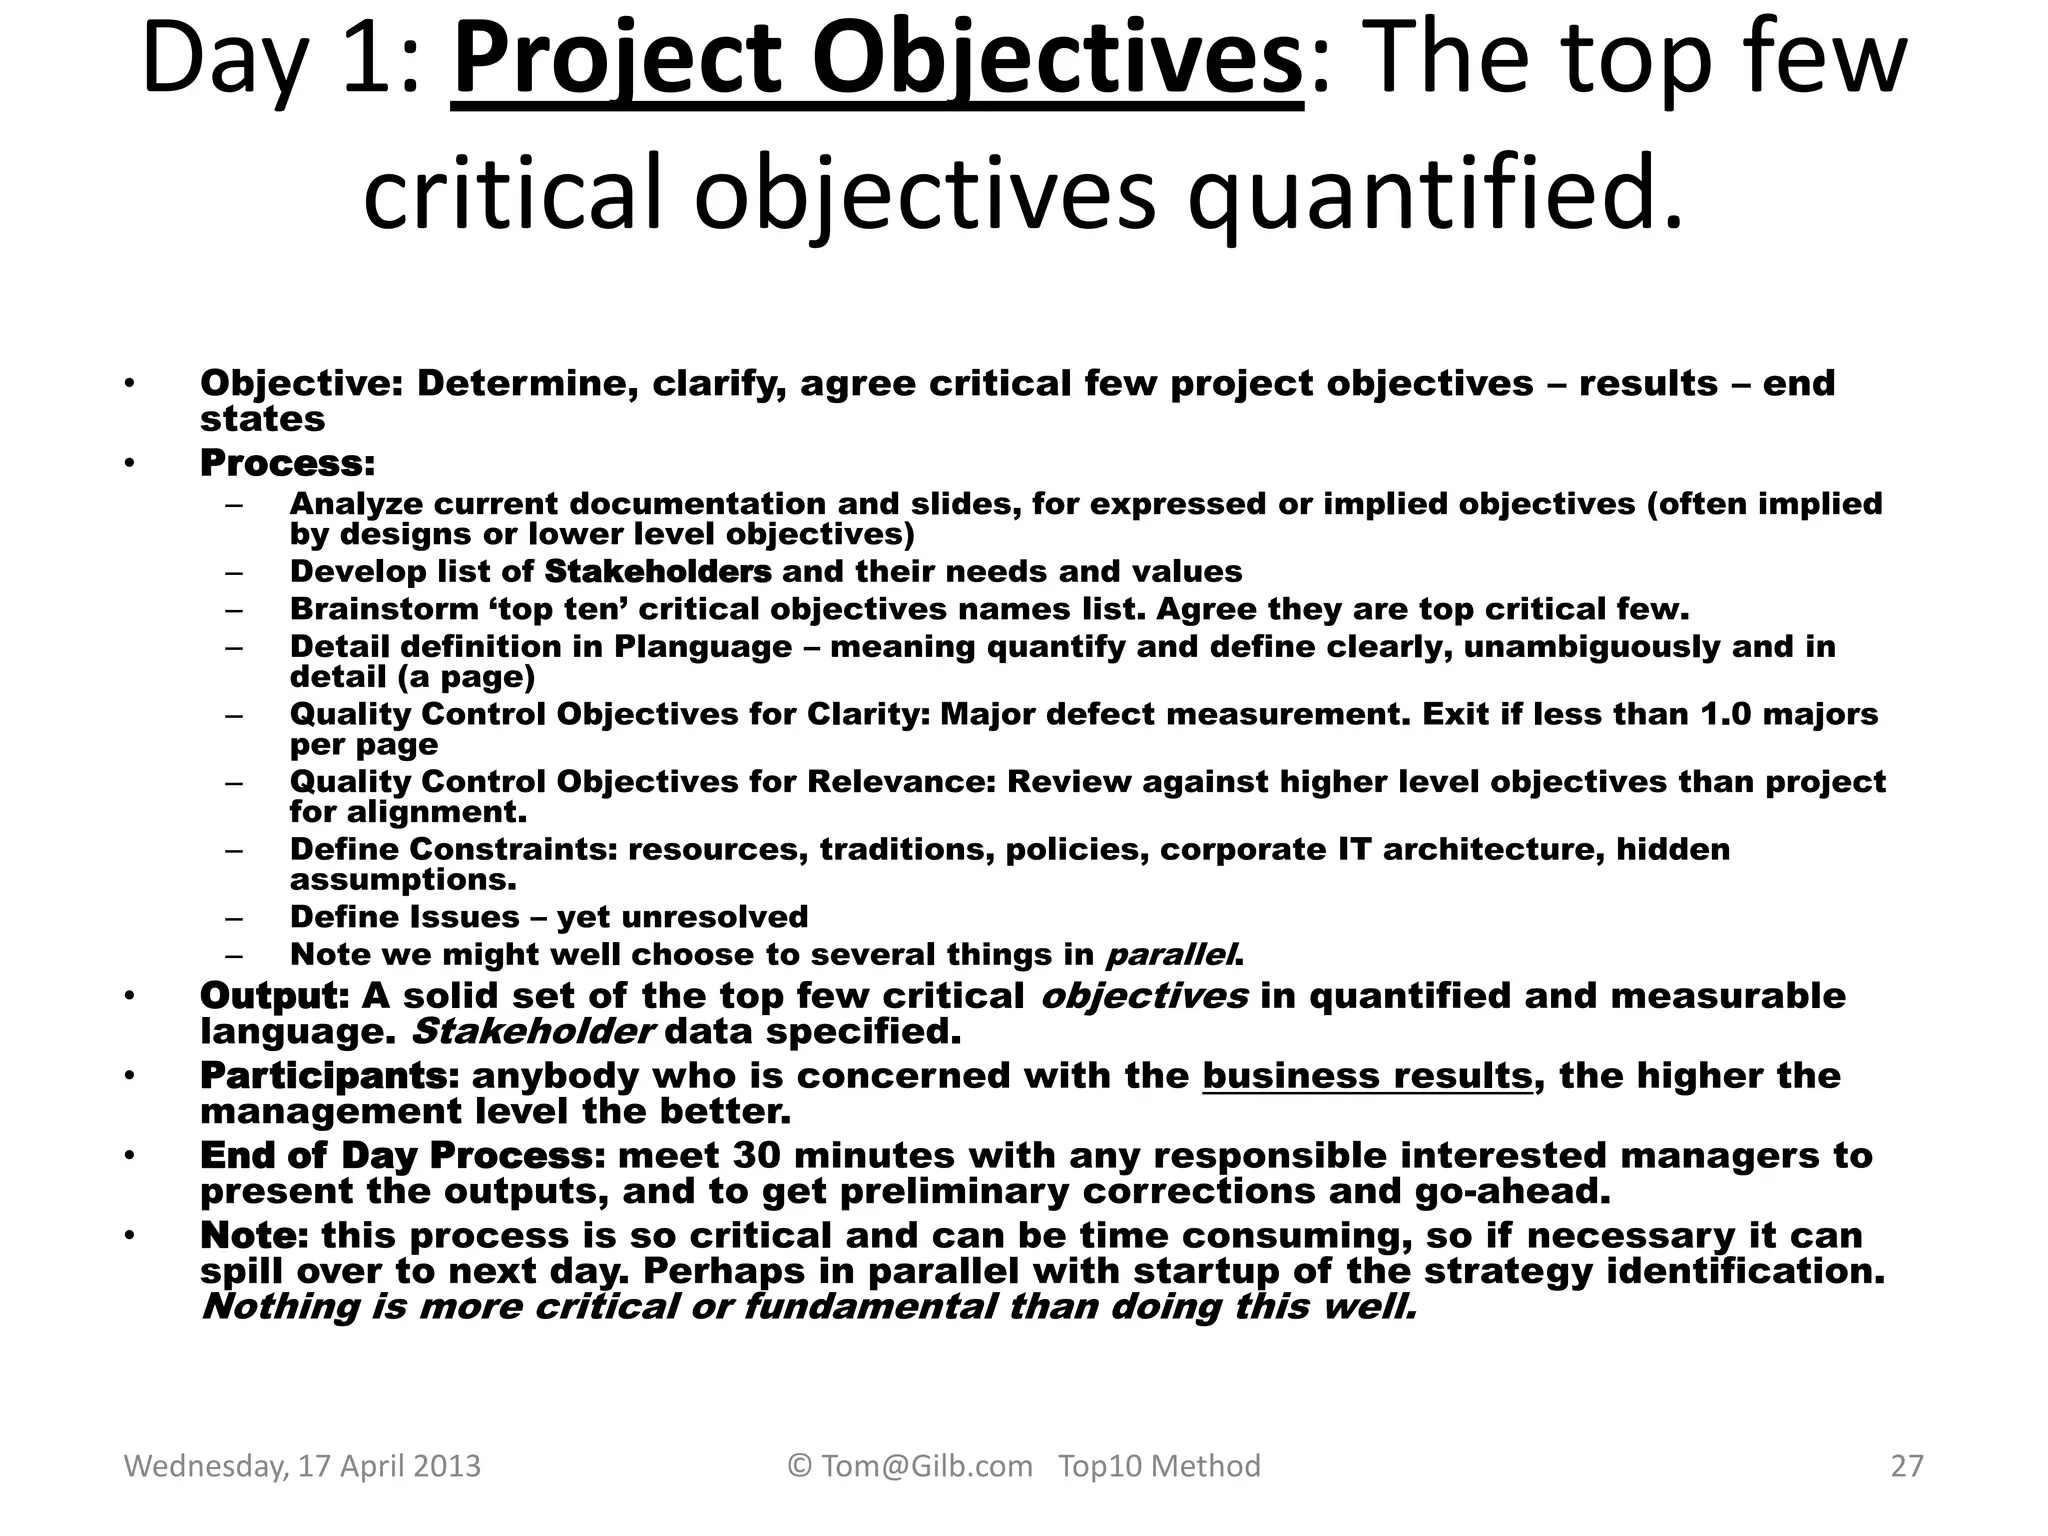
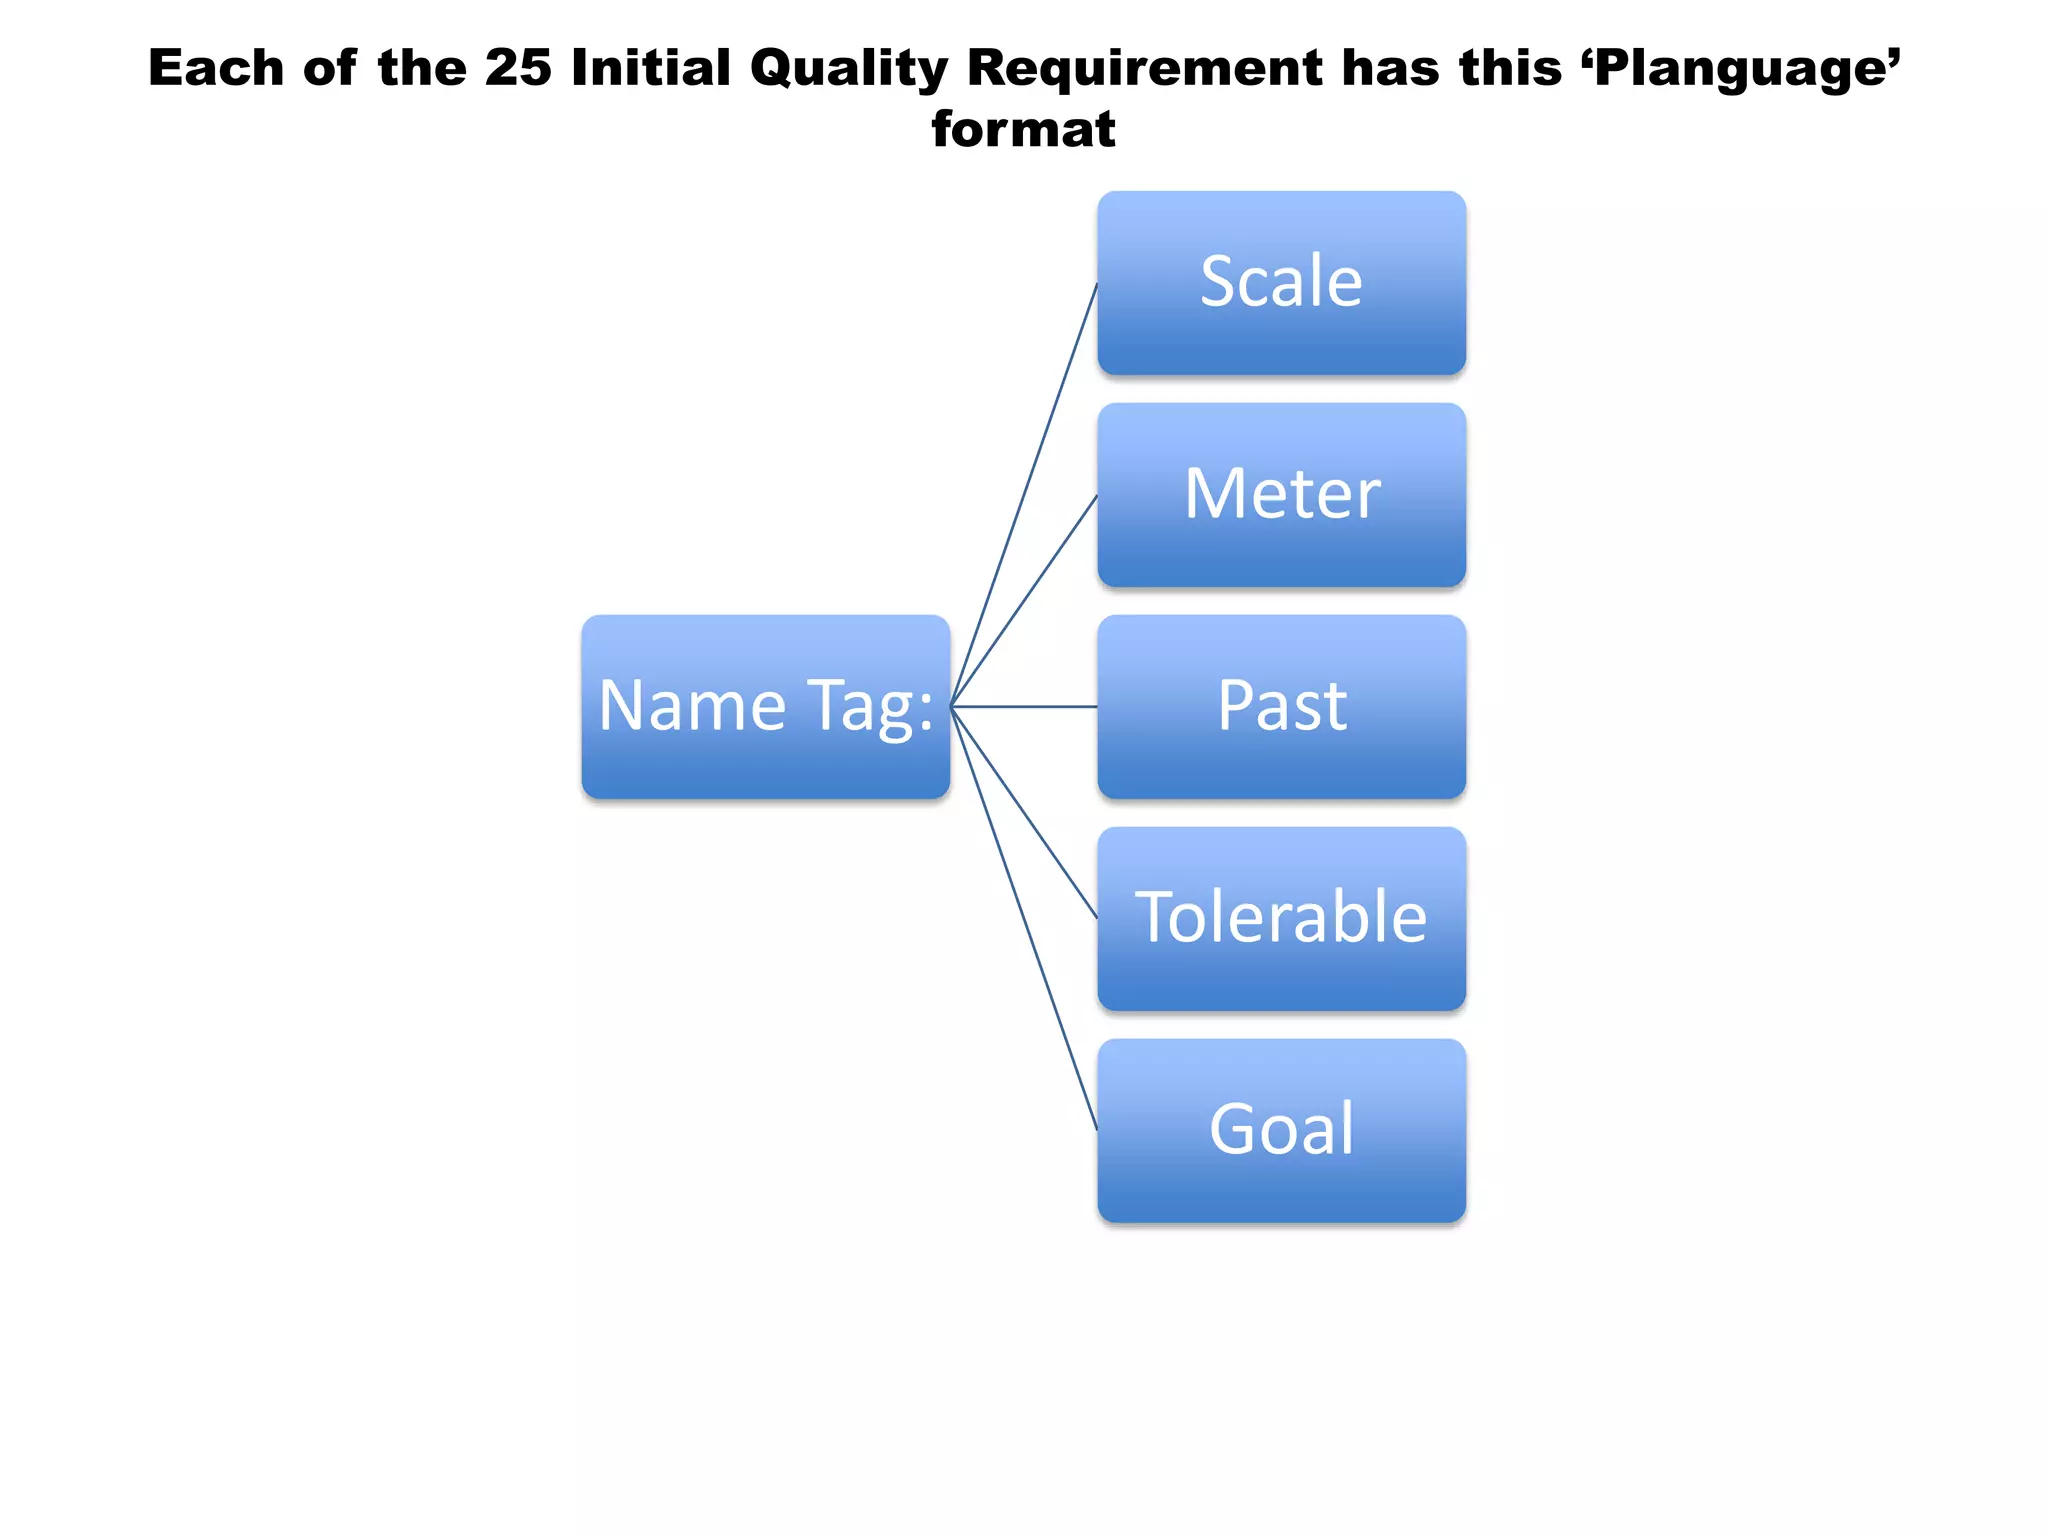
![PROJECT VALUE CLARITY:
2010 Bank top 10 Objectives quantified on day 1
P&L-Consistency&T P&L: Scale: total adjustments btw Flash/Predict and
Actual (T+1) signed off P&L. per day. Past 60 Goal: 15
Speed-To-Deliver: Scale: average Calendar days needed from New Idea
Approved until Idea Operational, for given Tasks, on given Markets.
Past [2009, Market = EURex, Task =Bond Execution] 2-3 months ?
Goal [Deadline =End 20xz, Market = EURex, Task =Bond Execution] 5
days
Operational-Control: Scale: % of trades per day, where the calculated
economic difference between OUR CO and Marketplace/Clients, is less
than “1 Yen”(or equivalent).
Past [April 20xx] 10% change this to 90% NH Goal [Dec. 20xy] 100%
Operational-Control.Consistent: Scale: % of defined [Trades] failing full
STP across the transaction cycle. Past [April 20xx, Trades=Voice Trades]
95%
Past [April 20xx, Trades=eTrades] 93%
Goal [April 20xz, Trades=Voice Trades] <95 ± 2%>
Goal [April 20xz, Trades=eTrades] 98.5 ± 0.5 %
Operational-Control.Timely.End&OvernightP&L Scale: number of
times, per quarter, the P&L information is not delivered timely to the
defined [Bach-Run].
Past [April 20xx, Batch-Run=Overnight] 1 Goal [Dec. 20xy, Batch-
Run=Overnight] <0.5> Past [April 20xx, Batch-Run= T+1] 1 Goal [Dec.
20xy, Batch-Run=End-Of-Day, Delay<1hour] 1
Operational-Control.Timely.IntradayP&L Scale: number of times per
day the intraday P&L process is delayed more than 0.5 sec.
Operational-Control.Timely.Trade-Bookings Scale: number of trades per
day that are not booked on trade date. Past [April 20xx] 20 ?
Front-Office-Trade-Management-Efficiency Scale: Time from Ticket
Launch to trade updating real-time risk view
Past [20xx, Function = Risk Mgt, Region = Global] ~ 80s +/- 45s ??
Goal [End 20xz, Function = Risk Mgt, Region = Global] ~ 50% better?
Managing Risk – Accurate – Consolidated – Real Time
Risk.Cross-Product Scale: % of financial products that risk metrics can
be displayed in a single position blotter in a way appropriate for the
trader (i.e. – around a benchmark vs. across the curve).
Past [April 20xx] 0% 95%. Goal [Dec. 20xy] 100%
Risk.Low-latency Scale: number of times per day the intraday risk
metrics is delayed by more than 0.5 sec. Past [April 20xx, NA] 1% Past
[April 20xx, EMEA] ??% Past [April 20xx, AP] 100% Goal [Dec. 20xy] 0%
Risk.Accuracy
Risk. user-configurable Scale: ??? pretty binary – feature is there or not
– how do we represent?
Past [April 20xx] 1% Goal [Dec. 20xy] 0%
Operational Cost Efficiency Scale: <Increased efficiency (Straight
through processing STP Rates )>
Cost-Per-Trade Scale: % reduction in Cost-Per-Trade
Goal (EOY 20xy, cost type = I 1 – REGION = ALL) Reduce cost by 60%
(BW)
Goal (EOY 20xy, cost type = I 2 – REGION = ALL) Reduce cost by x %
Goal (EOY 20xy, cost type = E1 – REGION = ALL) Reduce cost by x %
Goal (EOY 20xy, cost type = E 2 – REGION = ALL) Reduce cost by 100%
Goal (EOY 20xy, cost type = E 3 – REGION = ALL) Reduce cost by x %
17 April, 2013 © Gilb.com 29](https://image.slidesharecdn.com/gilbprojectmanagementdrivenbythetoptencriticalimprovementsquantifiedbcsapm15april2013-130417105854-phpapp02/75/Project-management-driven-by-the-top-ten-critical-improvements-qu-29-2048.jpg)
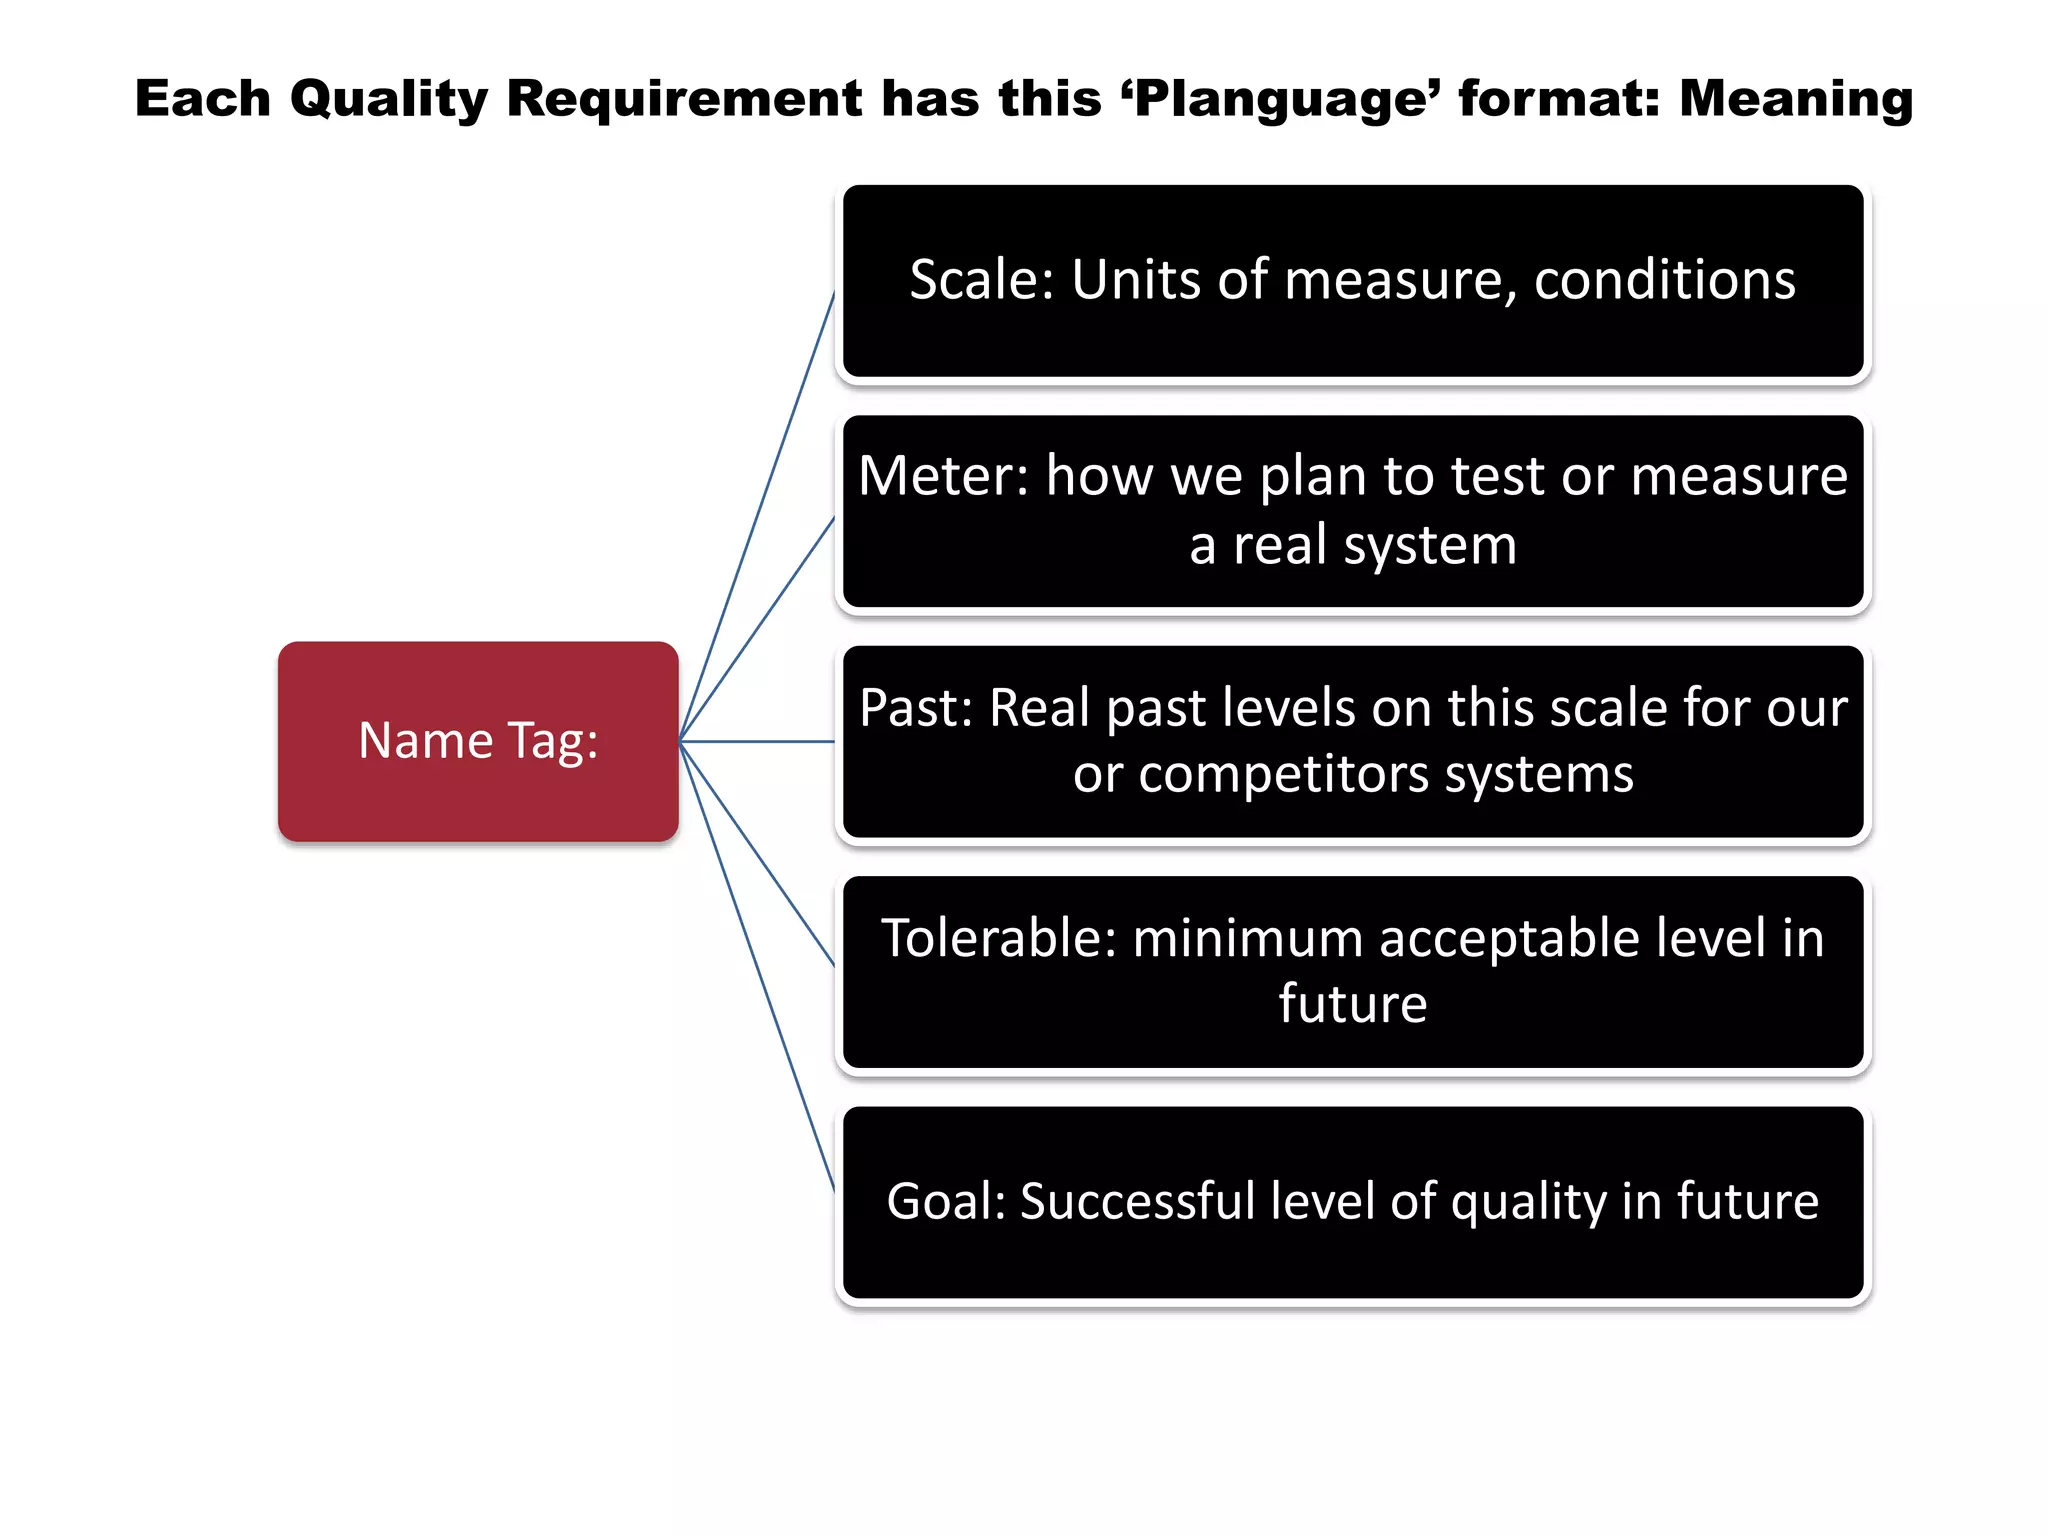
![Real Bank Project : Project Progress Testability
Quantification of the most-critical project objectives on day 1
P&L-Consistency&T P&L: Scale: total adjustments btw Flash/Predict and
Actual (T+1) signed off P&L. per day. Past 60 Goal: 15
Speed-To-Deliver: Scale: average Calendar days needed from New Idea
Approved until Idea Operational, for given Tasks, on given Markets.
Past [2009, Market = EURex, Task =Bond Execution] 2-3 months ?
Goal [Deadline =End 20xz, Market = EURex, Task =Bond Execution] 5
days
Operational-Control: Scale: % of trades per day, where the calculated
economic difference between OUR CO and Marketplace/Clients, is less
than “1 Yen”(or equivalent).
Past [April 20xx] 10% change this to 90% NH Goal [Dec. 20xy] 100%
Operational-Control.Consistent: Scale: % of defined [Trades] failing full
STP across the transaction cycle. Past [April 20xx, Trades=Voice Trades]
95%
Past [April 20xx, Trades=eTrades] 93%
Goal [April 20xz, Trades=Voice Trades] <95 ± 2%>
Goal [April 20xz, Trades=eTrades] 98.5 ± 0.5 %
Operational-Control.Timely.End&OvernightP&L Scale: number of
times, per quarter, the P&L information is not delivered timely to the
defined [Bach-Run].
Past [April 20xx, Batch-Run=Overnight] 1 Goal [Dec. 20xy, Batch-
Run=Overnight] <0.5> Past [April 20xx, Batch-Run= T+1] 1 Goal [Dec.
20xy, Batch-Run=End-Of-Day, Delay<1hour] 1
Operational-Control.Timely.IntradayP&L Scale: number of times per
day the intraday P&L process is delayed more than 0.5 sec.
Operational-Control.Timely.Trade-Bookings Scale: number of trades per
day that are not booked on trade date. Past [April 20xx] 20 ?
Front-Office-Trade-Management-Efficiency Scale: Time from Ticket
Launch to trade updating real-time risk view
Past [20xx, Function = Risk Mgt, Region = Global] ~ 80s +/- 45s ??
Goal [End 20xz, Function = Risk Mgt, Region = Global] ~ 50% better?
Managing Risk – Accurate – Consolidated – Real Time
Risk.Cross-Product Scale: % of financial products that risk metrics can
be displayed in a single position blotter in a way appropriate for the
trader (i.e. – around a benchmark vs. across the curve).
Past [April 20xx] 0% 95%. Goal [Dec. 20xy] 100%
Risk.Low-latency Scale: number of times per day the intraday risk
metrics is delayed by more than 0.5 sec. Past [April 20xx, NA] 1% Past
[April 20xx, EMEA] ??% Past [April 20xx, AP] 100% Goal [Dec. 20xy] 0%
Risk.Accuracy
Risk. user-configurable Scale: ??? pretty binary – feature is there or not
– how do we represent?
Past [April 20xx] 1% Goal [Dec. 20xy] 0%
Operational Cost Efficiency Scale: <Increased efficiency (Straight
through processing STP Rates )>
Cost-Per-Trade Scale: % reduction in Cost-Per-Trade
Goal (EOY 20xy, cost type = I 1 – REGION = ALL) Reduce cost by 60%
(BW)
Goal (EOY 20xy, cost type = I 2 – REGION = ALL) Reduce cost by x %
Goal (EOY 20xy, cost type = E1 – REGION = ALL) Reduce cost by x %
Goal (EOY 20xy, cost type = E 2 – REGION = ALL) Reduce cost by 100%
Goal (EOY 20xy, cost type = E 3 – REGION = ALL) Reduce cost by x %
17 April, 2013 © Gilb.com 30
ONE PAGE PROJECT REQUIREMENTS QUANTIFIED
Operational-Control:
Scale: % of trades per day, where the
calculated economic difference between
OUR CO and Marketplace/Clients, is less
than “1 Yen”(or equivalent).
Past [April 20xx] 10%
Goal [Dec. 20xy] 100%
ONE PAGE PROJECT REQUIREMENTS QUANTIFIED](https://image.slidesharecdn.com/gilbprojectmanagementdrivenbythetoptencriticalimprovementsquantifiedbcsapm15april2013-130417105854-phpapp02/75/Project-management-driven-by-the-top-ten-critical-improvements-qu-30-2048.jpg)
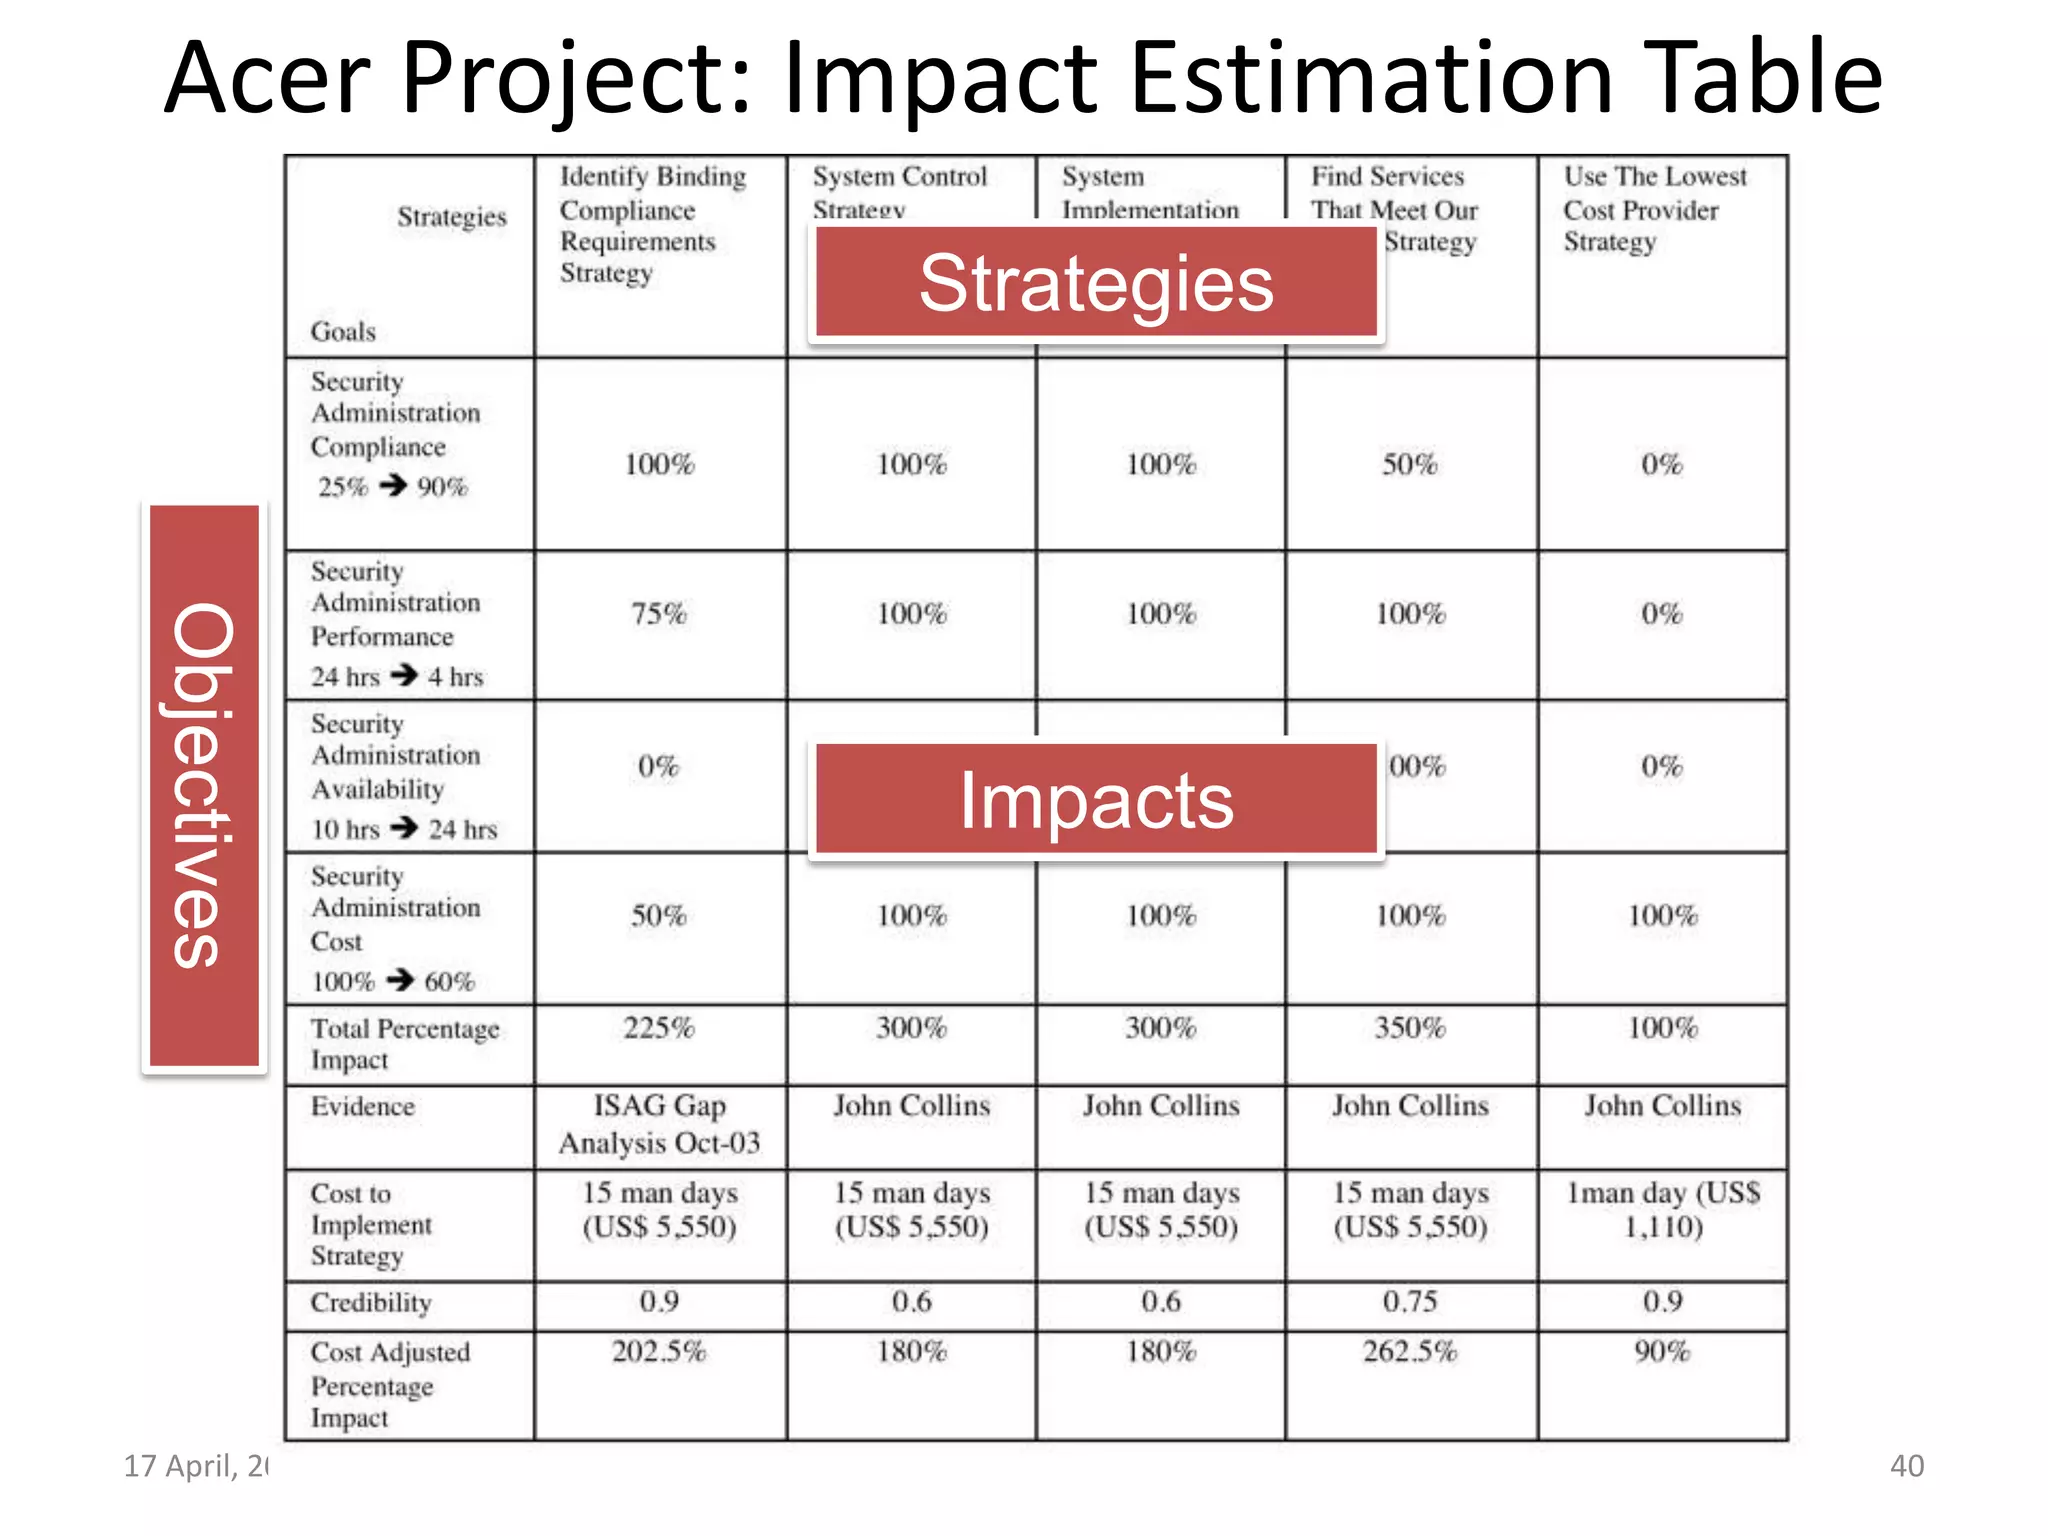
![Acer: Security Administration Compliance:
Security Administration Compliance:
Ambition: to become compliant and to remain continuously compliant with all current officially binding security administration requirements
both from THE CORP and Regulatory Authorities.
Scope: Account Opening and Entitlement Reporting.
Scale: % compliant with THE CORP Information Security Standards (CISS) [THE CORP Information Security Office (CISO)] on a defined
System or Process.
Note: CISS is an officially binding security administration requirement with which we must become compliant.
========= Benchmarks ===============================
Past [CISS = RSA and IBECS ISAG Compliance Matrix [Regional Security Administration and IBECS Independent Security Administration
Group, October 2003] 25% <- JC, Nov-03
Note: The RSA/IBECS Compliance Matrix originates from Otto Chan and is based on CISS.
========= Targets ===================================
Wish [Deadline = March 2004, Systems = High Criticality Systems] 100%
Wish [Deadline = June 2004, Systems = {Medium & Low} Criticality Systems] 100%
Note: Wishes are stakeholder valued levels that we are not yet sure we can deliver in practice, on time, so we are not promising anything yet,
just acknowledging the desire.
Goal [Deadline = March 2004, Systems = High Criticality Systems] 90% 5%
Goal [Deadline = June 2004, Systems = {Medium & Low} Criticality Systems] 90% 5%
Goal [Midline = February 2004] 50% 10% “intermediary goal short of 100%”
Note: Goal levels are what we think we can really promise and focus on. These types of goals push us into thinking about possible
Evolutionary result delivery steps.
Stretch [Deadline = March 2004, Systems = High Criticality Systems] 95% 5%
Stretch [Deadline = June 2004, Systems = {Medium & Low} Criticality Systems] 95% 5%
Note: Stretch levels are something that we might be able to achieve if we have sufficient resources, focus and technology available, but we
are not sure of that yet. We are NOT promising it now! So this is a way to hold the ideals up in case those things become available.
17 April, 2013 © Gilb.com 32
Quantified
Definition
Benchmarks = Systems Analysis
Values, unknown costs
Realistic Project
Targets Val/€
Values, if
enough
resources left](https://image.slidesharecdn.com/gilbprojectmanagementdrivenbythetoptencriticalimprovementsquantifiedbcsapm15april2013-130417105854-phpapp02/75/Project-management-driven-by-the-top-ten-critical-improvements-qu-32-2048.jpg)
![Acer: VERY TOP LEVEL PROJECT STRATEGIES
Note: These very top level project strategies specify how we are going to achieve the top level project goals.
Identify Binding Compliance Requirements Strategy:
Gist: Identify all officially binding security administration requirements with which we must become compliant both from THE CORP and Regulatory
Authorities.
System Control Strategy:
Gist: a formal system or process we can use to decide what characteristics a [system; default = appication] has with regard to our
compliance, performance, availability and cost goals
Note: an inspection process, for instance
Define and implement inspection for security administration-related business requirements specifications
Define and implement inspection for [systems; default = applications] which already exist in CitiTech environments
Note: systems include applications, databases, data service and machines. Project ACER ought to be extensible.
System Implementation Strategy:
Gist: a formal system or process we can use to actually change a [system; default = application] so that it meets our compliance, performance, availability
and cost goals
All systems ought to feed EERS
Publish best practices for developing security administration requirement specifications
Publish a security administration requirement specification template
Application technology managers are service providers in the formal change process, that are required to meet all project goals within defined timescales
Find Services That Meet Our Goals Strategy:
Gist: a formal system or process we can use to evaluate security administration services offered by internal and external services providers so that we can
meet our defined goals
Note: this strategy avoids pre-supposition that one solution is the only option (EG all applications must migrate to RSA and that RSA is the only security
administration services offering)
Use The Lowest Cost Provider Strategy:
Gist: use the services provider that meets all signed-off project goals for the lowest $US cost.
Note: if all project goals can be met by more than one services provider, the provider offering the lowest $US cost for meeting the goals and no more than
the goals ought to be used
17 April, 2013 © Gilb.com 34
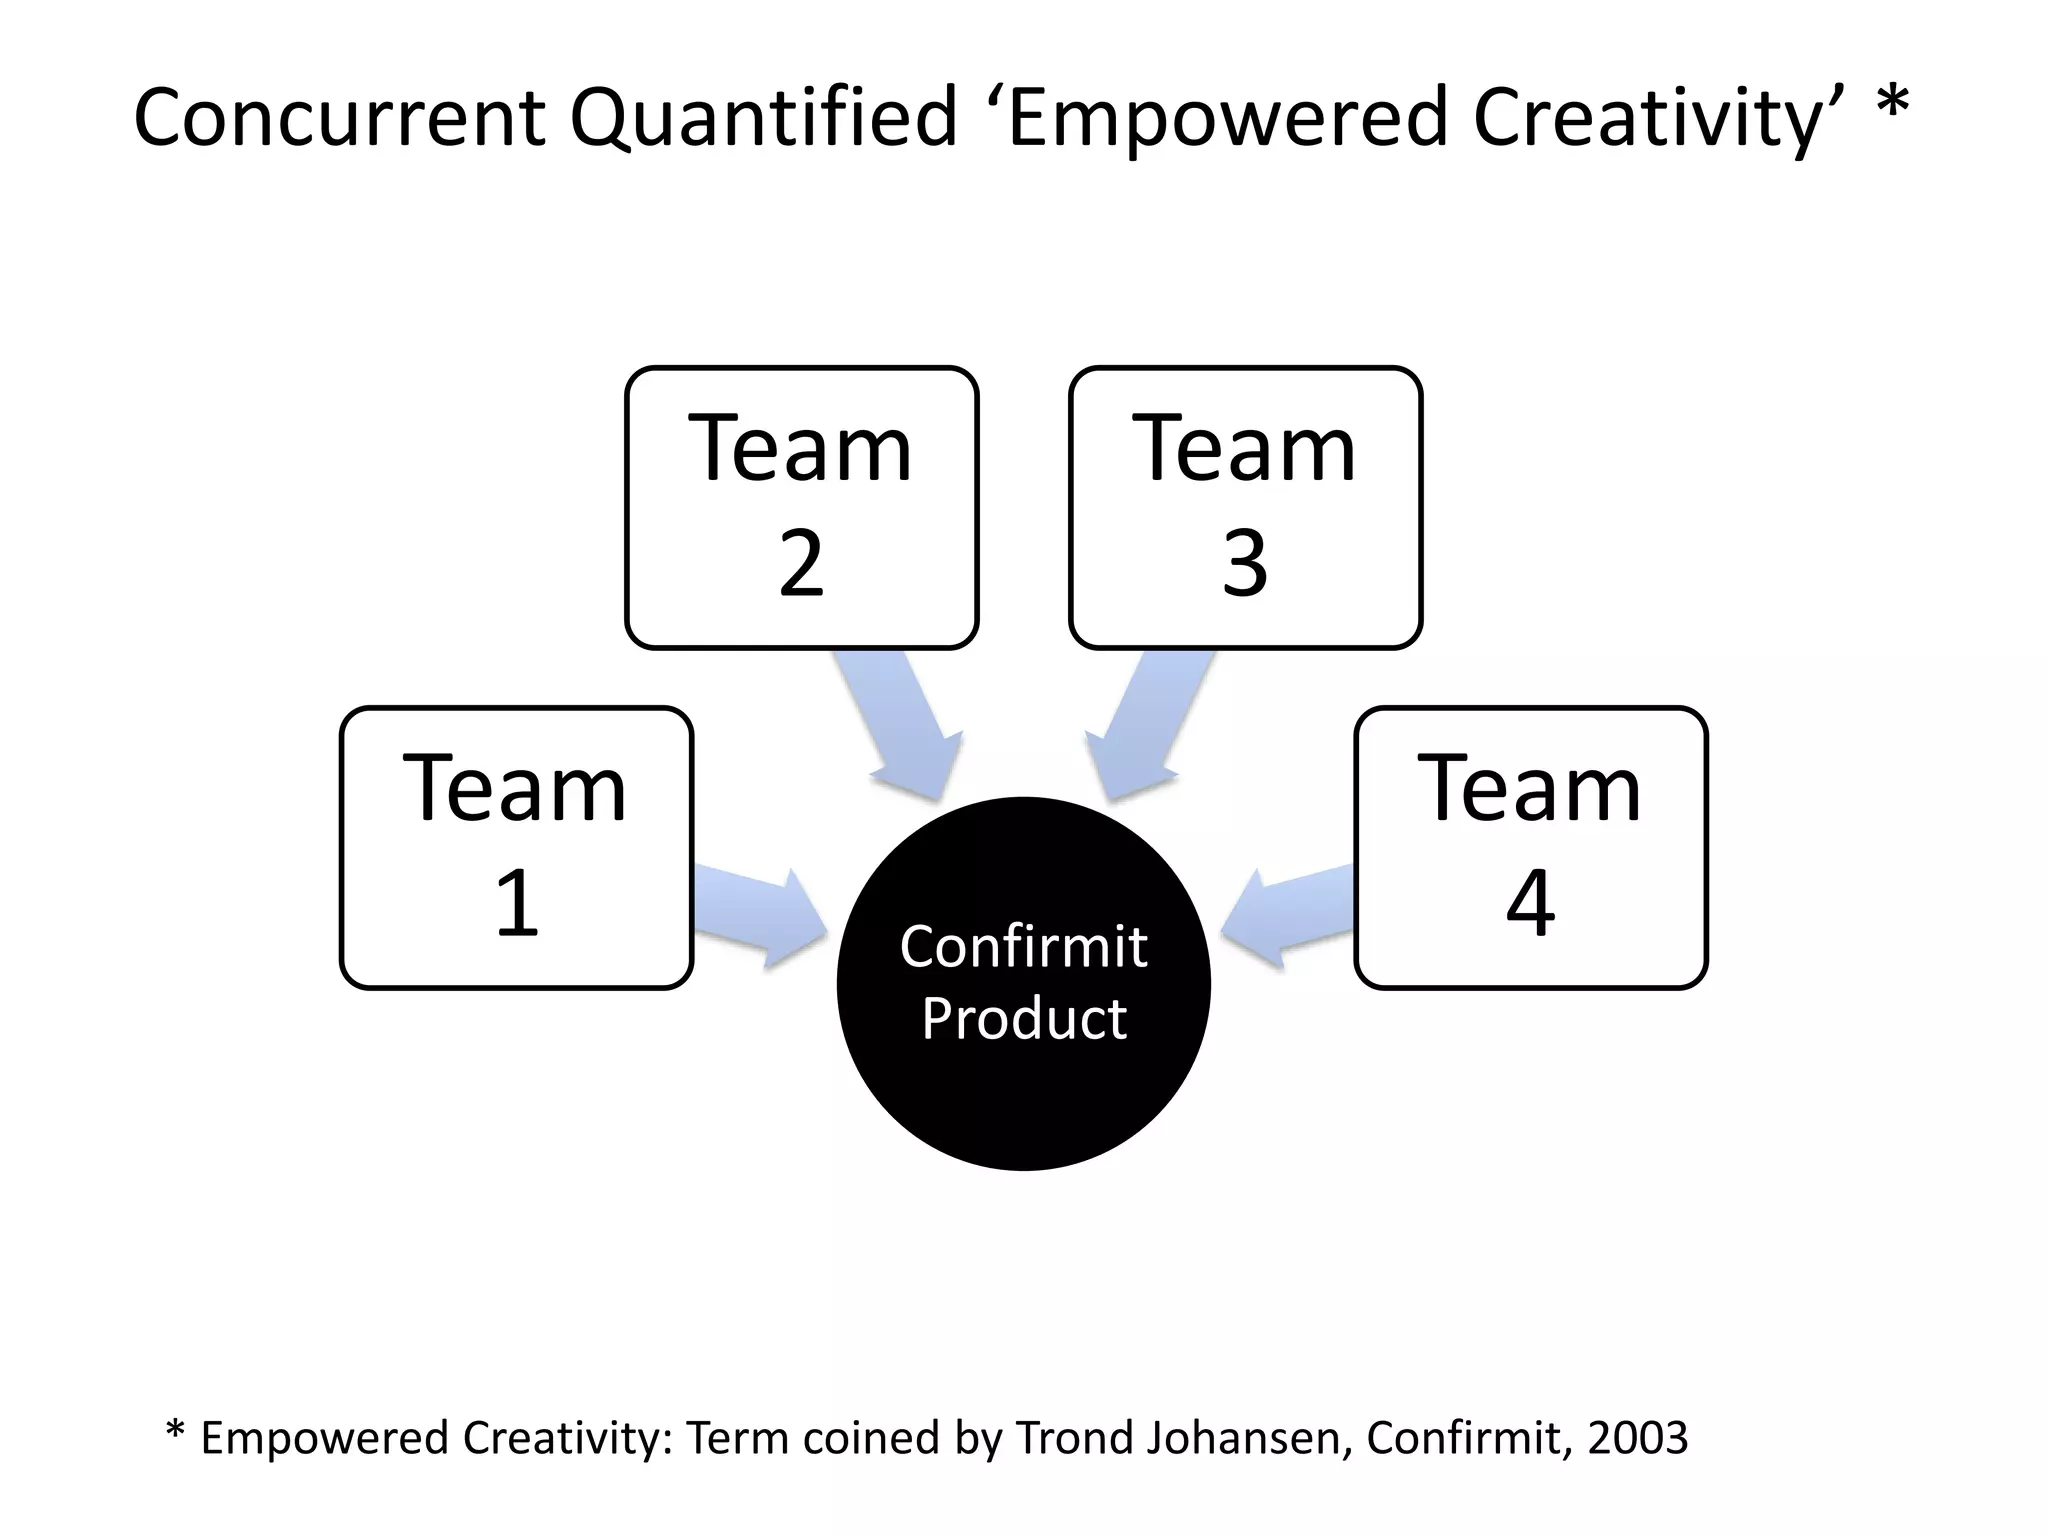
How much do these strategies cost?
How much impact on our 4 Goals
do these strategies have?](https://image.slidesharecdn.com/gilbprojectmanagementdrivenbythetoptencriticalimprovementsquantifiedbcsapm15april2013-130417105854-phpapp02/75/Project-management-driven-by-the-top-ten-critical-improvements-qu-34-2048.jpg)


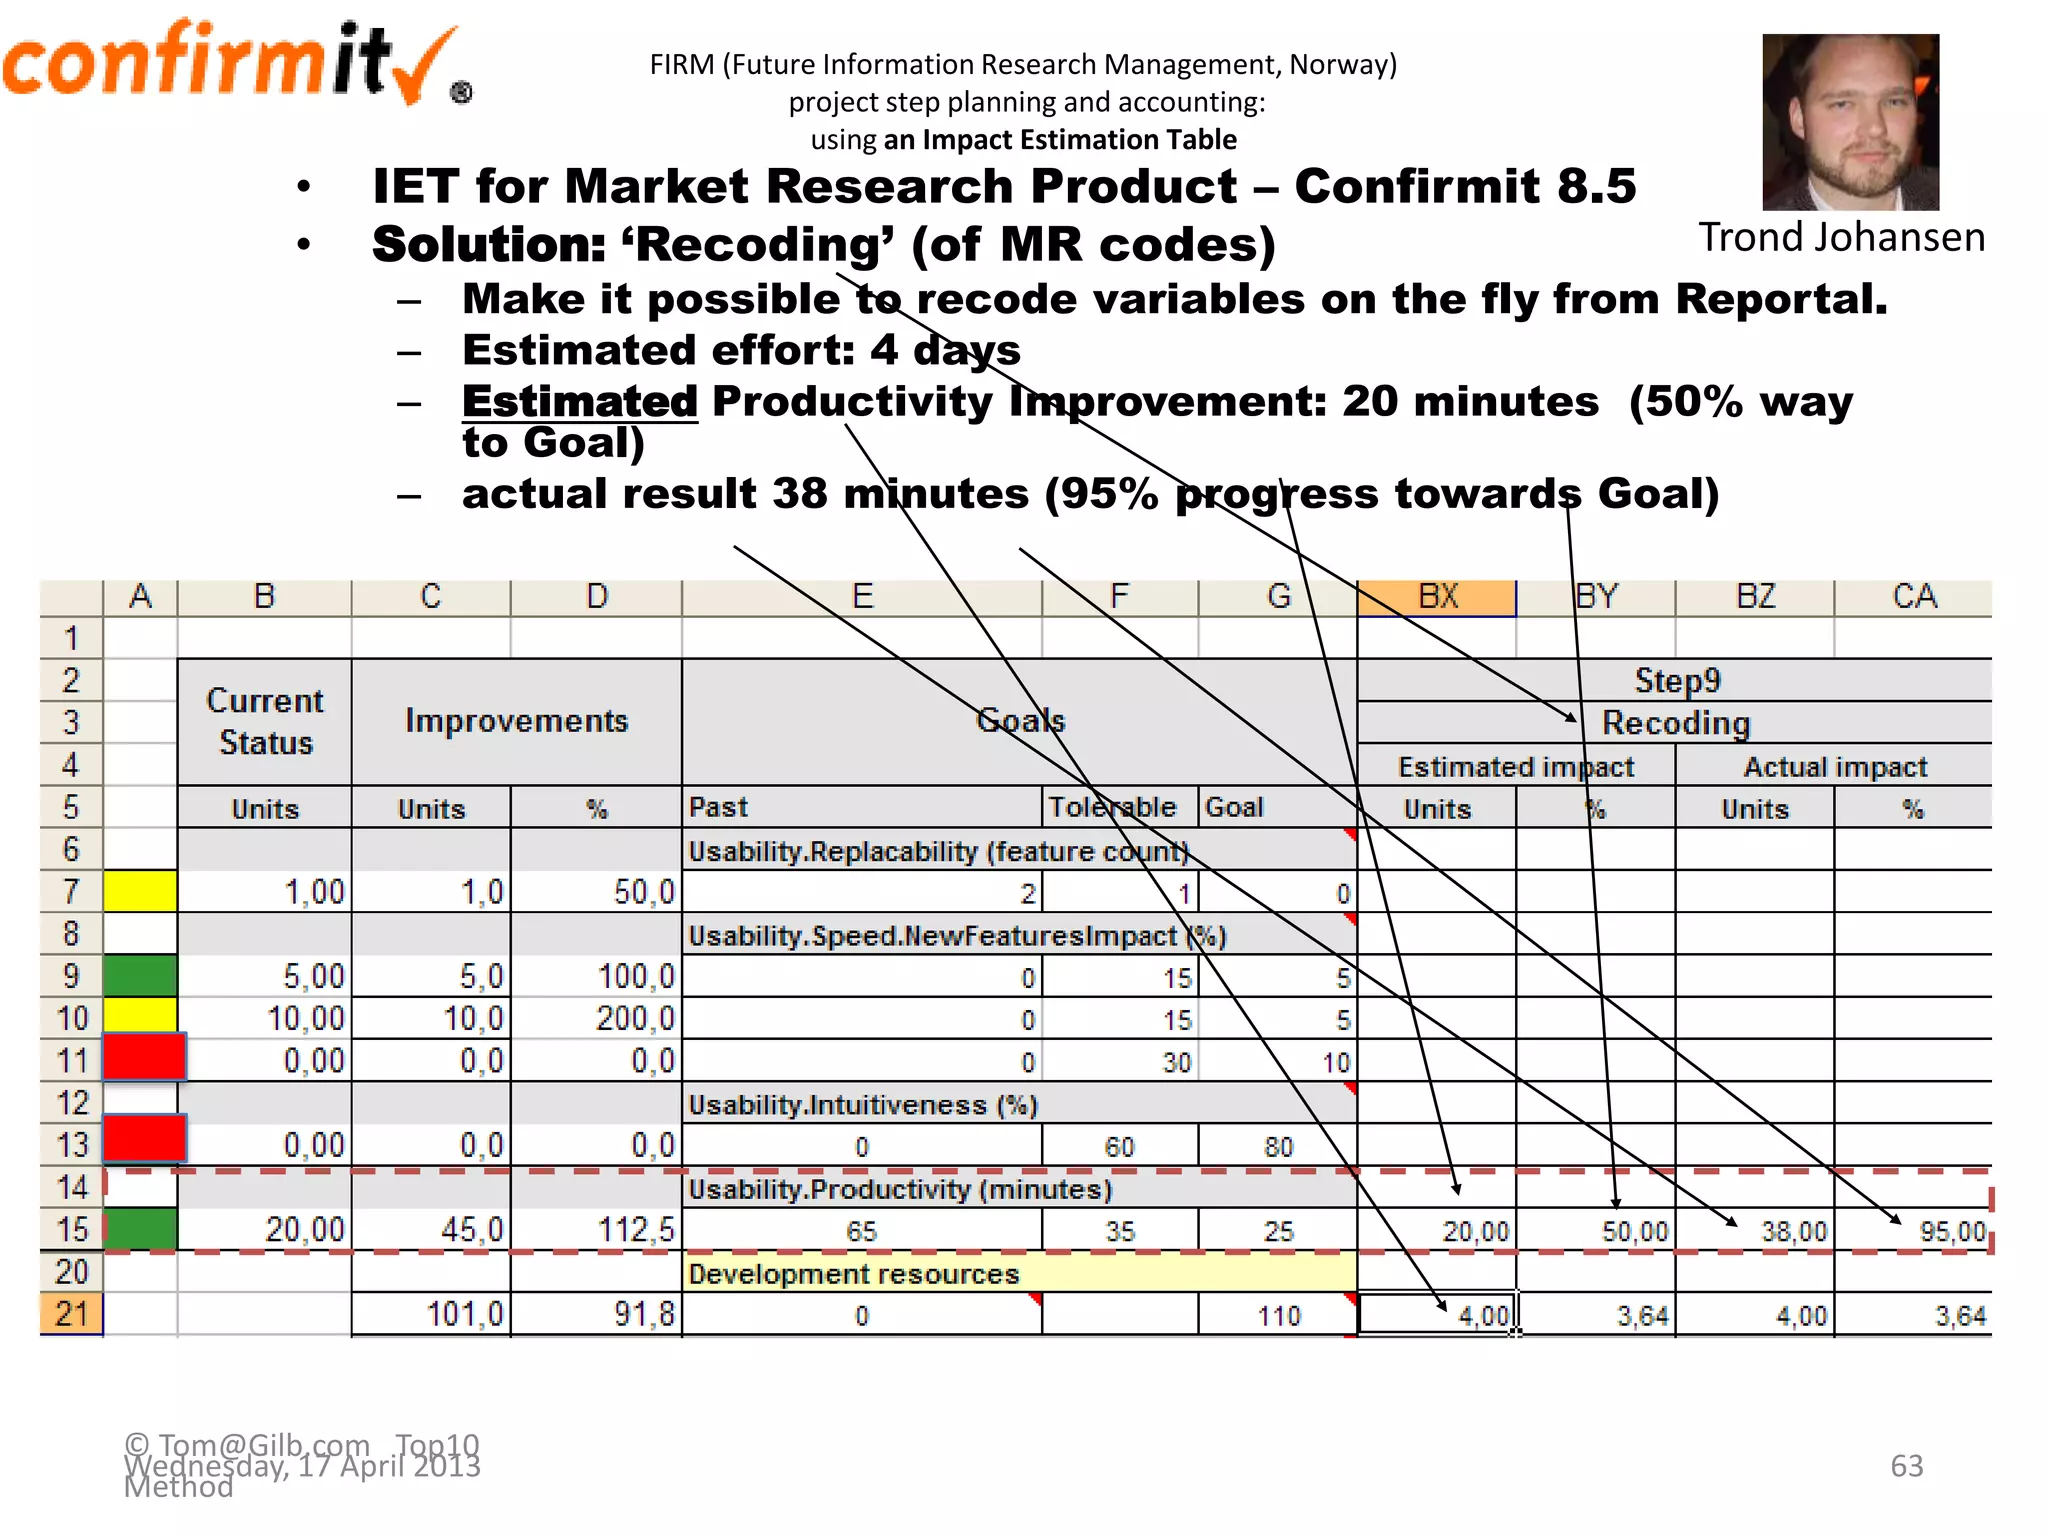
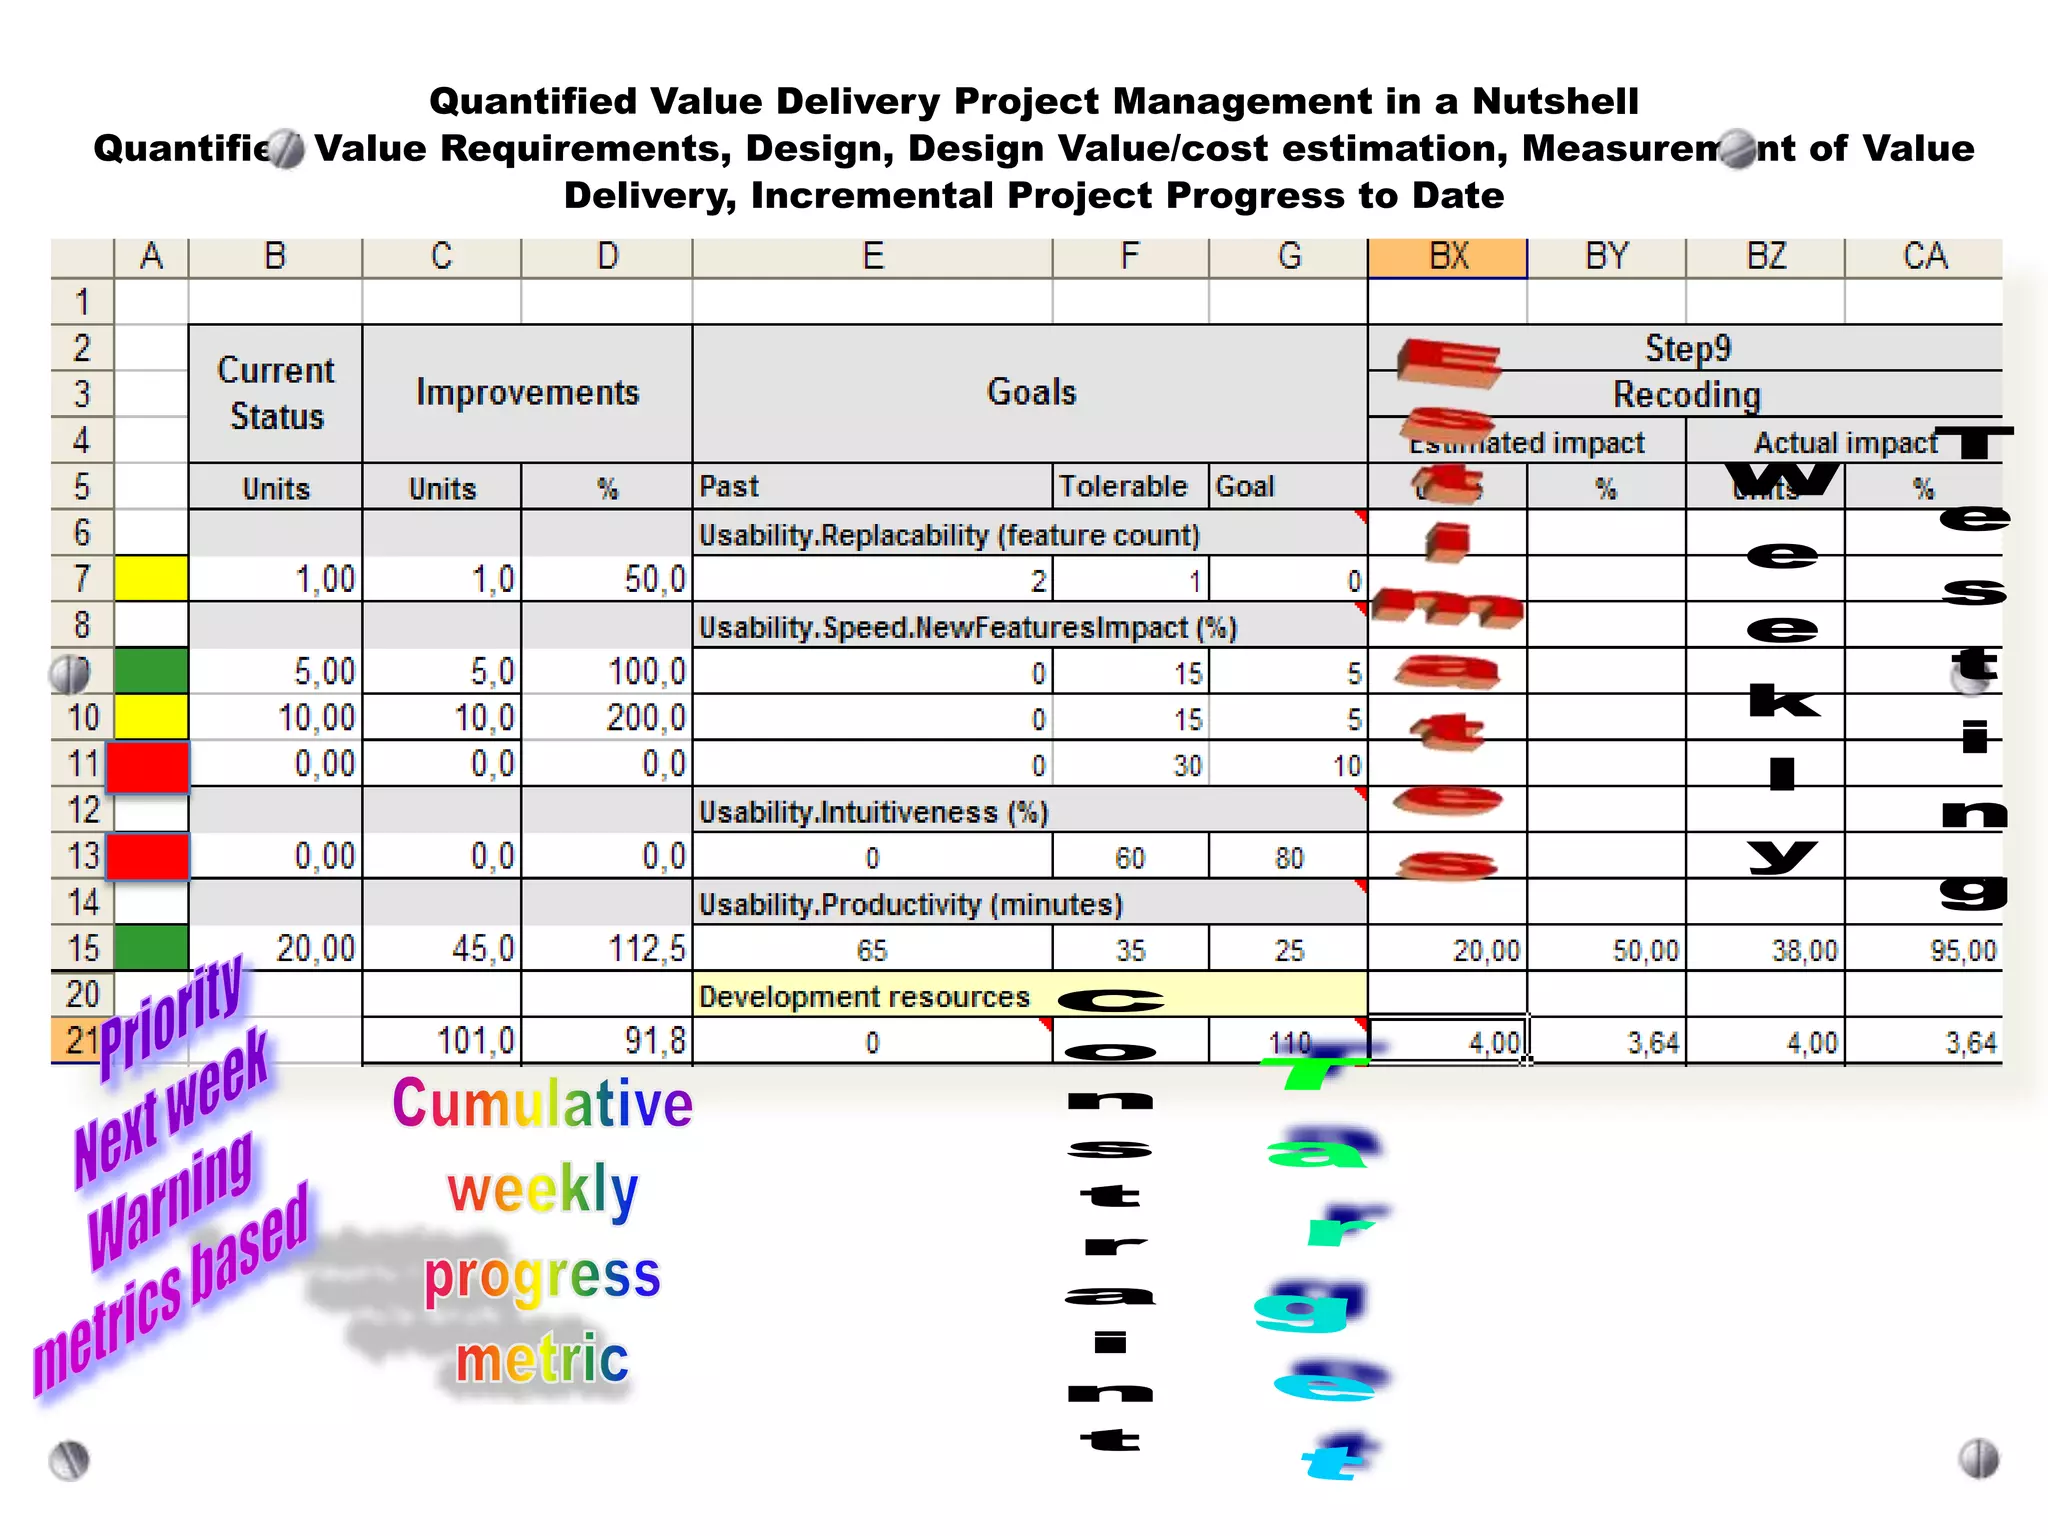
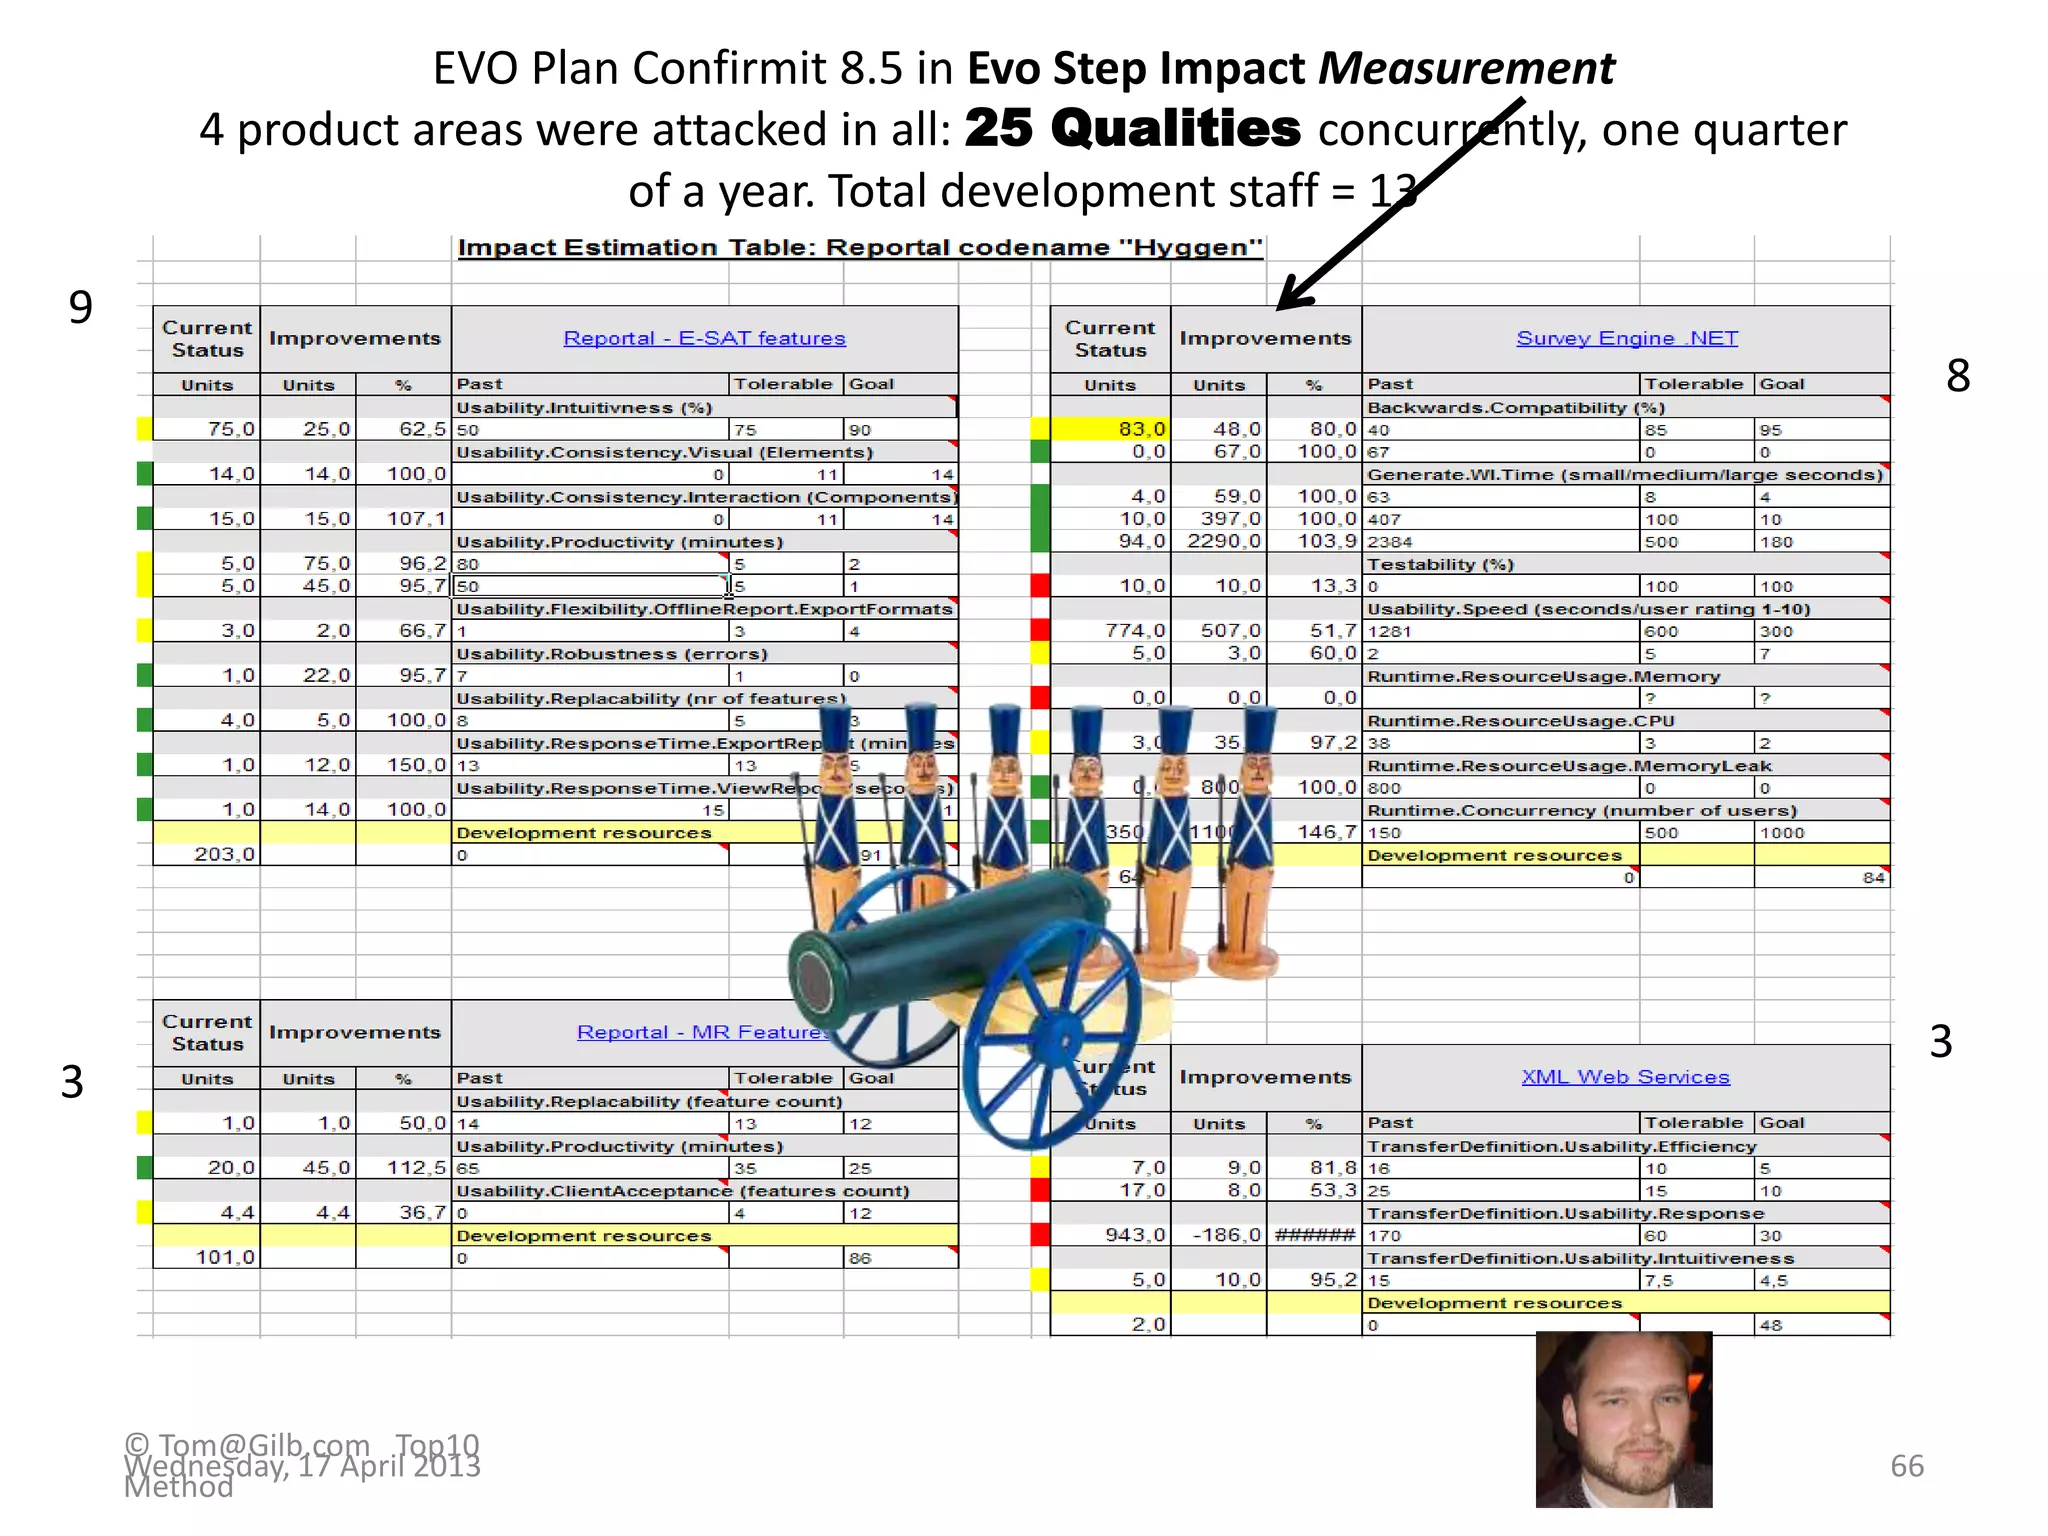
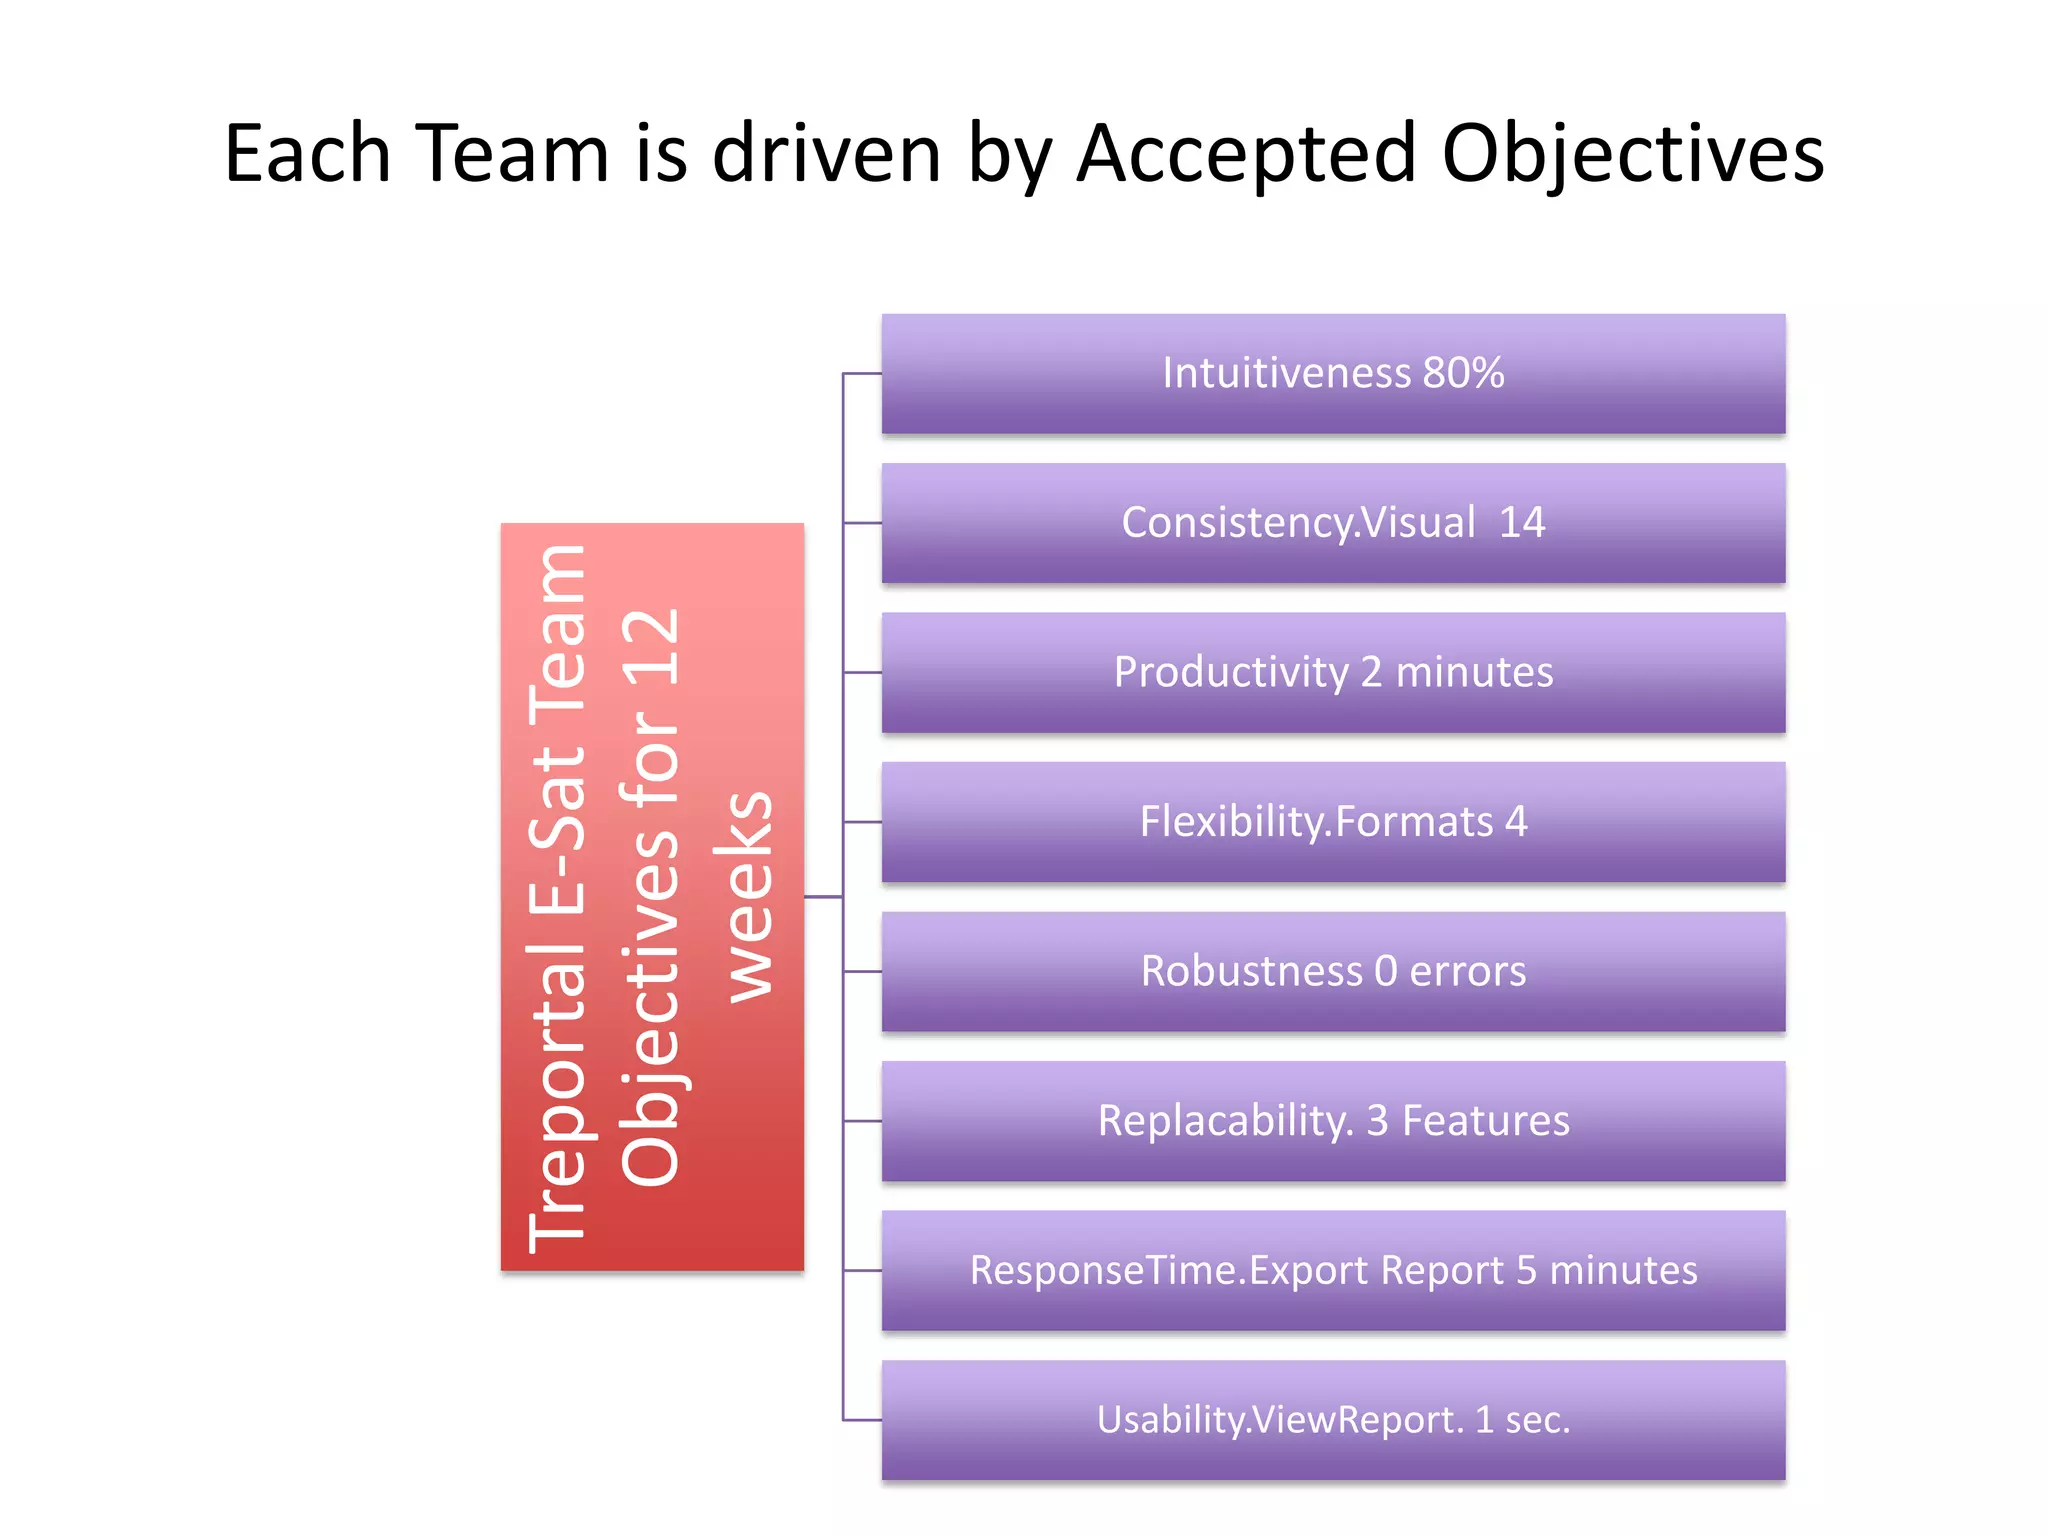
![Each Quality Requirement has this „Planguage‟ format: Real Example
Usability.
Productivity
Scale: Time in minutes to set up a typical
specified market research-report
Meter [Weekly Step]: Candidates with
Reportal experience, and with
knowledge of MR-specific reporting
features
Past [Release 8.0] 65 minutes
Tolerable [Release 8.5] 35 minutes
Goal [Release 8.5] 25 minutes](https://image.slidesharecdn.com/gilbprojectmanagementdrivenbythetoptencriticalimprovementsquantifiedbcsapm15april2013-130417105854-phpapp02/75/Project-management-driven-by-the-top-ten-critical-improvements-qu-61-2048.jpg)
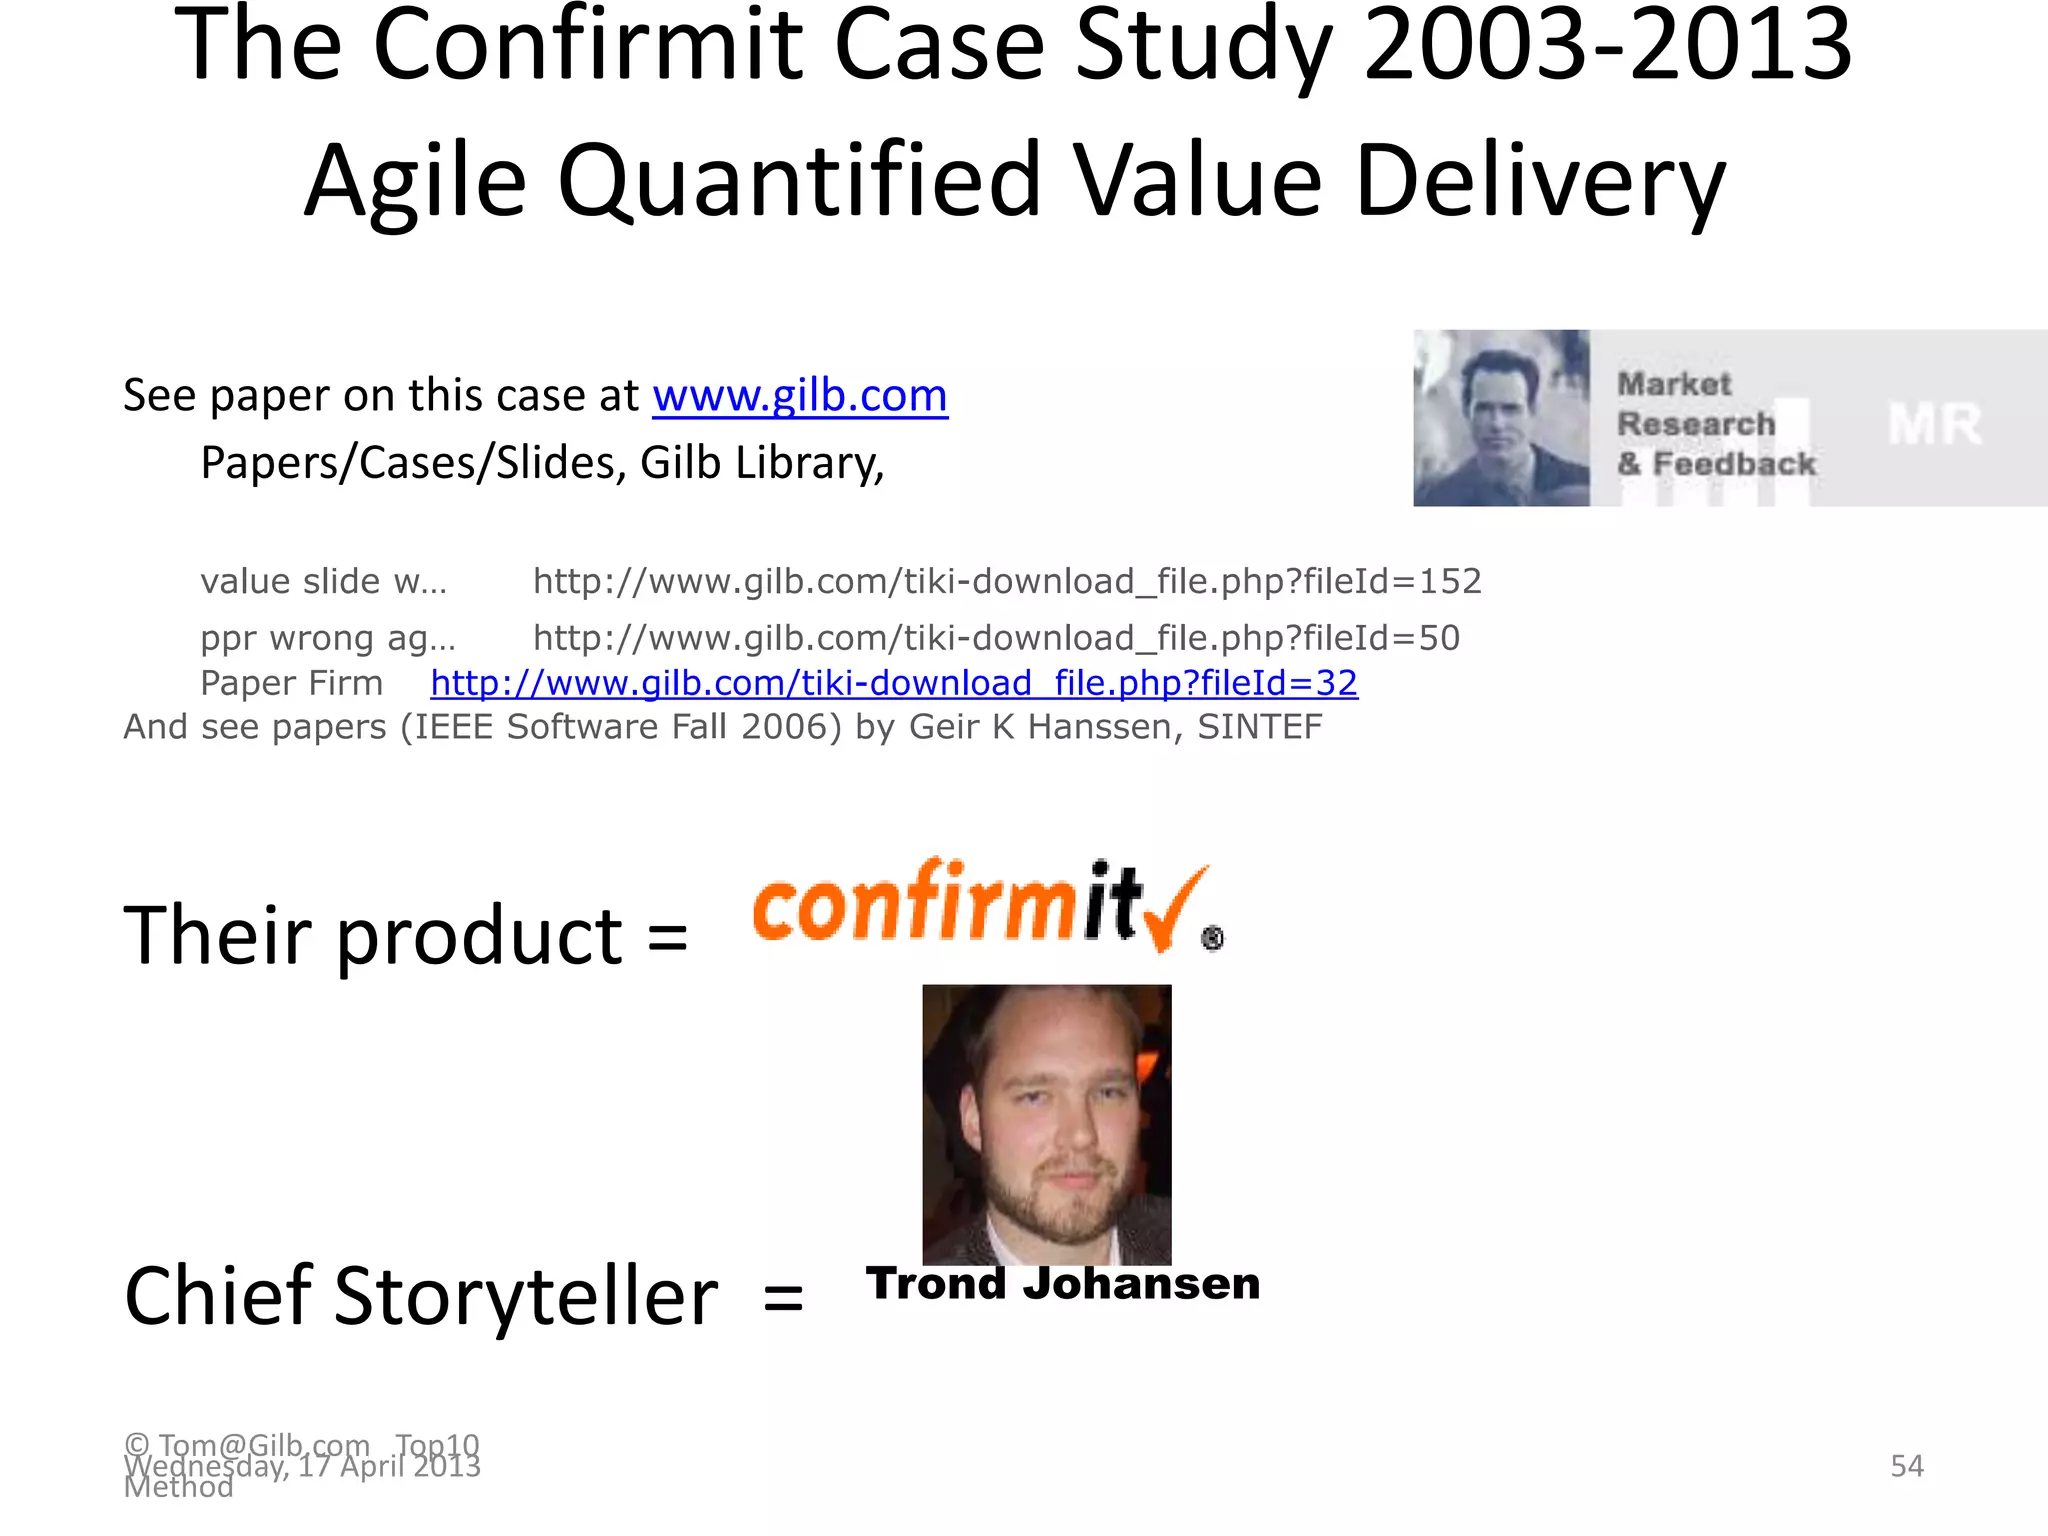
![Real Example of 1 of the 25 Quality Requirements
Usability.Productivity (taken from Confirmit
8.5, performed a set of predefined steps, to produce a
standard MR Report.
development)
Scale for quantification: Time in minutes to set up a
typical specified Market Research-report
Past Level [Release 8.0]: 65 mins.,
Tolerable Limit [Release 8.5]: 35 mins.,
Goal [Release 8.5]: 25 mins.
Note: end result was actually 20
minutes
Meter [Weekly Step]: Candidates with Reportal
experience, and with knowledge of MR-specific
reporting features
62
Trond Johansen© Tom@Gilb.com Top10
Method
Wednesday, 17 April 2013](https://image.slidesharecdn.com/gilbprojectmanagementdrivenbythetoptencriticalimprovementsquantifiedbcsapm15april2013-130417105854-phpapp02/75/Project-management-driven-by-the-top-ten-critical-improvements-qu-62-2048.jpg)


The document discusses evolutionary project management, emphasizing the need for clarity in critical project objectives to deliver real value early in IT projects. It critiques traditional project management methods for their lack of value delivery tracking and adaptability to changes. The presentation highlights the importance of quantifying objectives and employing structured methods to drive effective project outcomes, supported by case studies from the banking and military sectors.