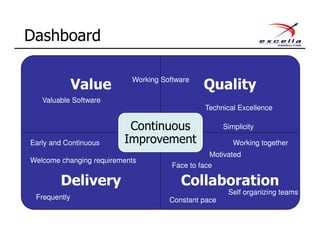
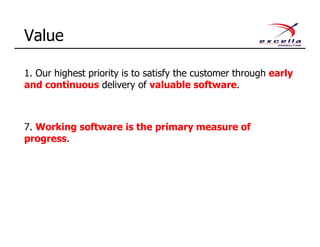
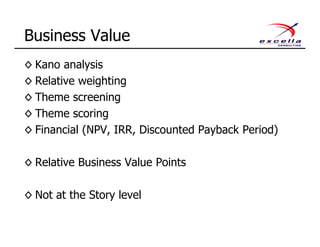
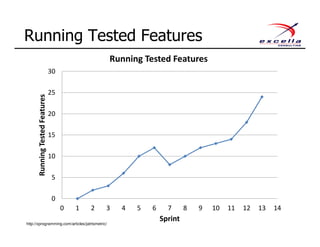
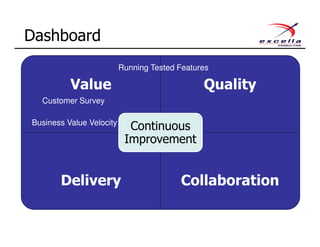
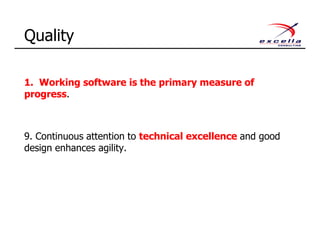
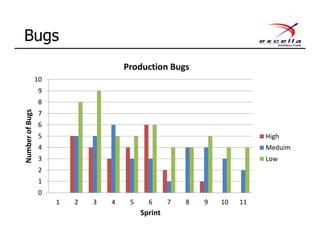
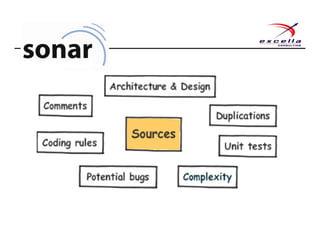
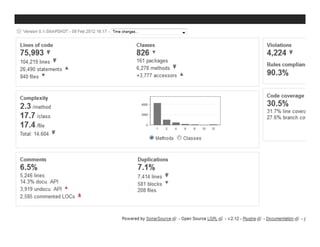
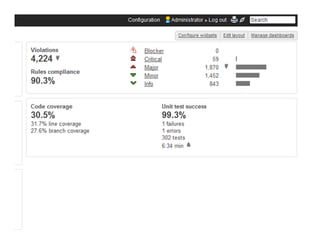
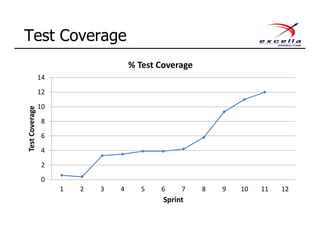
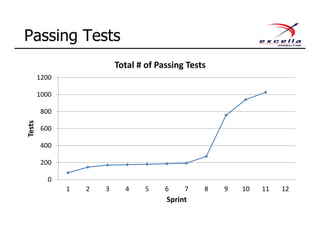
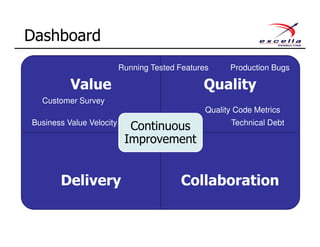
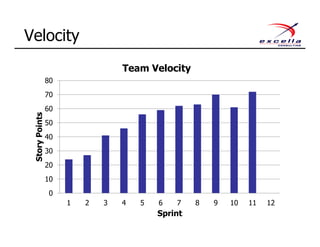
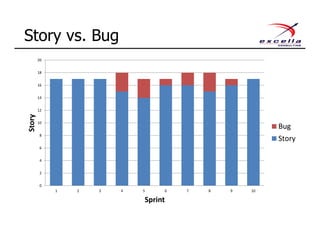
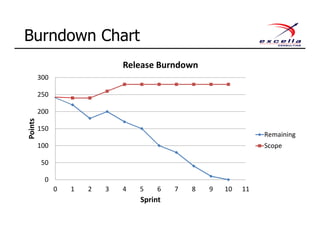
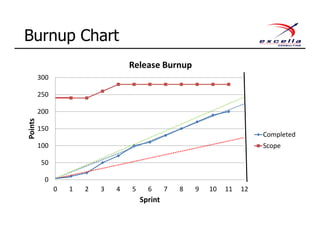
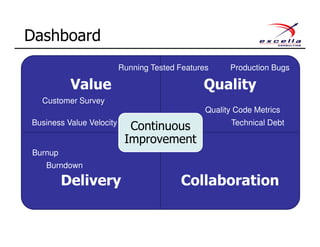
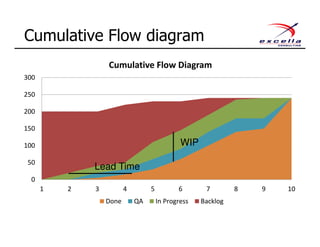
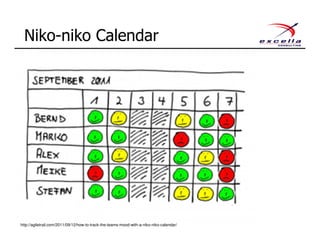
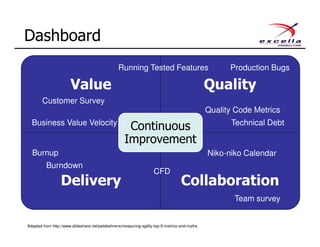
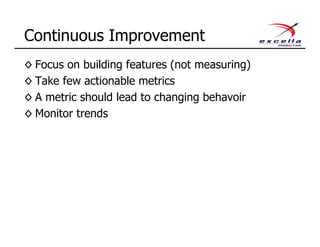
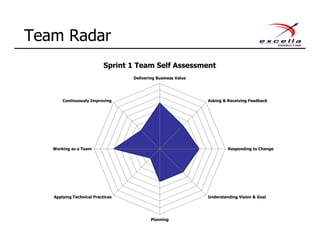
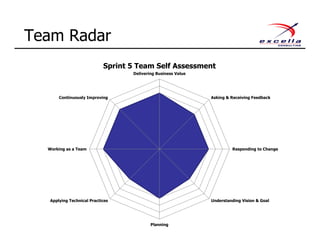
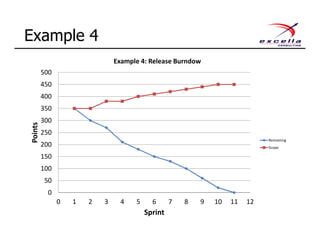
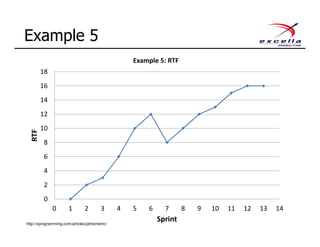
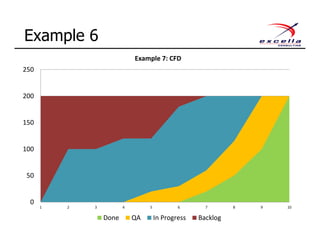
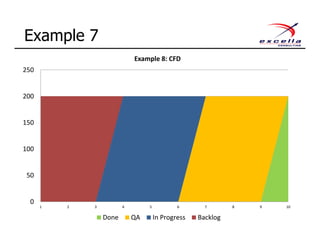
The Agile Dashboard
By Fadi Stephan
While we are waiting for the session to start, chat
with your neighbors:
– Are you on an Agile team?
– How many members are on the team?
– How long are your iterations?
– What’s your team’s velocity?
Chat with your Neighbors
◊ Team’s capacity to complete work per iteration
◊ An Empirical observation
◊ A leading indicator
◊ For the entire team and not the individual member
◊ Different for each team
◊ Great for planning purposes
◊ Not an estimate
◊ Not a target
Velocity
Fadi Stephan
◊ 15+ years of experience in software
development
◊ Focused on Agile and Scrum since 2006
– Agile readiness & maturity
assessments
– Scrum coaching & mentoring
– Scrum and Agile Engineering training
◊ Founder of the DC Software
Craftsmanship User Group
◊ Organizer of the DC Scrum User Group
Why Measure?
Iron Triangle
Value
Driven
Cost Schedule
Scope
1. Our highest priority is to satisfy the customer through early and continuous delivery of valuable
software.
2. Welcome changing requirements, even late in development. Agile processes harness change for the
customer's competitive advantage.
3. Deliver working software frequently, from a couple of weeks to a couple of months, with a preference
to the shorter timescale.
4. Business people and developers must work together daily throughout the project.
5. Build projects around motivated individuals. Give them the environment and support they need, and
trust them to get the job done.
6. The most efficient and effective method of conveying information to and within a development team
is face-to-face conversation.
7. Working software is the primary measure of progress.
8. Agile processes promote sustainable development. The sponsors, developers, and users should be
able to maintain a constant pace indefinitely.
9. Continuous attention to technical excellence and good design enhances agility.
10. Simplicity--the art of maximizing the amount of work not done--is essential.
11. The best architectures, requirements, and designs emerge from self-organizing teams.
12. At regular intervals, the team reflects on how to become more effective, then tunes and adjusts its
behavior accordingly.
Agile Principles
◊ Read the principles behind the Agile manifesto
◊ For each principle determine
– What should be measured?
– How do we measure it?
Agile Metrics
1. Our highest priority is to satisfy the customer through early and continuous delivery of
valuable software.
2. Welcome changing requirements, even late in development. Agile processes harness
change for the customer's competitive advantage.
3. Deliver working software frequently, from a couple of weeks to a couple of months, with a
preference to the shorter timescale.
4. Business people and developers must work together daily throughout the project.
5. Build projects around motivated individuals. Give them the environment and support they need,
and trust them to get the job done.
6. The most efficient and effective method of conveying information to and within a development team is
face-to-face conversation.
7. Working software is the primary measure of progress.
8. Agile processes promote sustainable development. The sponsors, developers, and users should be able to
maintain a constant pace indefinitely.
9. Continuous attention to technical excellence and good design enhances agility.
10. Simplicity--the art of maximizing the amount of work not done--is essential.
11.The best architectures, requirements, and designs emerge from self-organizing teams.
12.At regular intervals, the team reflects on how to become more effective, then tunes and adjusts
its behavior accordingly.
Agile Principles
Iron Triangle
Value
Driven
Cost Schedule
Scope
Agile Triangle
Quality
Value
Cost Schedule
Scope
Constraints
http://jimhighsmith.com/beyond-scope-schedule-and-cost-the-agile-triangle/
Value Quality
Delivery Collaboration
Continuous
Improvement
Dashboard
Valuable Software
Early and Continuous
Welcome changing requirements
Frequently
Working together
Motivated
Face to face
Constant pace
Self organizing teams
Technical Excellence
Simplicity
Working Software
1. Our highest priority is to satisfy the customer through early
and continuous delivery of valuable software.
7. Working software is the primary measure of
progress.
Value
Customer Satisfaction Survey
◊ How satisfied are you
with the latest
release?
◊ How likely are you to
recommend the
product to others?
◊ Kano analysis
◊ Relative weighting
◊ Theme screening
◊ Theme scoring
◊ Financial (NPV, IRR, Discounted Payback Period)
◊ Relative Business Value Points
◊ Not at the Story level
Business Value
Running Tested Features
0
5
10
15
20
25
30
0 1 2 3 4 5 6 7 8 9 10 11 12 13 14
RunningTestedFeatures
Sprint
Running Tested Features
http://xprogramming.com/articles/jatrtsmetric/
Value Quality
Delivery Collaboration
Continuous
Improvement
Dashboard
Customer Survey
Business Value Velocity
Running Tested Features
7. Working software is the primary measure of
progress.
9. Continuous attention to technical excellence and good
design enhances agility.
Quality
Bugs
0
1
2
3
4
5
6
7
8
9
10
1 2 3 4 5 6 7 8 9 10 11
NumberofBugs
Sprint
Production Bugs
High
Meduim
Low
Test Coverage
0
2
4
6
8
10
12
14
1 2 3 4 5 6 7 8 9 10 11 12
TestCoverage
Sprint
% Test Coverage
Passing Tests
0
200
400
600
800
1000
1200
1 2 3 4 5 6 7 8 9 10 11 12
Tests
Sprint
Total # of Passing Tests
Technical Debt
Value Quality
Delivery Collaboration
Continuous
Improvement
Dashboard
Customer Survey
Business Value Velocity
Running Tested Features Production Bugs
Quality Code Metrics
Technical Debt
1. Our highest priority is to satisfy the customer through
early and continuous delivery of valuable
software.
3. Deliver working software frequently, from a
couple of weeks to a couple of months, with a preference to
the shorter timescale.
7. Working software is the primary
measure of progress.
Delivery
Velocity
0
10
20
30
40
50
60
70
80
1 2 3 4 5 6 7 8 9 10 11 12
StoryPoints
Sprint
Team Velocity
Story vs. Bug
0
2
4
6
8
10
12
14
16
18
20
1 2 3 4 5 6 7 8 9 10
Story
Sprint
Bug
Story
Burndown Chart
0
50
100
150
200
250
300
0 1 2 3 4 5 6 7 8 9 10 11
Points
Sprint
Release Burndown
Remaining
Scope
Burnup Chart
0
50
100
150
200
250
300
0 1 2 3 4 5 6 7 8 9 10 11 12
Points
Sprint
Release Burnup
Completed
Scope
Value Quality
Delivery Collaboration
Continuous
Improvement
Dashboard
Customer Survey
Business Value Velocity
Running Tested Features Production Bugs
Quality Code Metrics
Technical Debt
Burnup
Burndown
4. Business people and developers must work together
daily throughout the project.
5. Build projects around motivated individuals. Give
them the environment and support they need, and trust them
to get the job done.
6. The most efficient and effective method of conveying
information to and within a development team is face-to-
face conversation.
8. Agile processes promote sustainable development. The
sponsors, developers, and users should be able to maintain a
constant pace indefinitely.
11. The best architectures, requirements, and designs emerge
from self-organizing teams.
Collaboration
Cumulative Flow diagram
0
50
100
150
200
250
300
1 2 3 4 5 6 7 8 9 10
Cumulative Flow Diagram
Done QA In Progress Backlog
WIP
Lead Time
Team Dynamics Survey
Niko-niko Calendar
http://agiletrail.com/2011/09/12/how-to-track-the-teams-mood-with-a-niko-niko-calendar/
Value Quality
Delivery Collaboration
Continuous
Improvement
Dashboard
Customer Survey
Business Value Velocity
Running Tested Features Production Bugs
Quality Code Metrics
Technical Debt
Burnup
Burndown
CFD
Niko-niko Calendar
Team survey
Adapted from http://www.slideshare.net/petebehrens/measuring-agility-top-5-metrics-and-myths
◊ Focus on building features (not measuring)
◊ Take few actionable metrics
◊ A metric should lead to changing behavior
◊ Monitor trends
Continuous Improvement
Team Radar
Delivering Business Value
Asking & Receiving Feedback
Responding to Change
Understanding Vision & Goal
Planning
Applying Technical Practices
Working as a Team
Continuously Improving
Sprint 1 Team Self Assessment
Team Radar
Delivering Business Value
Asking & Receiving Feedback
Responding to Change
Understanding Vision & Goal
Planning
Applying Technical Practices
Working as a Team
Continuously Improving
Sprint 5 Team Self Assessment
Reinforces
Agile
principles
Measures
outcome not
output
Follow trends
not numbers
Provides
feedback
regularly
Fuels
meaningful
conversation
Is easy to
collect
Heuristics
http://www.innovel.net/wp-content/uploads/2007/07/appropriateagilemeasurementagilemetrics.pdf
Checklist
http://www.innovel.net/wp-content/uploads/2007/07/appropriateagilemeasurementagilemetrics.pdf
Checklist
Velocity Checklist
Question: How much software can my team deliver per iteration?
Basis of Measurement: Story points or “ideal engineering hours”
Assumptions: The team is delivering software every iteration
Level and Usage: Forecasting amount of work team can complete
Expected Trend: Affected by changing team members, obstacles,
toolsets. Stabilizes with a dedicated team working together for a
couple of iterations
When to Use It: Track after each iteration
When to Stop Using It: Team is stable and velocity is “known”
How to Game It: Teams changes point estimates to meet target
Warnings: Velocity is not the same as value
http://www.innovel.net/wp-
content/uploads/2007/07/appropriateagilemeasurementagilemetrics.pdf
Example 1
0
50
100
150
200
250
300
350
400
1 2 3 4 5 6 7 8 9 10
Hours
Day
Example 1: Burn Down
http://idiacomputing.com/pub/BetterSoftware-BurnCharts.pdf
Example 2
0
50
100
150
200
250
300
350
400
1 2 3 4 5 6 7 8 9 10
Hours
Day
Example 2: Sprint Burn Down
http://idiacomputing.com/pub/BetterSoftware-BurnCharts.pdf
Example 3
0
50
100
150
200
250
300
350
400
1 2 3 4 5 6 7 8 9 10
Hours
Day
Example 3: Sprint Burn Down
http://idiacomputing.com/pub/BetterSoftware-BurnCharts.pdf
Example 4
0
50
100
150
200
250
300
350
400
450
500
0 1 2 3 4 5 6 7 8 9 10 11 12
Points
Sprint
Example 4: Release Burndown
Remaining
Scope
Example 5
0
2
4
6
8
10
12
14
16
18
0 1 2 3 4 5 6 7 8 9 10 11 12 13 14
RTF
Sprint
Example 5: RTF
http://xprogramming.com/articles/jatrtsmetric/
Example 6
0
50
100
150
200
250
1 2 3 4 5 6 7 8 9 10
Example 7: CFD
Done QA In Progress Backlog
Example 7
0
50
100
150
200
250
1 2 3 4 5 6 7 8 9 10
Example 8: CFD
Done QA In Progress Backlog
Contact
◊ http://www.mountaingoatsoftware.com/blog/the-key-to-success-in-agile-metrics
◊ http://www.mountaingoatsoftware.com/articles/metrics-you-can-bet-on
◊ http://www.mountaingoatsoftware.com/blog/should-companies-measure-productivity-in-
story-points-ideal-days
◊ http://xprogramming.com/xpmag/BigVisibleCharts
◊ http://xprogramming.com/articles/jatrtsmetric
◊ http://www.slideshare.net/petebehrens/measuring-agility-top-5-metrics-and-myths
◊ http://www.scrumsense.com/wp-content/uploads/2009/10/Measuring-for-Results-2-
small.pdf
◊ http://jimhighsmith.com/beyond-scope-schedule-and-cost-the-agile-triangle
◊ http://agiletrail.com/2011/09/12/how-to-track-the-teams-mood-with-a-niko-niko-calendar
◊ http://www.innovel.net/wp-
content/uploads/2007/07/appropriateagilemeasurementagilemetrics.pdf
◊ http://edn.embarcadero.com/article/32410
◊ http://www.geocities.jp/nikonikocalendar/index_en.html
◊ http://www.agilejourneyman.com/2009/11/agile-project-metrics.html
◊ http://www.agilejourneyman.com/2009/10/metrics-in-agile-world.html
◊ http://www.agilejourneyman.com/2010/08/project-vital-signs.html
References

Agile dashboard

  • 1.
  • 2.
    While we arewaiting for the session to start, chat with your neighbors: – Are you on an Agile team? – How many members are on the team? – How long are your iterations? – What’s your team’s velocity? Chat with your Neighbors
  • 3.
    ◊ Team’s capacityto complete work per iteration ◊ An Empirical observation ◊ A leading indicator ◊ For the entire team and not the individual member ◊ Different for each team ◊ Great for planning purposes ◊ Not an estimate ◊ Not a target Velocity
  • 4.
    Fadi Stephan ◊ 15+years of experience in software development ◊ Focused on Agile and Scrum since 2006 – Agile readiness & maturity assessments – Scrum coaching & mentoring – Scrum and Agile Engineering training ◊ Founder of the DC Software Craftsmanship User Group ◊ Organizer of the DC Scrum User Group
  • 5.
  • 6.
  • 7.
    1. Our highestpriority is to satisfy the customer through early and continuous delivery of valuable software. 2. Welcome changing requirements, even late in development. Agile processes harness change for the customer's competitive advantage. 3. Deliver working software frequently, from a couple of weeks to a couple of months, with a preference to the shorter timescale. 4. Business people and developers must work together daily throughout the project. 5. Build projects around motivated individuals. Give them the environment and support they need, and trust them to get the job done. 6. The most efficient and effective method of conveying information to and within a development team is face-to-face conversation. 7. Working software is the primary measure of progress. 8. Agile processes promote sustainable development. The sponsors, developers, and users should be able to maintain a constant pace indefinitely. 9. Continuous attention to technical excellence and good design enhances agility. 10. Simplicity--the art of maximizing the amount of work not done--is essential. 11. The best architectures, requirements, and designs emerge from self-organizing teams. 12. At regular intervals, the team reflects on how to become more effective, then tunes and adjusts its behavior accordingly. Agile Principles
  • 8.
    ◊ Read theprinciples behind the Agile manifesto ◊ For each principle determine – What should be measured? – How do we measure it? Agile Metrics
  • 9.
    1. Our highestpriority is to satisfy the customer through early and continuous delivery of valuable software. 2. Welcome changing requirements, even late in development. Agile processes harness change for the customer's competitive advantage. 3. Deliver working software frequently, from a couple of weeks to a couple of months, with a preference to the shorter timescale. 4. Business people and developers must work together daily throughout the project. 5. Build projects around motivated individuals. Give them the environment and support they need, and trust them to get the job done. 6. The most efficient and effective method of conveying information to and within a development team is face-to-face conversation. 7. Working software is the primary measure of progress. 8. Agile processes promote sustainable development. The sponsors, developers, and users should be able to maintain a constant pace indefinitely. 9. Continuous attention to technical excellence and good design enhances agility. 10. Simplicity--the art of maximizing the amount of work not done--is essential. 11.The best architectures, requirements, and designs emerge from self-organizing teams. 12.At regular intervals, the team reflects on how to become more effective, then tunes and adjusts its behavior accordingly. Agile Principles
  • 10.
  • 11.
  • 12.
    Value Quality Delivery Collaboration Continuous Improvement Dashboard ValuableSoftware Early and Continuous Welcome changing requirements Frequently Working together Motivated Face to face Constant pace Self organizing teams Technical Excellence Simplicity Working Software
  • 13.
    1. Our highestpriority is to satisfy the customer through early and continuous delivery of valuable software. 7. Working software is the primary measure of progress. Value
  • 14.
    Customer Satisfaction Survey ◊How satisfied are you with the latest release? ◊ How likely are you to recommend the product to others?
  • 15.
    ◊ Kano analysis ◊Relative weighting ◊ Theme screening ◊ Theme scoring ◊ Financial (NPV, IRR, Discounted Payback Period) ◊ Relative Business Value Points ◊ Not at the Story level Business Value
  • 16.
    Running Tested Features 0 5 10 15 20 25 30 01 2 3 4 5 6 7 8 9 10 11 12 13 14 RunningTestedFeatures Sprint Running Tested Features http://xprogramming.com/articles/jatrtsmetric/
  • 17.
    Value Quality Delivery Collaboration Continuous Improvement Dashboard CustomerSurvey Business Value Velocity Running Tested Features
  • 18.
    7. Working softwareis the primary measure of progress. 9. Continuous attention to technical excellence and good design enhances agility. Quality
  • 19.
    Bugs 0 1 2 3 4 5 6 7 8 9 10 1 2 34 5 6 7 8 9 10 11 NumberofBugs Sprint Production Bugs High Meduim Low
  • 23.
    Test Coverage 0 2 4 6 8 10 12 14 1 23 4 5 6 7 8 9 10 11 12 TestCoverage Sprint % Test Coverage
  • 24.
    Passing Tests 0 200 400 600 800 1000 1200 1 23 4 5 6 7 8 9 10 11 12 Tests Sprint Total # of Passing Tests
  • 25.
  • 26.
    Value Quality Delivery Collaboration Continuous Improvement Dashboard CustomerSurvey Business Value Velocity Running Tested Features Production Bugs Quality Code Metrics Technical Debt
  • 27.
    1. Our highestpriority is to satisfy the customer through early and continuous delivery of valuable software. 3. Deliver working software frequently, from a couple of weeks to a couple of months, with a preference to the shorter timescale. 7. Working software is the primary measure of progress. Delivery
  • 28.
    Velocity 0 10 20 30 40 50 60 70 80 1 2 34 5 6 7 8 9 10 11 12 StoryPoints Sprint Team Velocity
  • 29.
    Story vs. Bug 0 2 4 6 8 10 12 14 16 18 20 12 3 4 5 6 7 8 9 10 Story Sprint Bug Story
  • 30.
    Burndown Chart 0 50 100 150 200 250 300 0 12 3 4 5 6 7 8 9 10 11 Points Sprint Release Burndown Remaining Scope
  • 31.
    Burnup Chart 0 50 100 150 200 250 300 0 12 3 4 5 6 7 8 9 10 11 12 Points Sprint Release Burnup Completed Scope
  • 32.
    Value Quality Delivery Collaboration Continuous Improvement Dashboard CustomerSurvey Business Value Velocity Running Tested Features Production Bugs Quality Code Metrics Technical Debt Burnup Burndown
  • 33.
    4. Business peopleand developers must work together daily throughout the project. 5. Build projects around motivated individuals. Give them the environment and support they need, and trust them to get the job done. 6. The most efficient and effective method of conveying information to and within a development team is face-to- face conversation. 8. Agile processes promote sustainable development. The sponsors, developers, and users should be able to maintain a constant pace indefinitely. 11. The best architectures, requirements, and designs emerge from self-organizing teams. Collaboration
  • 34.
    Cumulative Flow diagram 0 50 100 150 200 250 300 12 3 4 5 6 7 8 9 10 Cumulative Flow Diagram Done QA In Progress Backlog WIP Lead Time
  • 35.
  • 36.
  • 37.
    Value Quality Delivery Collaboration Continuous Improvement Dashboard CustomerSurvey Business Value Velocity Running Tested Features Production Bugs Quality Code Metrics Technical Debt Burnup Burndown CFD Niko-niko Calendar Team survey Adapted from http://www.slideshare.net/petebehrens/measuring-agility-top-5-metrics-and-myths
  • 38.
    ◊ Focus onbuilding features (not measuring) ◊ Take few actionable metrics ◊ A metric should lead to changing behavior ◊ Monitor trends Continuous Improvement
  • 39.
    Team Radar Delivering BusinessValue Asking & Receiving Feedback Responding to Change Understanding Vision & Goal Planning Applying Technical Practices Working as a Team Continuously Improving Sprint 1 Team Self Assessment
  • 40.
    Team Radar Delivering BusinessValue Asking & Receiving Feedback Responding to Change Understanding Vision & Goal Planning Applying Technical Practices Working as a Team Continuously Improving Sprint 5 Team Self Assessment
  • 41.
    Reinforces Agile principles Measures outcome not output Follow trends notnumbers Provides feedback regularly Fuels meaningful conversation Is easy to collect Heuristics http://www.innovel.net/wp-content/uploads/2007/07/appropriateagilemeasurementagilemetrics.pdf
  • 42.
  • 43.
  • 44.
    Velocity Checklist Question: Howmuch software can my team deliver per iteration? Basis of Measurement: Story points or “ideal engineering hours” Assumptions: The team is delivering software every iteration Level and Usage: Forecasting amount of work team can complete Expected Trend: Affected by changing team members, obstacles, toolsets. Stabilizes with a dedicated team working together for a couple of iterations When to Use It: Track after each iteration When to Stop Using It: Team is stable and velocity is “known” How to Game It: Teams changes point estimates to meet target Warnings: Velocity is not the same as value http://www.innovel.net/wp- content/uploads/2007/07/appropriateagilemeasurementagilemetrics.pdf
  • 45.
    Example 1 0 50 100 150 200 250 300 350 400 1 23 4 5 6 7 8 9 10 Hours Day Example 1: Burn Down http://idiacomputing.com/pub/BetterSoftware-BurnCharts.pdf
  • 46.
    Example 2 0 50 100 150 200 250 300 350 400 1 23 4 5 6 7 8 9 10 Hours Day Example 2: Sprint Burn Down http://idiacomputing.com/pub/BetterSoftware-BurnCharts.pdf
  • 47.
    Example 3 0 50 100 150 200 250 300 350 400 1 23 4 5 6 7 8 9 10 Hours Day Example 3: Sprint Burn Down http://idiacomputing.com/pub/BetterSoftware-BurnCharts.pdf
  • 48.
    Example 4 0 50 100 150 200 250 300 350 400 450 500 0 12 3 4 5 6 7 8 9 10 11 12 Points Sprint Example 4: Release Burndown Remaining Scope
  • 49.
    Example 5 0 2 4 6 8 10 12 14 16 18 0 12 3 4 5 6 7 8 9 10 11 12 13 14 RTF Sprint Example 5: RTF http://xprogramming.com/articles/jatrtsmetric/
  • 50.
    Example 6 0 50 100 150 200 250 1 23 4 5 6 7 8 9 10 Example 7: CFD Done QA In Progress Backlog
  • 51.
    Example 7 0 50 100 150 200 250 1 23 4 5 6 7 8 9 10 Example 8: CFD Done QA In Progress Backlog
  • 52.
  • 53.
    ◊ http://www.mountaingoatsoftware.com/blog/the-key-to-success-in-agile-metrics ◊ http://www.mountaingoatsoftware.com/articles/metrics-you-can-bet-on ◊http://www.mountaingoatsoftware.com/blog/should-companies-measure-productivity-in- story-points-ideal-days ◊ http://xprogramming.com/xpmag/BigVisibleCharts ◊ http://xprogramming.com/articles/jatrtsmetric ◊ http://www.slideshare.net/petebehrens/measuring-agility-top-5-metrics-and-myths ◊ http://www.scrumsense.com/wp-content/uploads/2009/10/Measuring-for-Results-2- small.pdf ◊ http://jimhighsmith.com/beyond-scope-schedule-and-cost-the-agile-triangle ◊ http://agiletrail.com/2011/09/12/how-to-track-the-teams-mood-with-a-niko-niko-calendar ◊ http://www.innovel.net/wp- content/uploads/2007/07/appropriateagilemeasurementagilemetrics.pdf ◊ http://edn.embarcadero.com/article/32410 ◊ http://www.geocities.jp/nikonikocalendar/index_en.html ◊ http://www.agilejourneyman.com/2009/11/agile-project-metrics.html ◊ http://www.agilejourneyman.com/2009/10/metrics-in-agile-world.html ◊ http://www.agilejourneyman.com/2010/08/project-vital-signs.html References