This document provides information on tolerance stackup analysis, which is performed to determine variation in a dimension or distance in an assembly due to individual part tolerances. It describes different methods for calculating tolerance stackup including arithmetic, worst case, root sum square, modified root sum square, and six sigma methods. Formulas for calculating the mean dimension and standard deviation using each method are also presented.
In this document
Powered by AI
Overview of tolerance stackup analysis presented by Winson Mao on August 22, 2012.
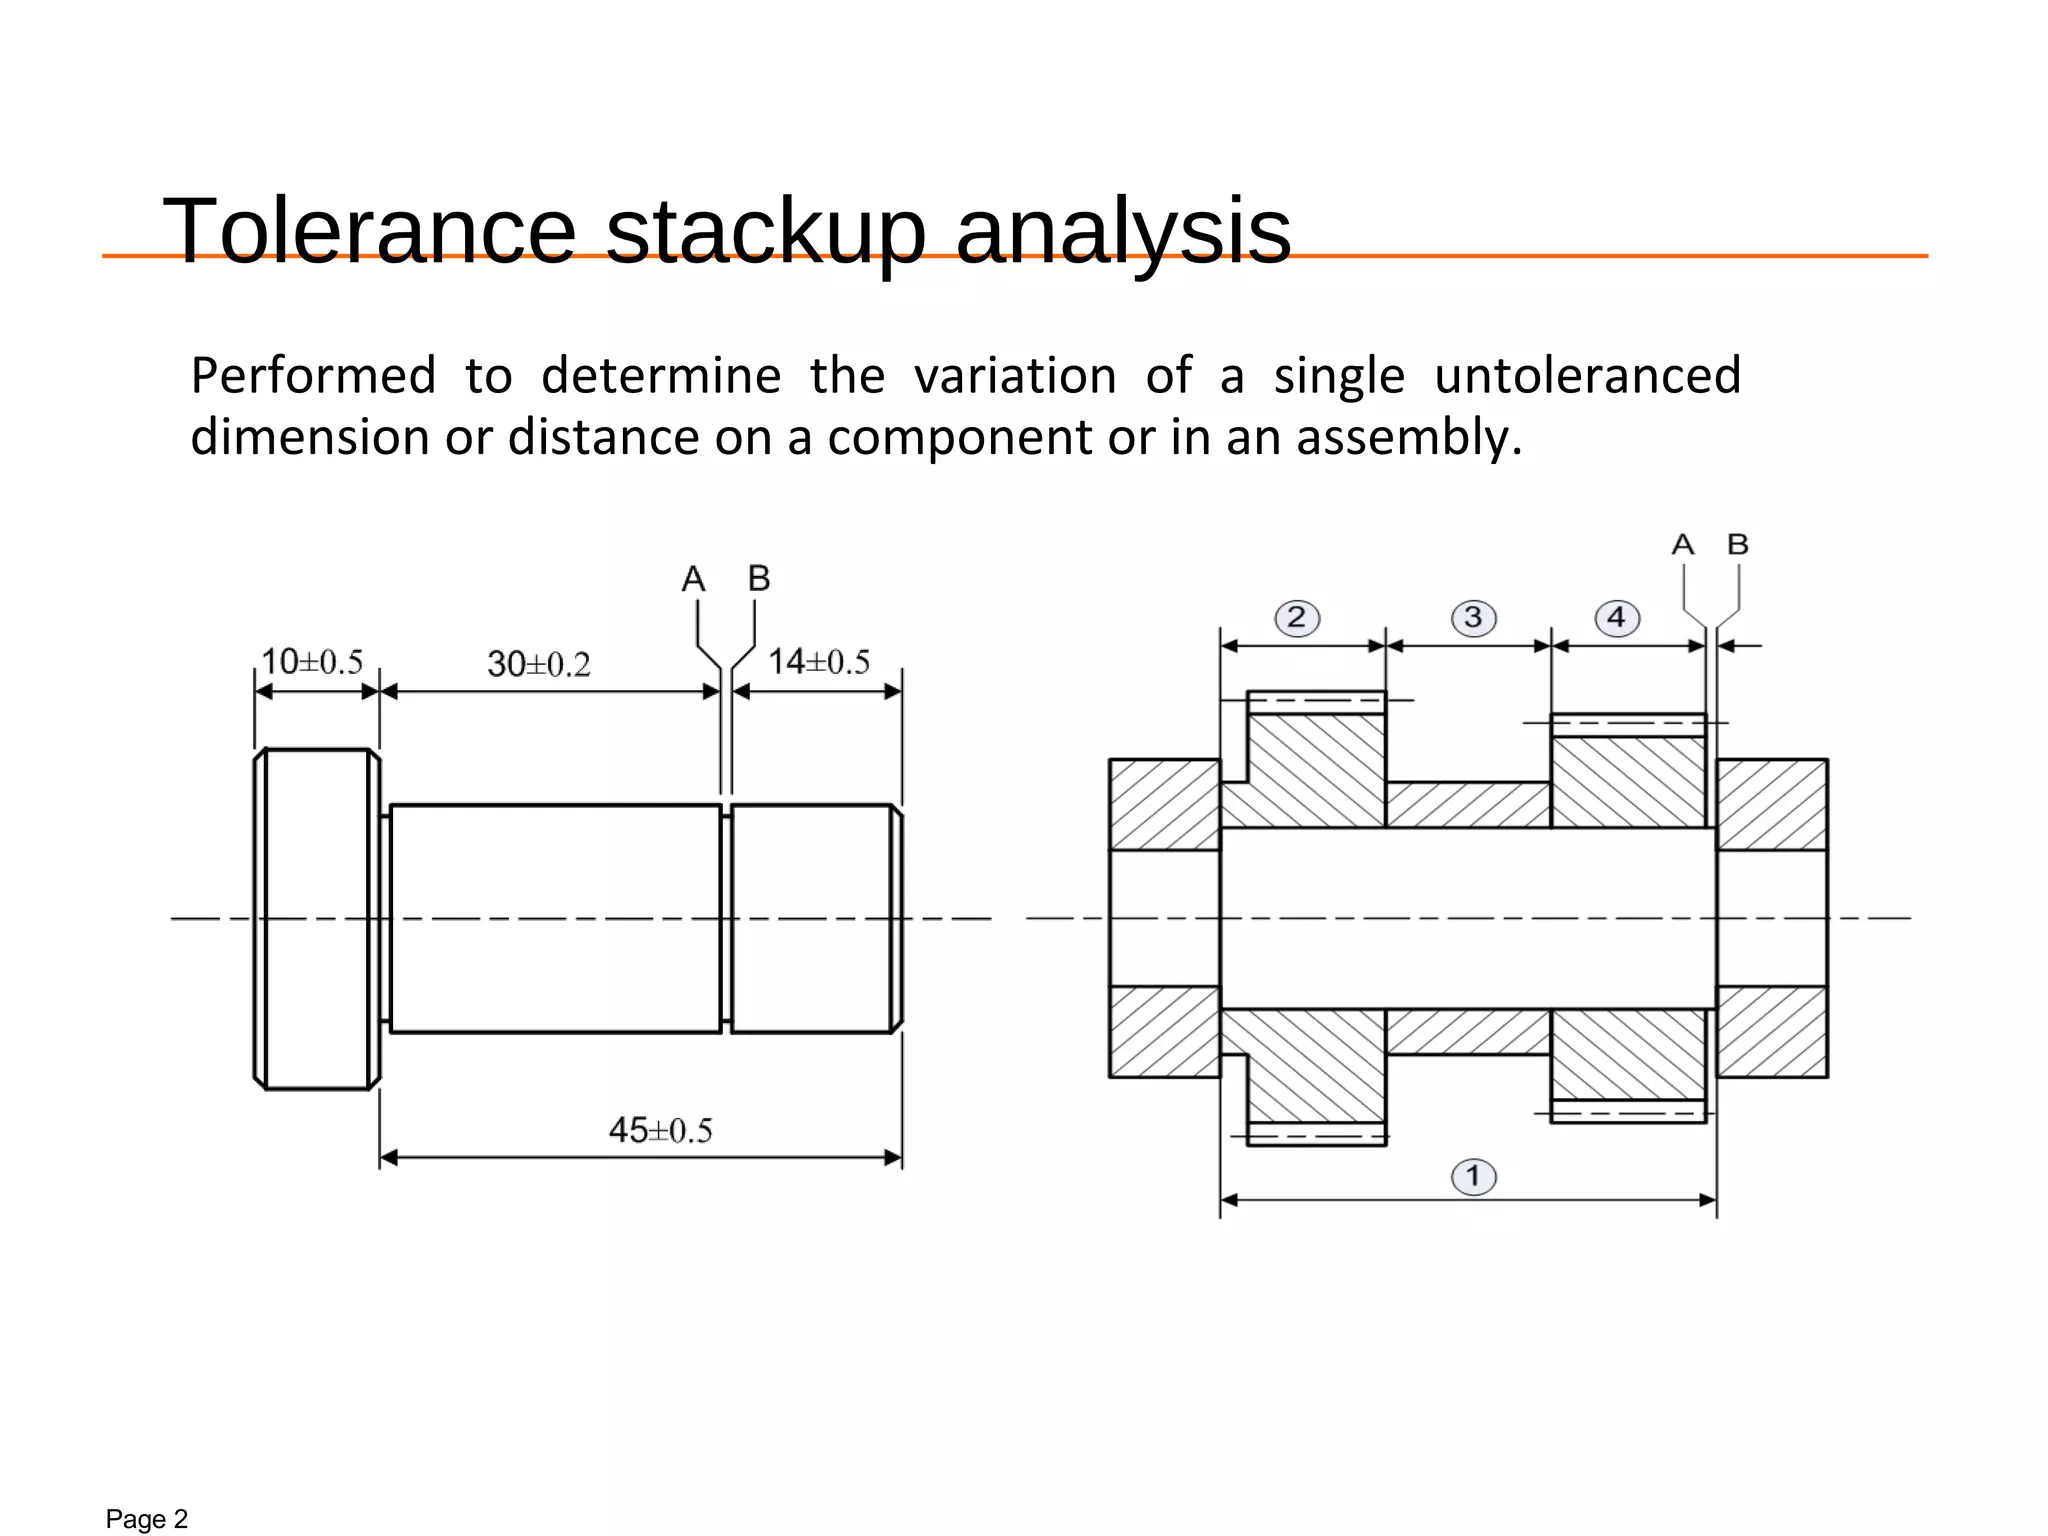
Determines variation of single untoleranced dimensions in components or assemblies.
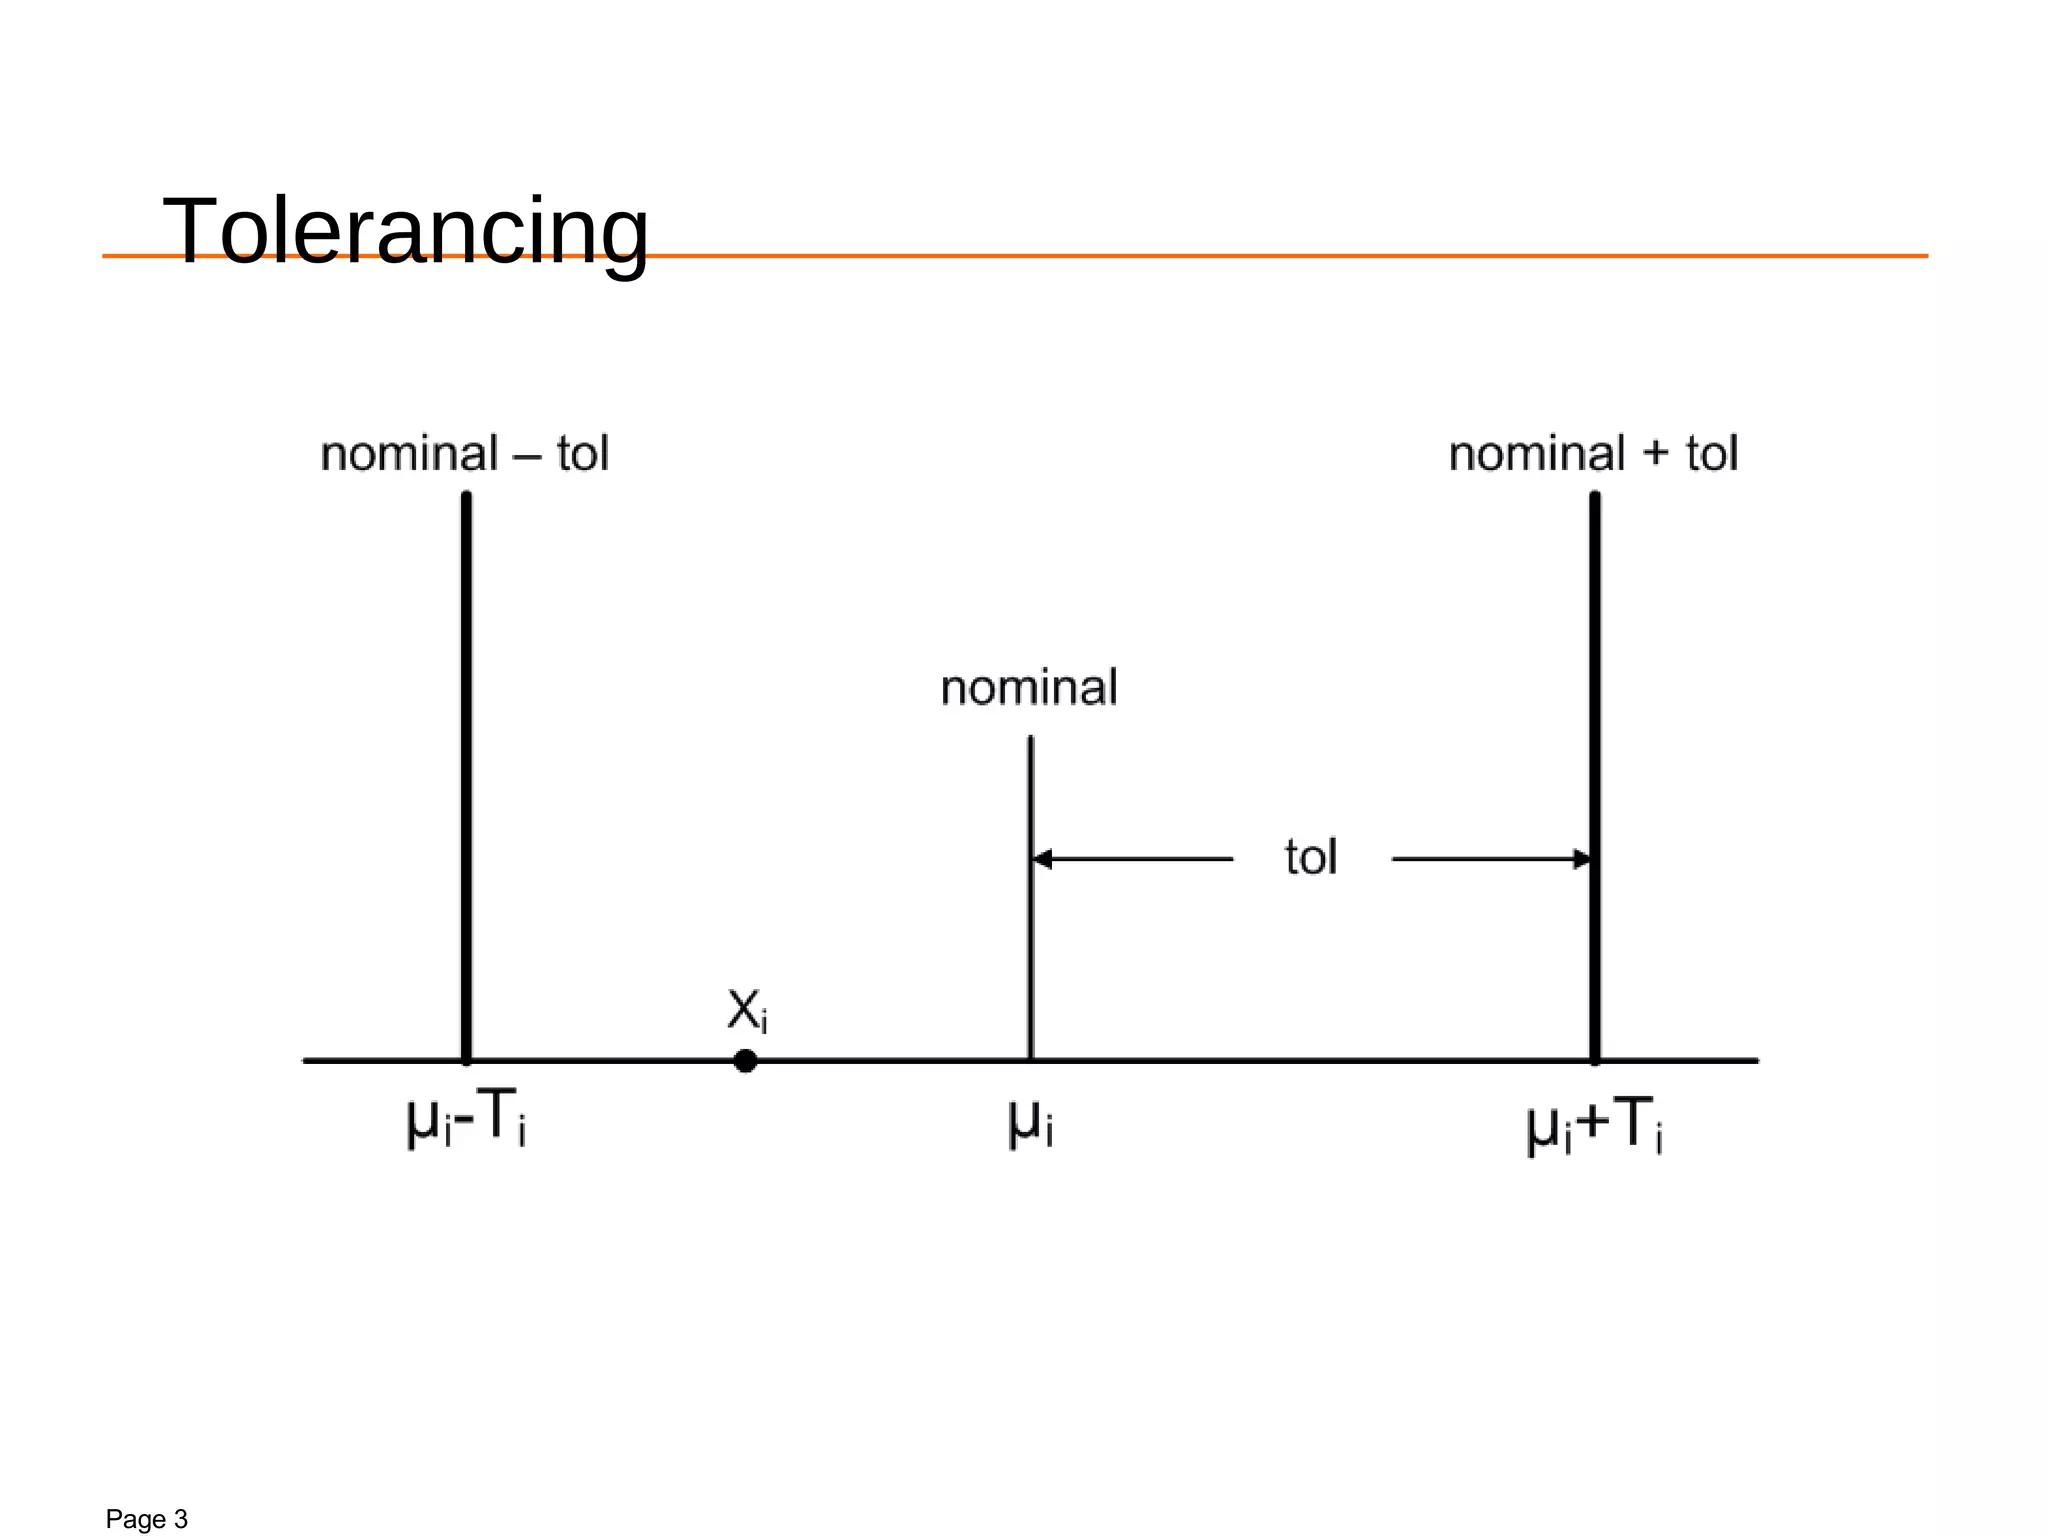
Introduction to tolerancing methods: Arithmetic (Worst Case) and Statistical (RSS, MRSS, 6S).
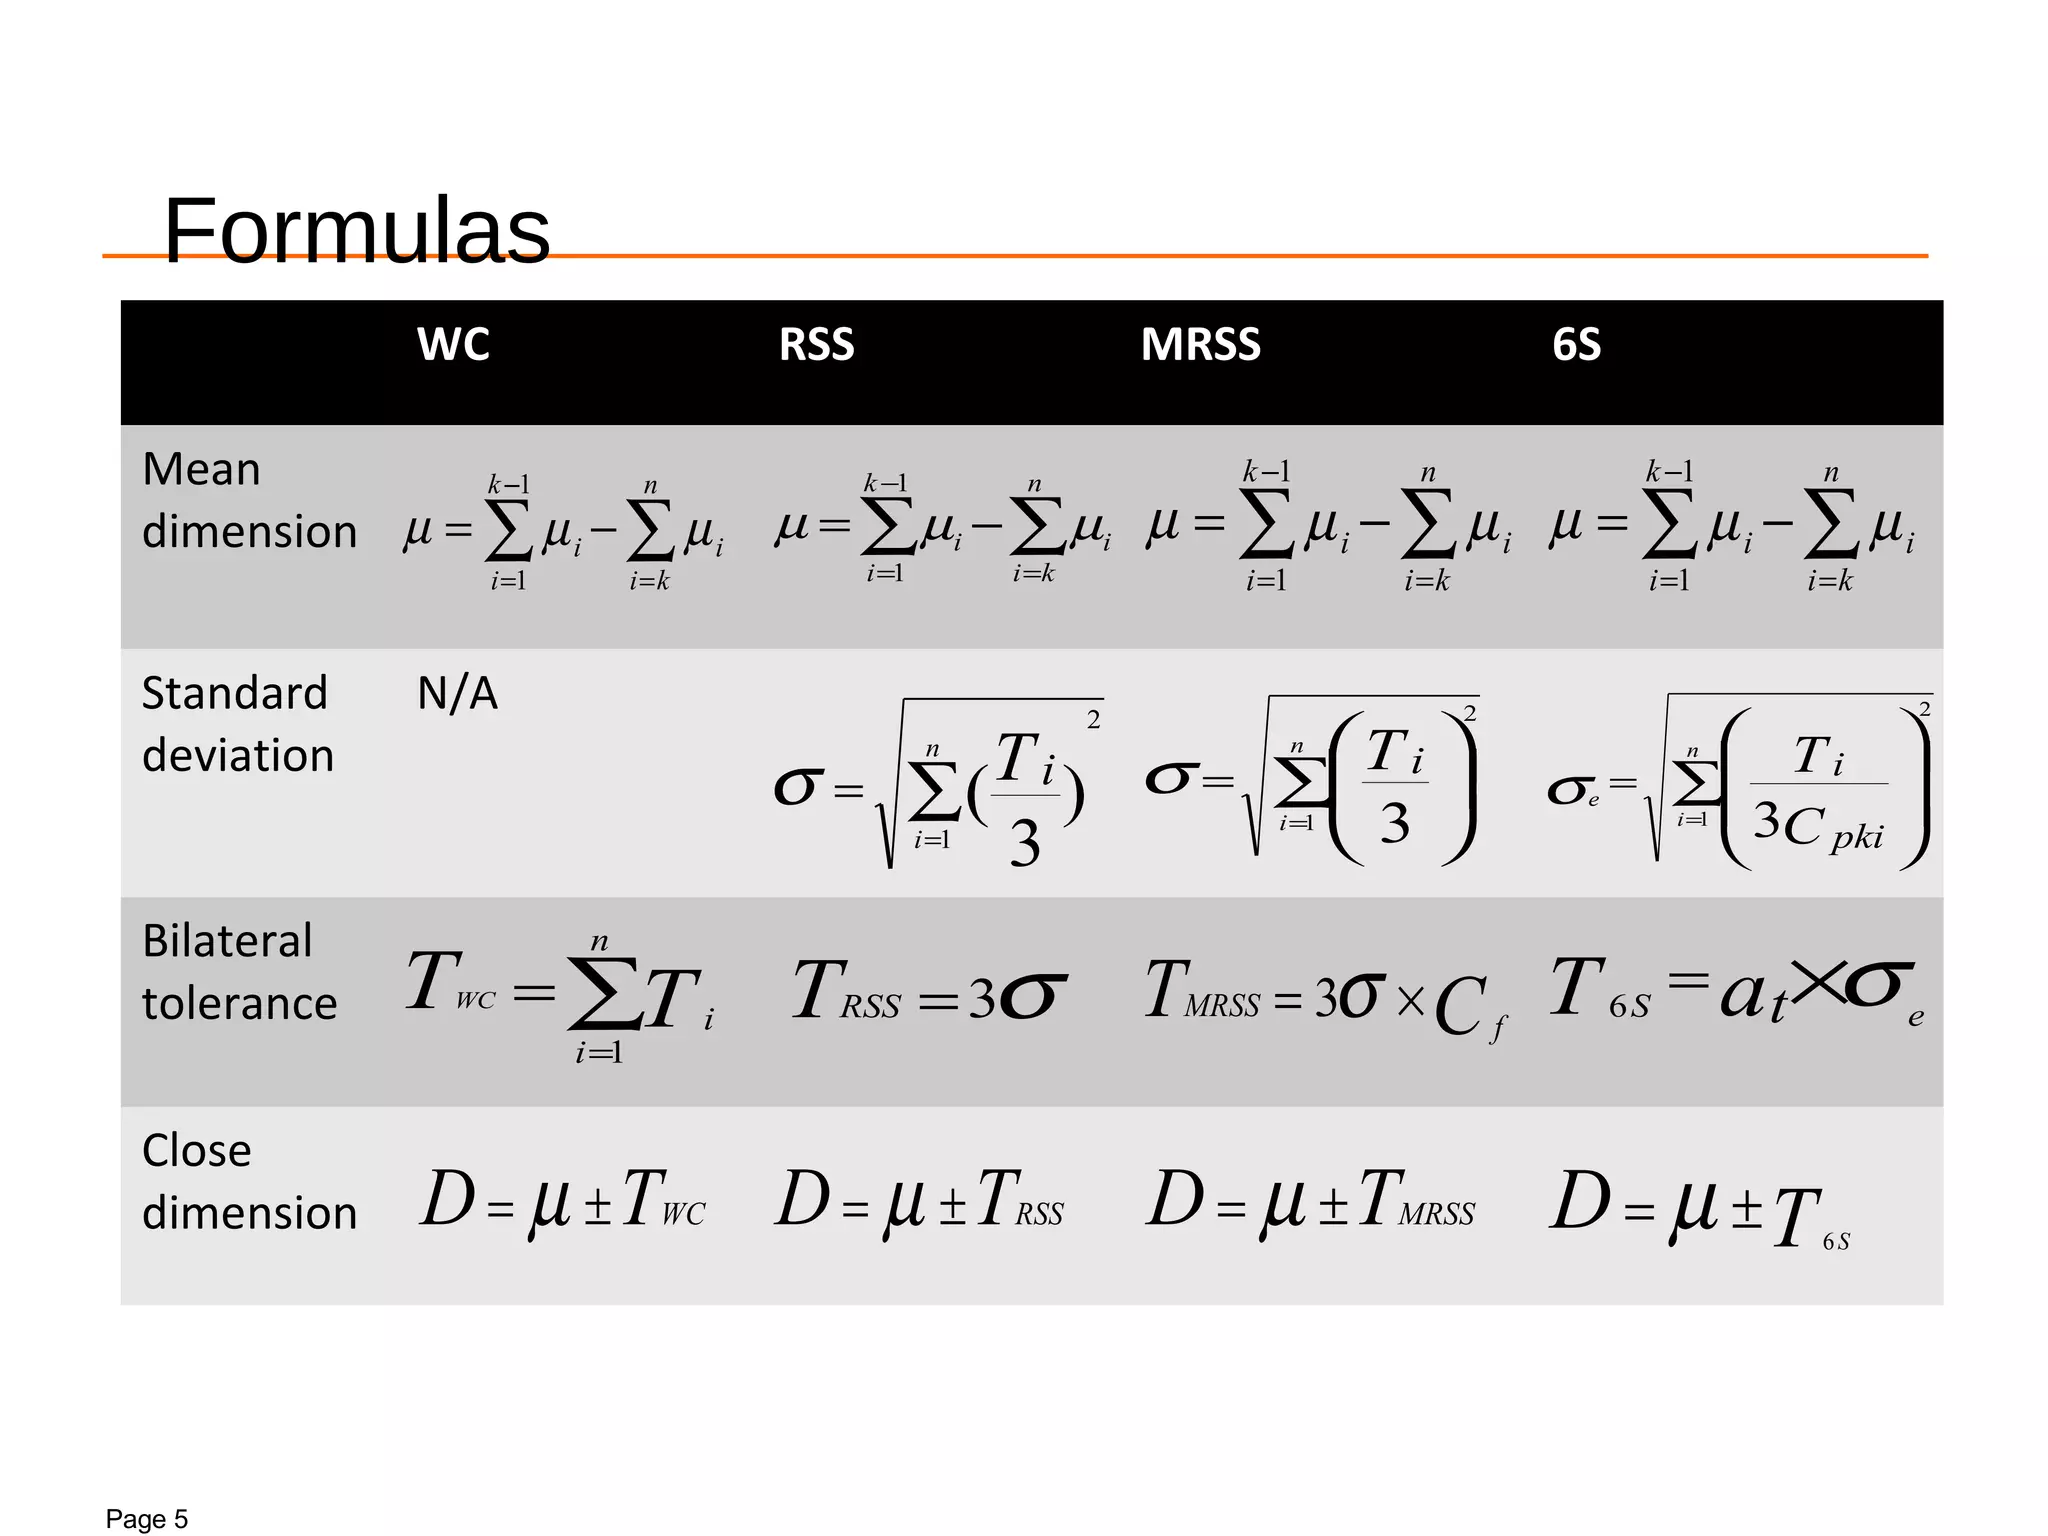
Formulas for various methods (WC, RSS, MRSS, 6S) including mean, standard deviation, and tolerances.
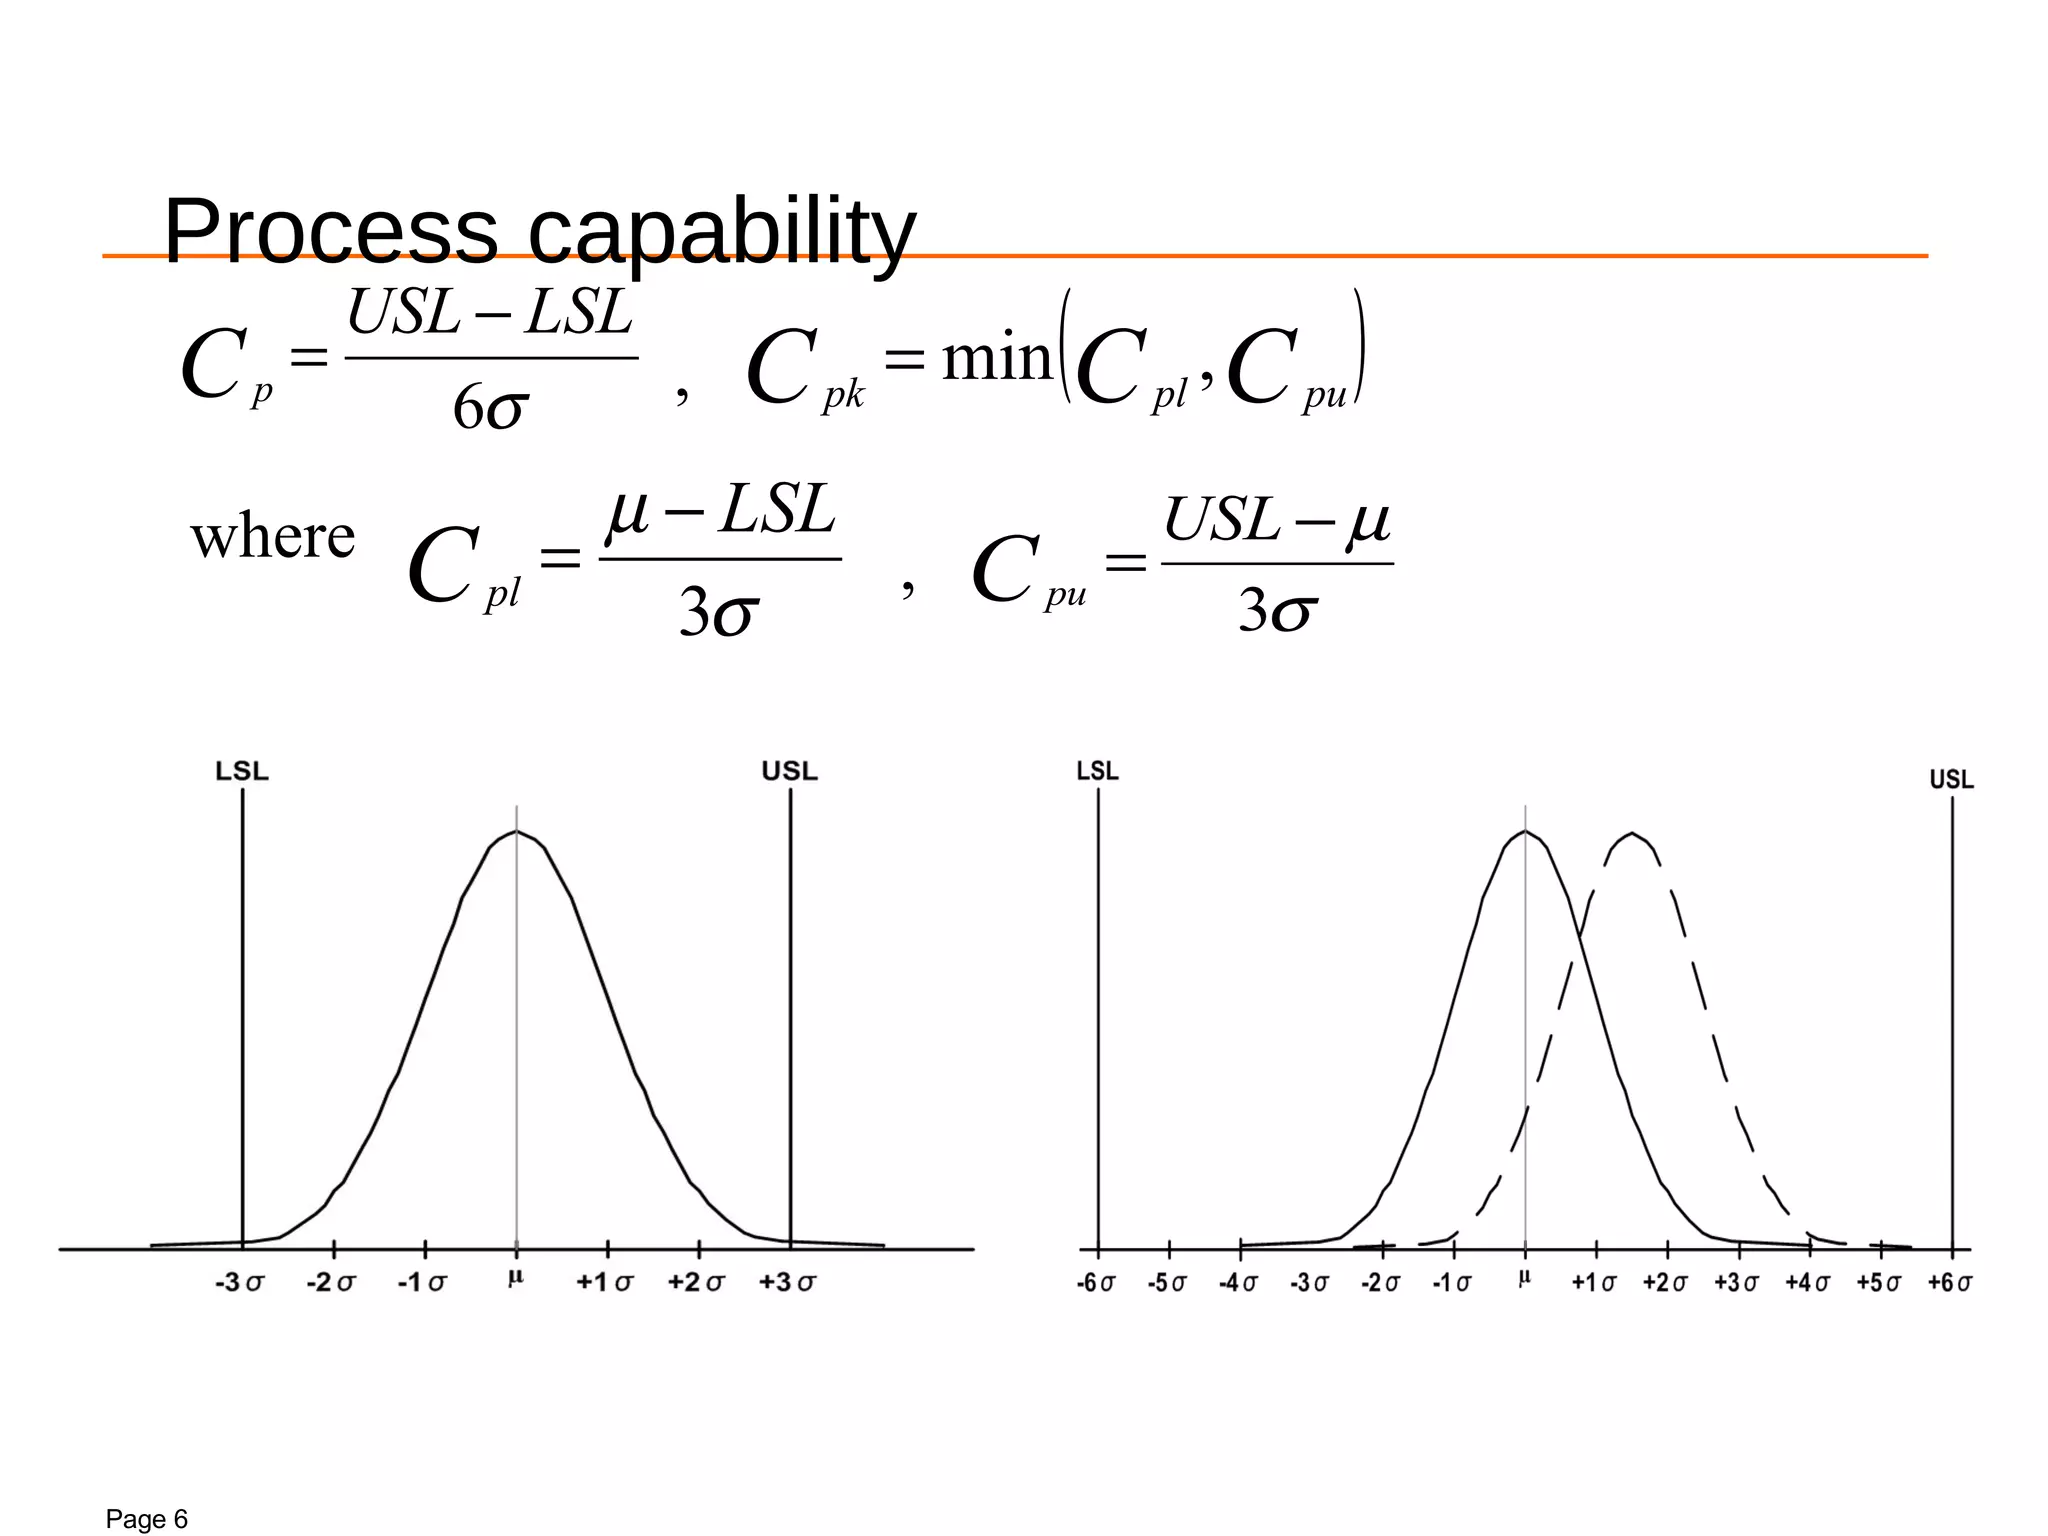
Description of process capability metrics, Cp, Cpl, and Cpu based on specification limits.
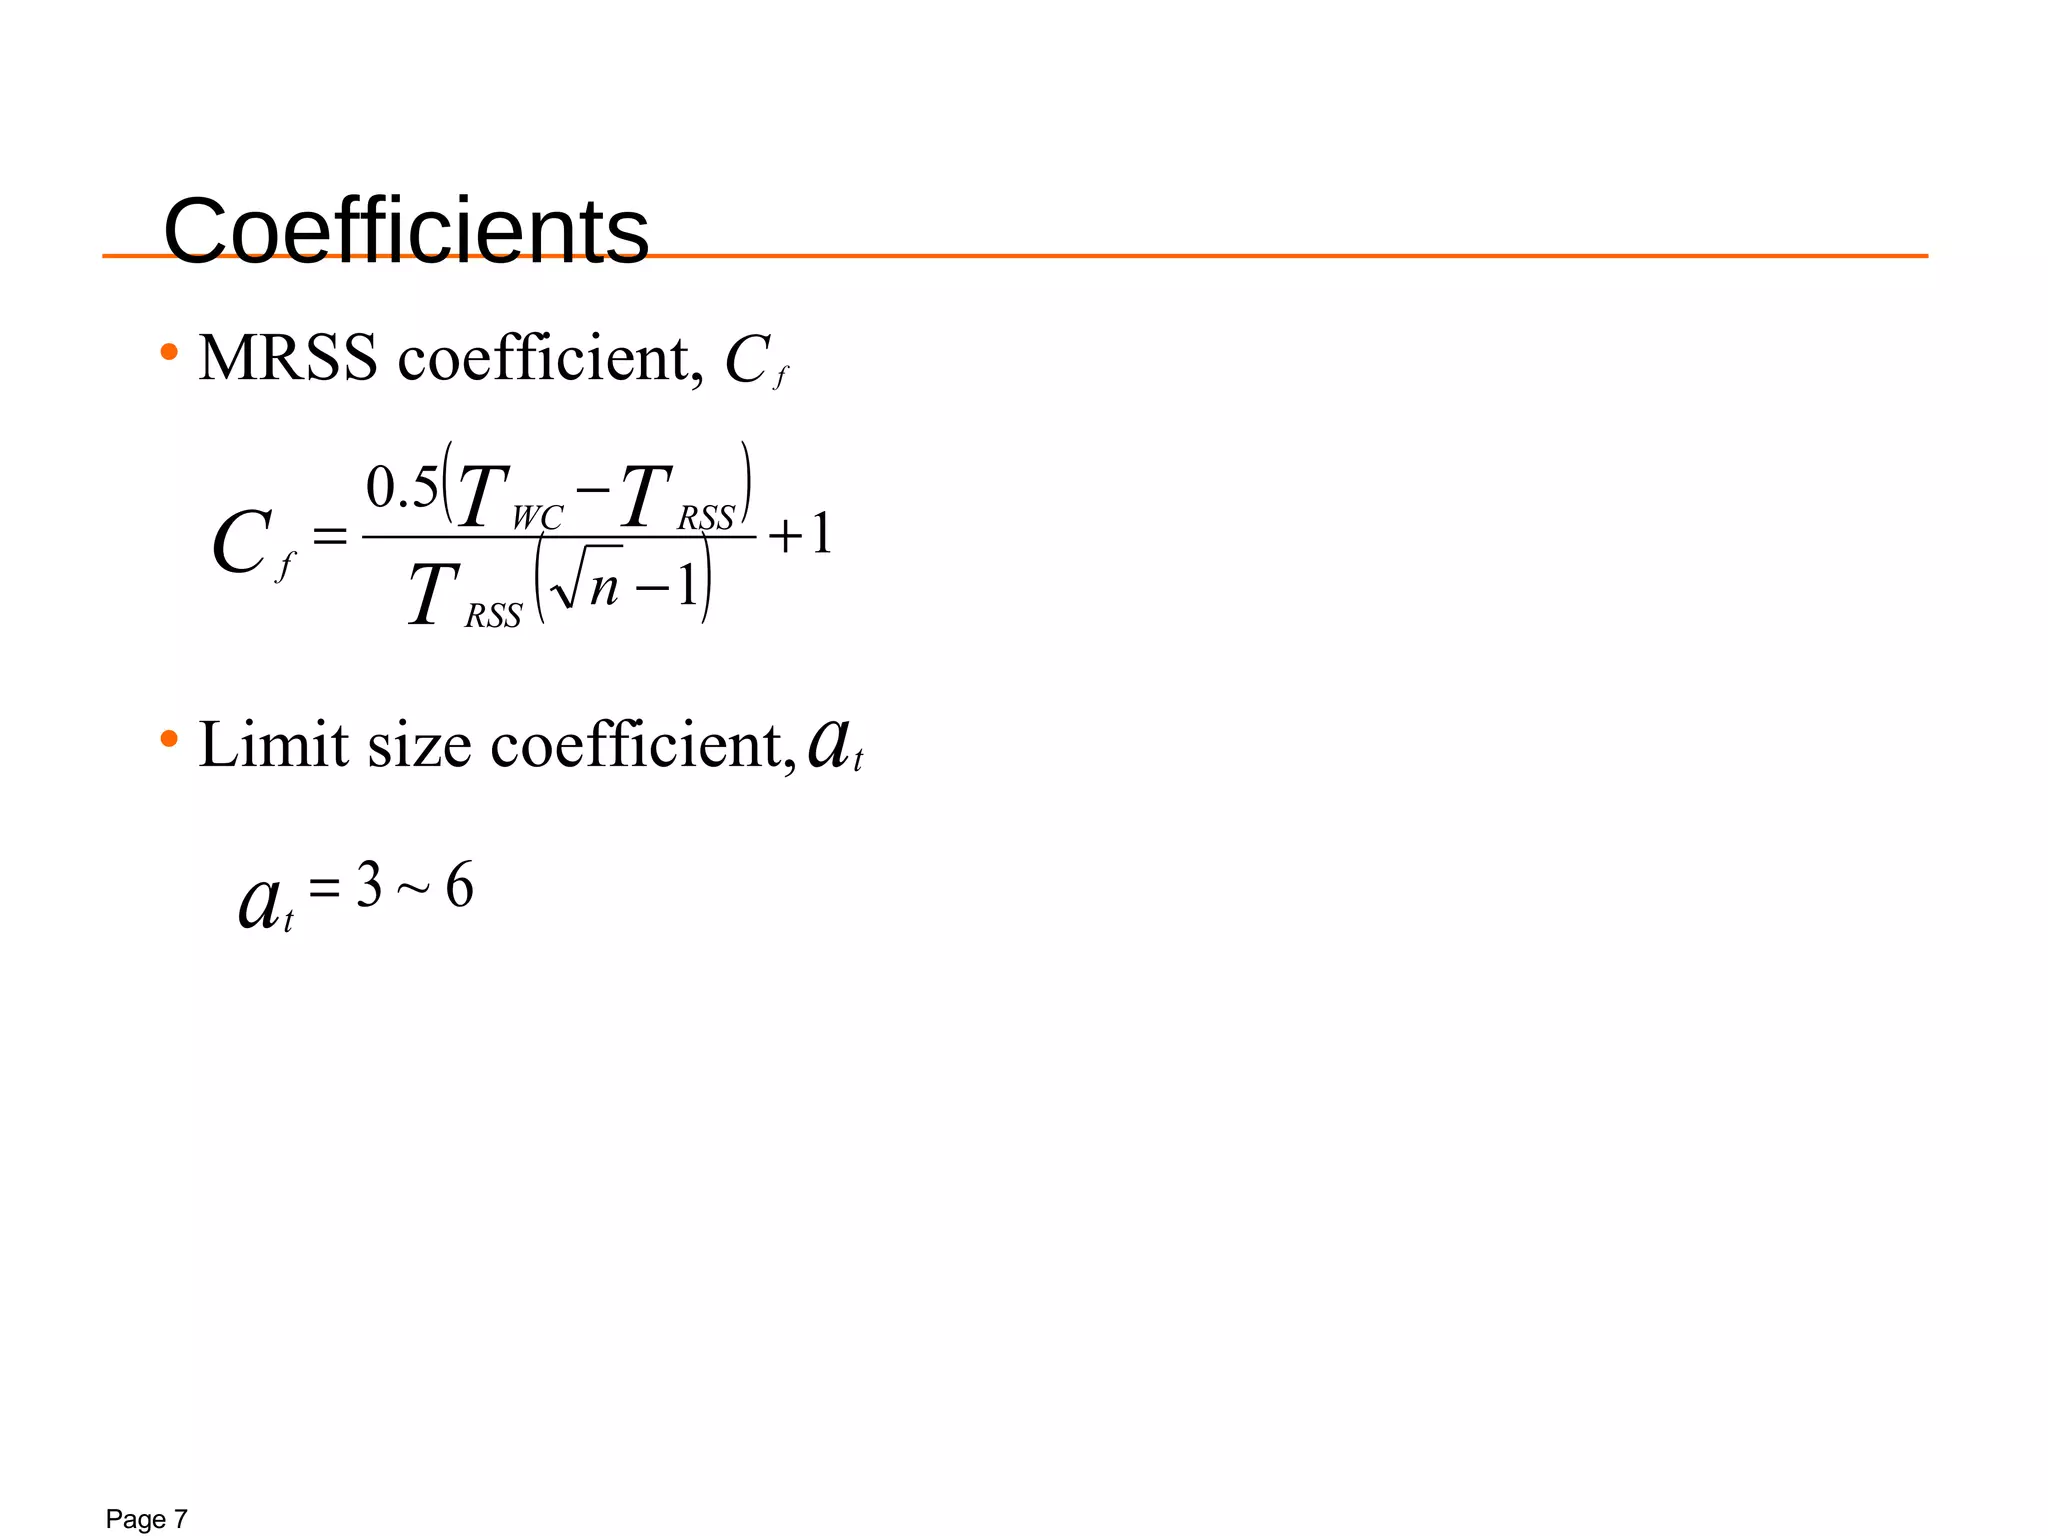
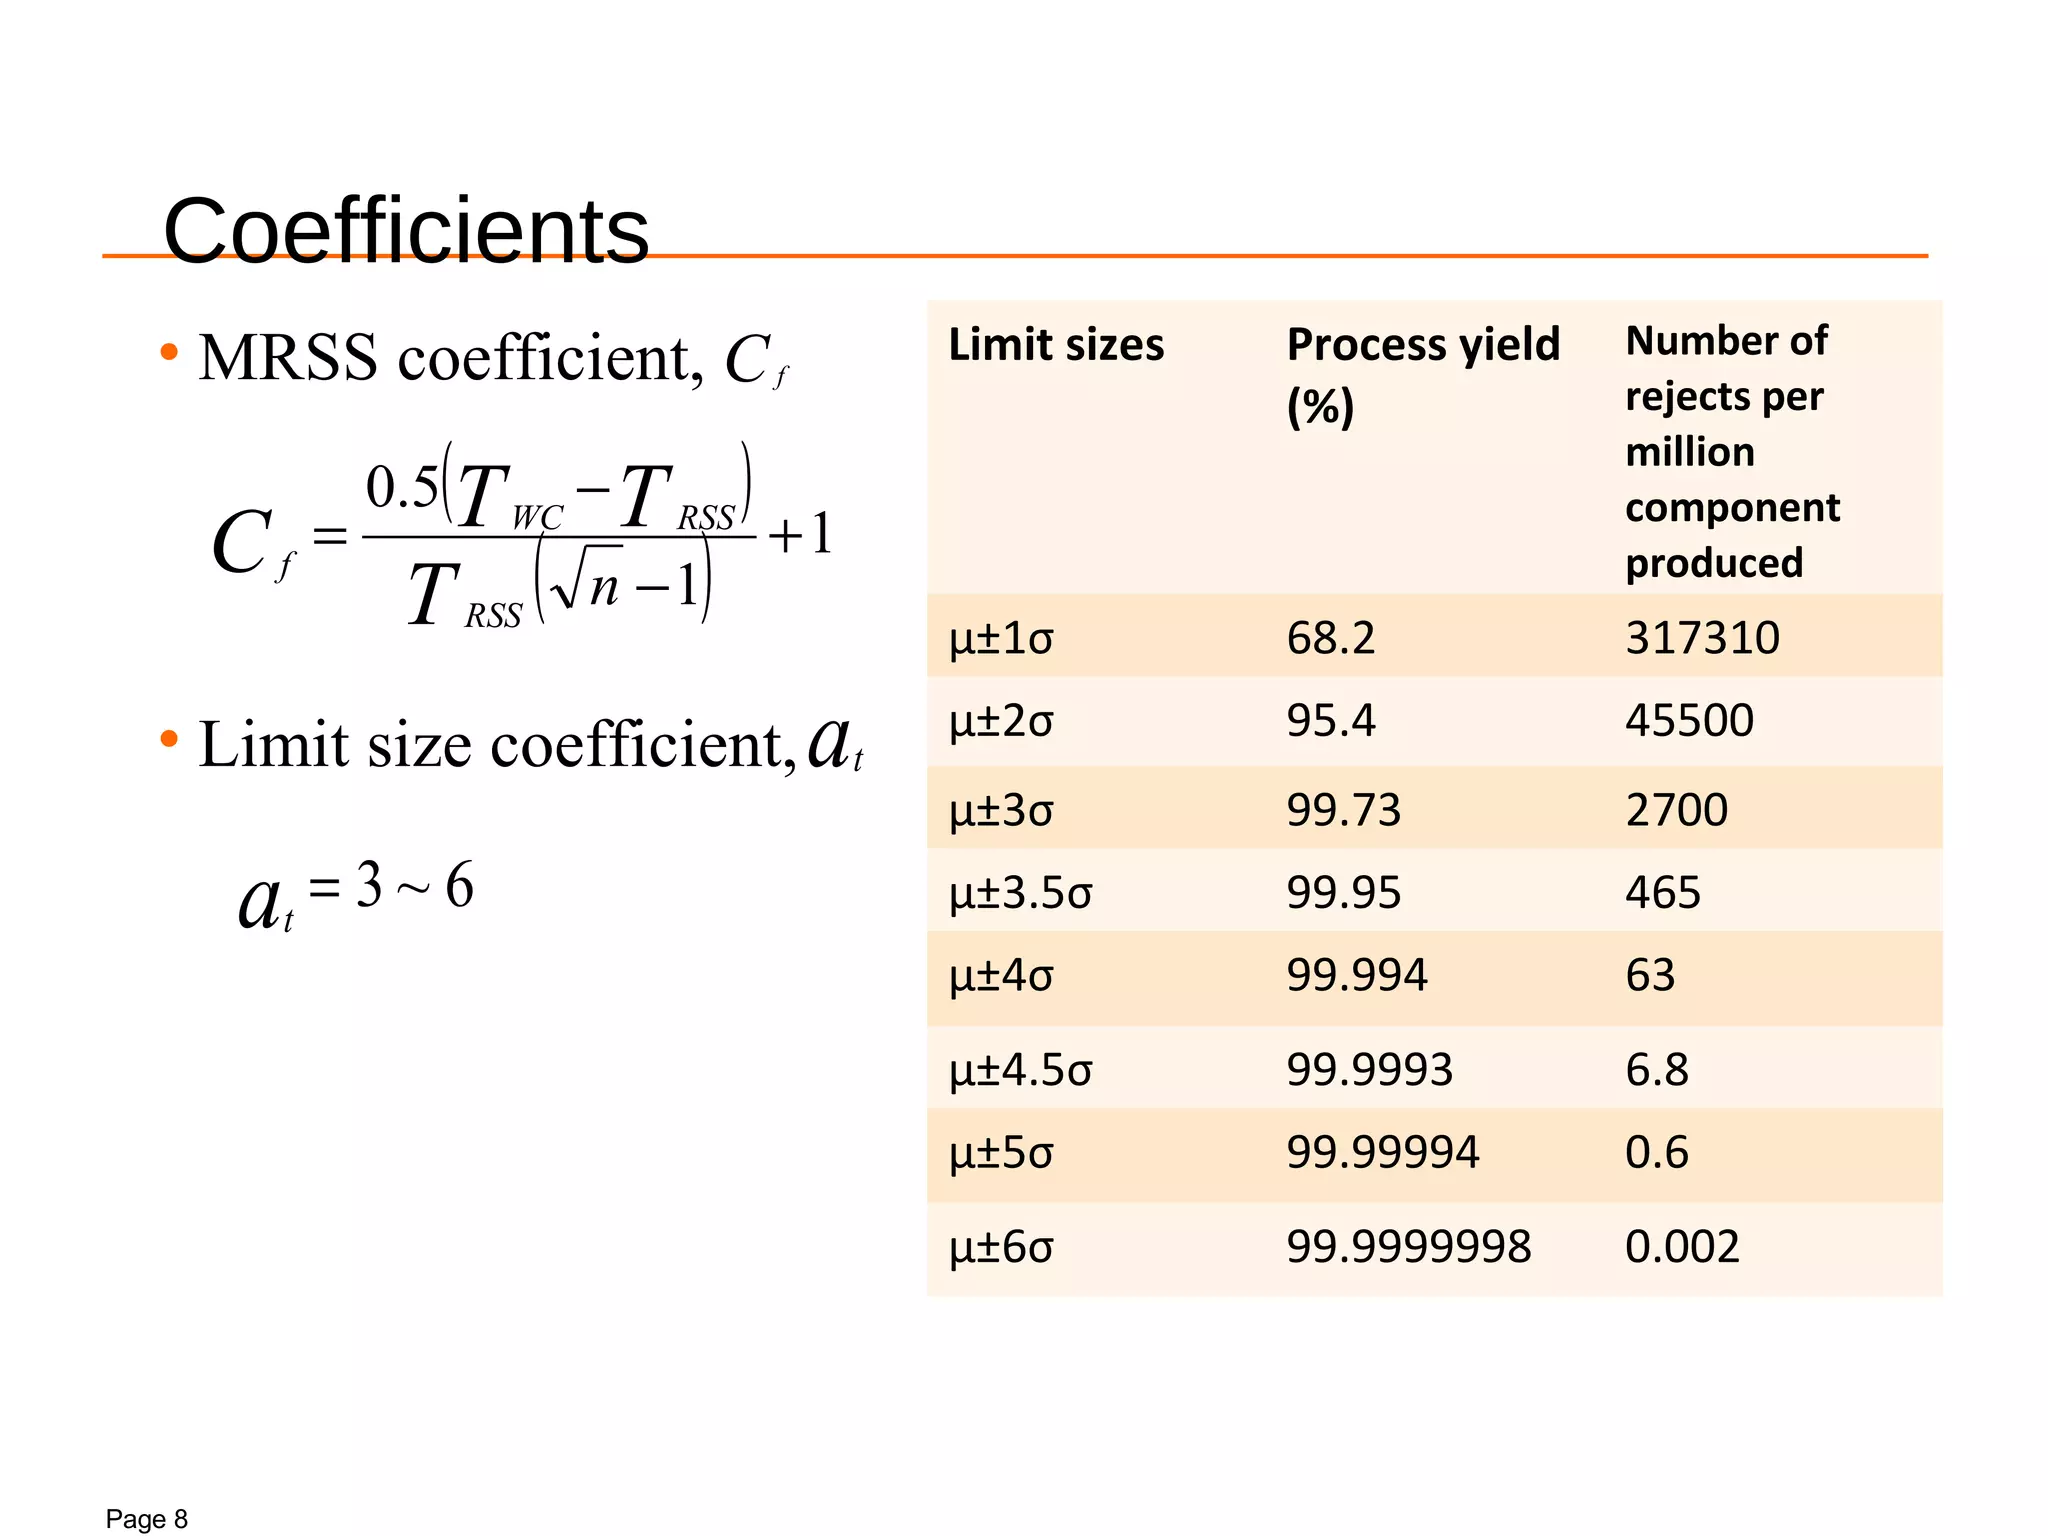
Discussion on MRSS coefficient, limit size coefficients, and process yield percentages with reject rates.
Comparison of arithmetic and statistical tolerancing based on various factors affecting tolerances.
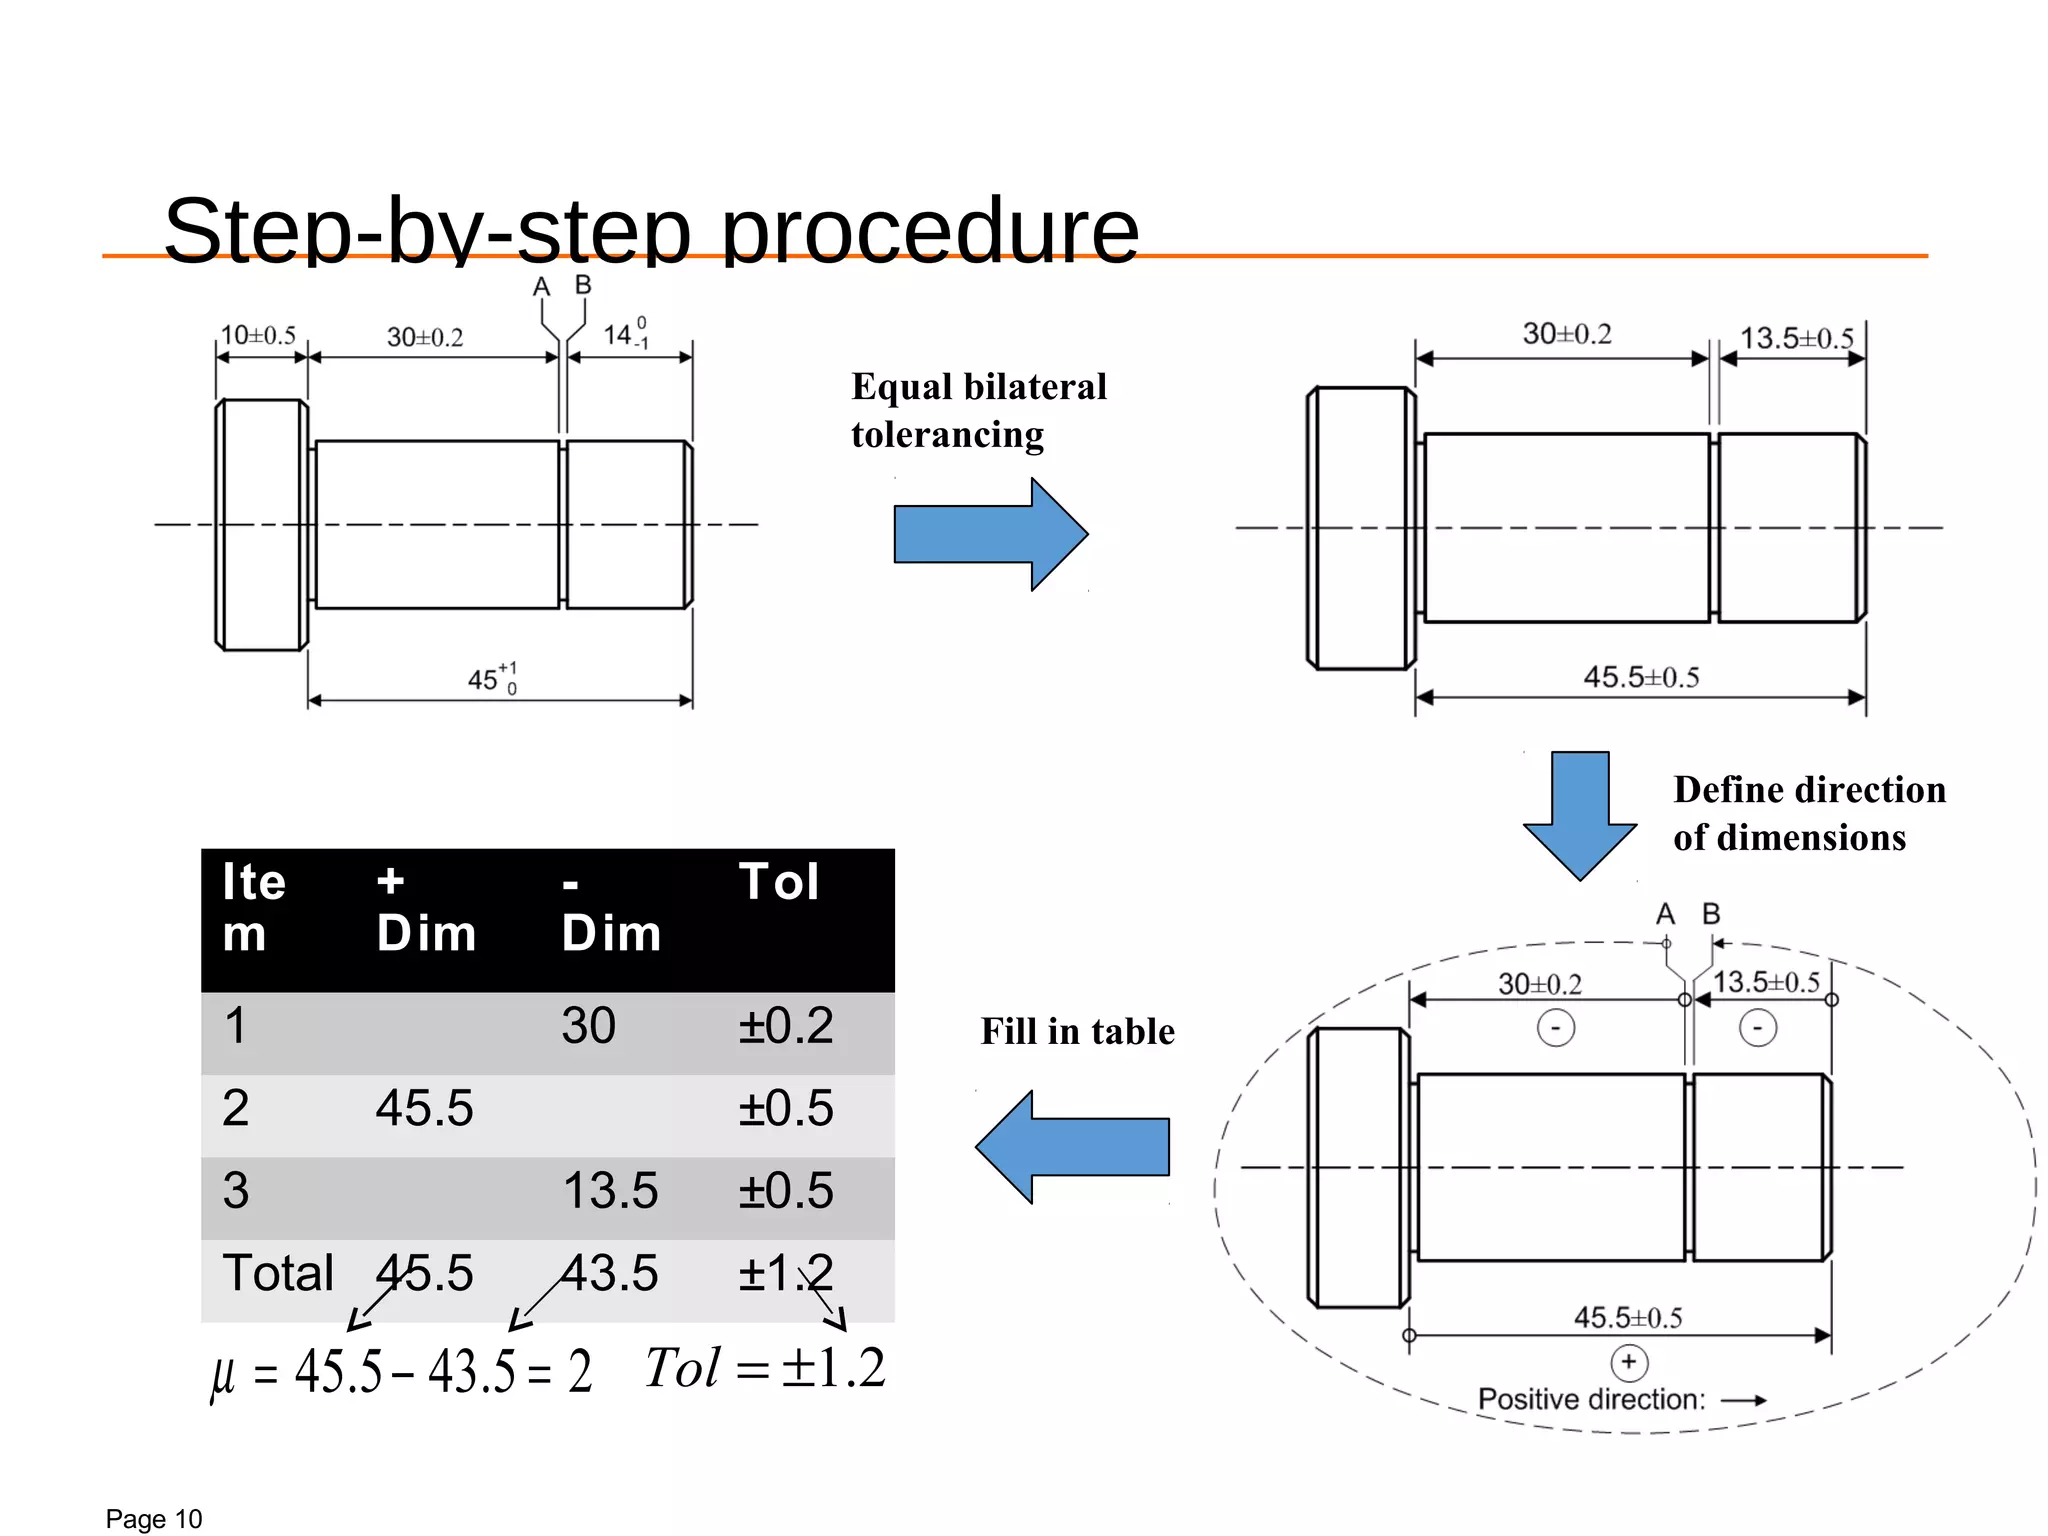
Detailed instructions for performing equal bilateral tolerancing with examples of dimensions.
Page 4
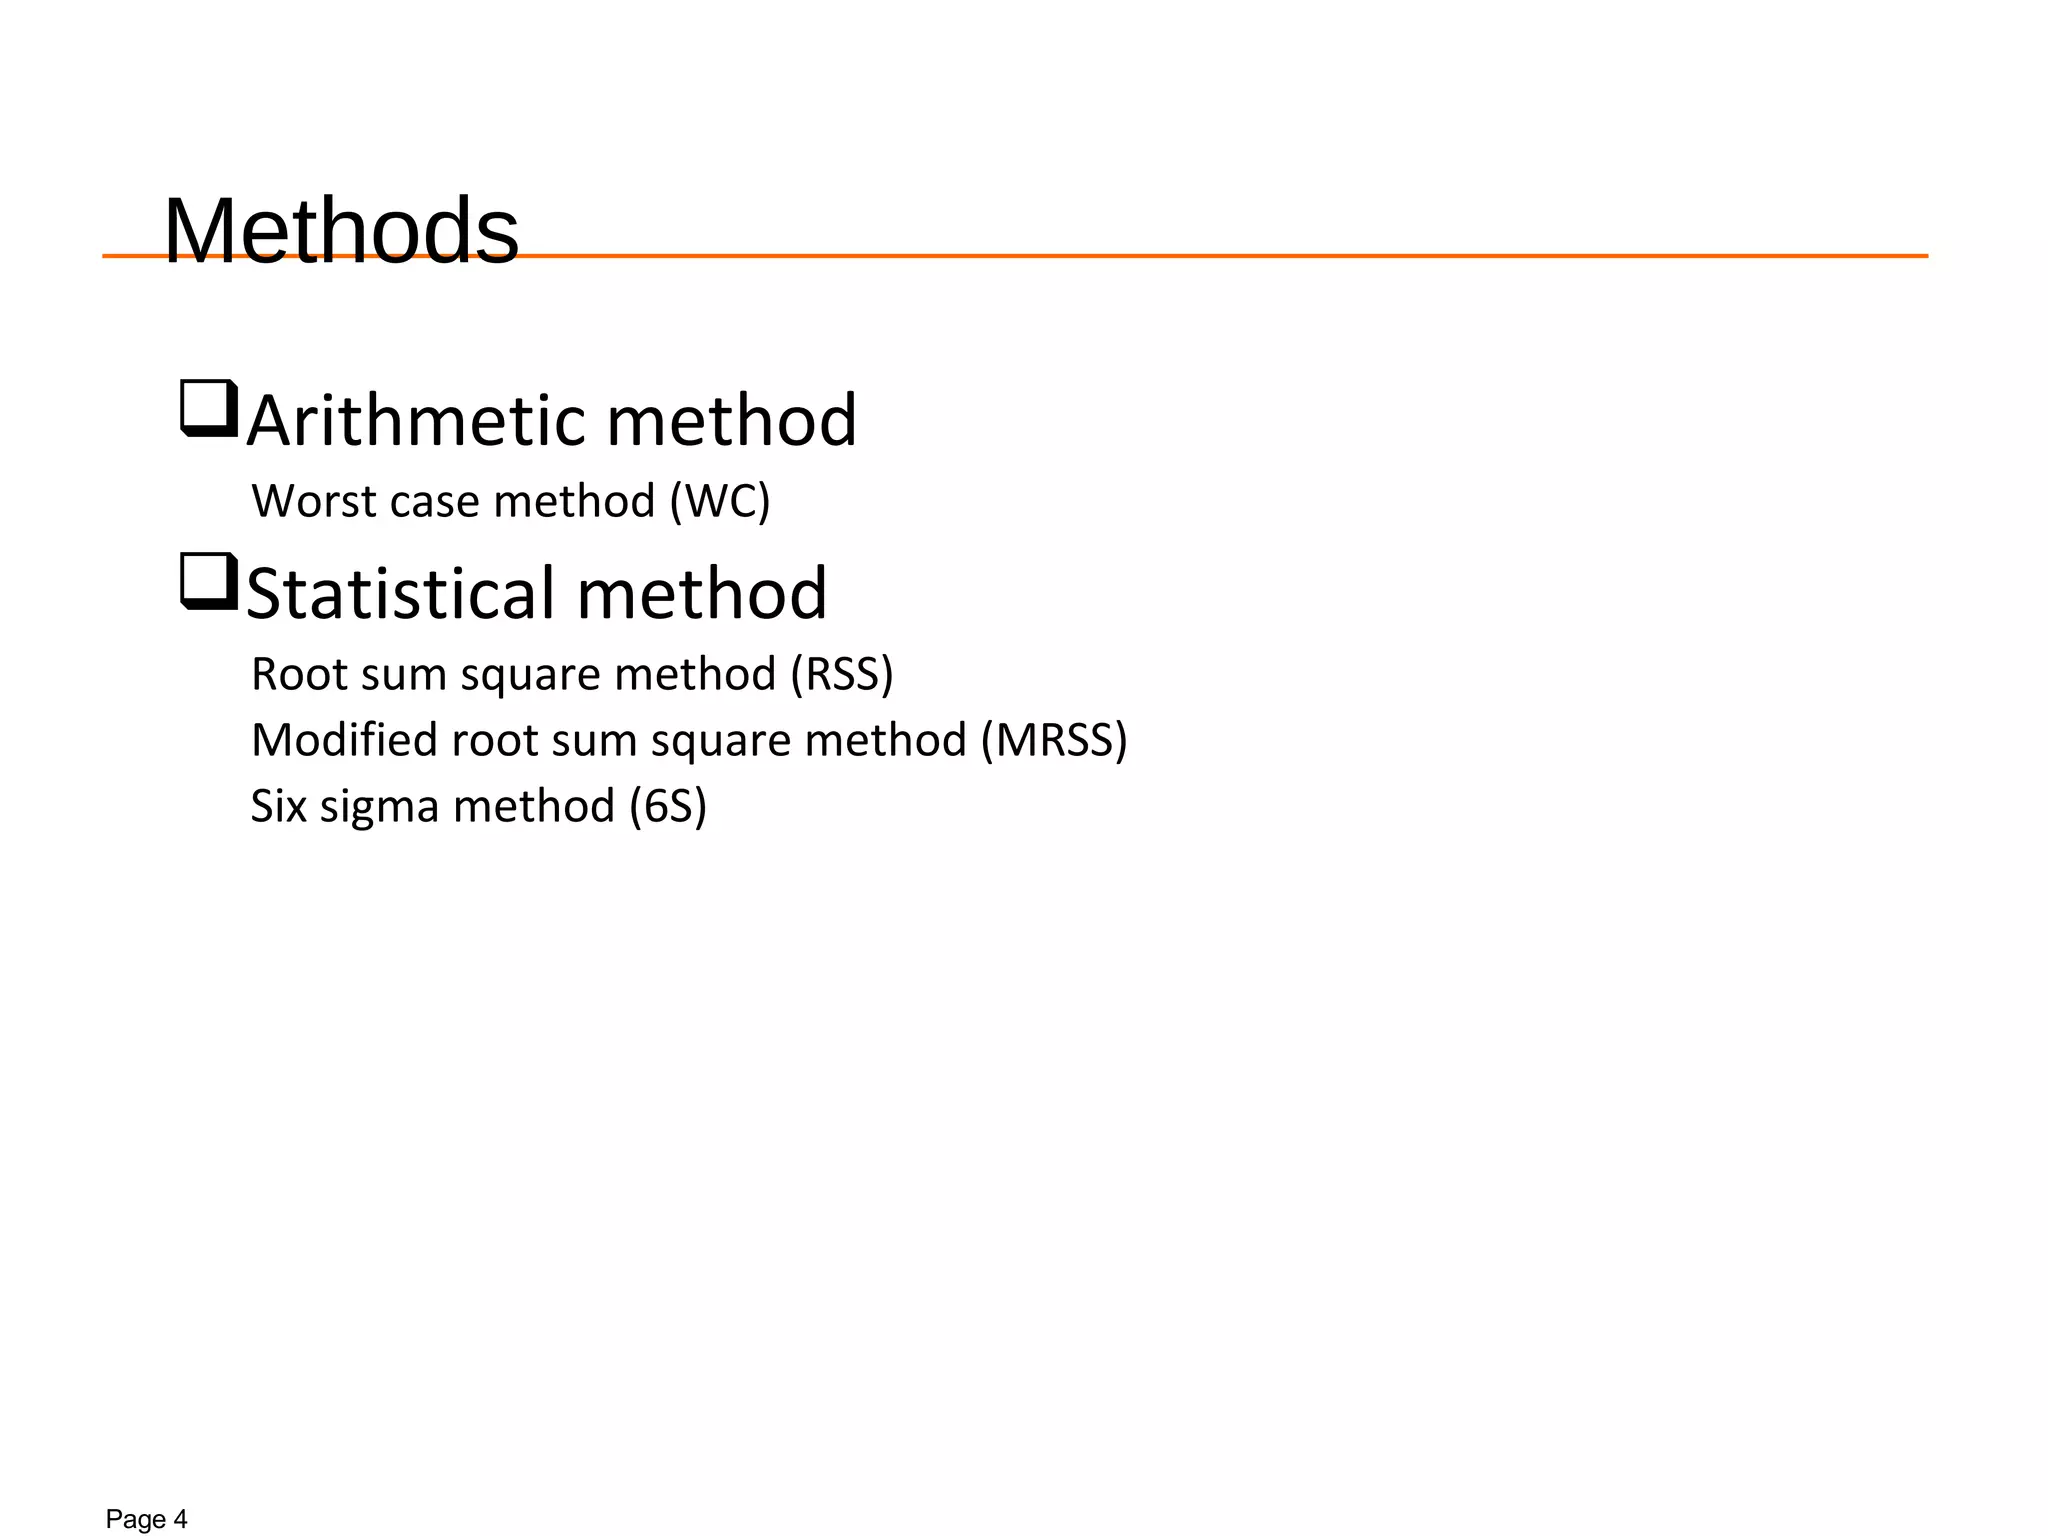
Methods
Arithmetic method
Worstcase method (WC)
Statistical method
Root sum square method (RSS)
Modified root sum square method (MRSS)
Six sigma method (6S)
5.
Page 5
Formulas
WC RSSMRSS 6S
Mean
dimension
Standard
deviation
N/A
Bilateral
tolerance
Close
dimension
∑∑ =
−
=
−=
n
ki
i
k
i
i µµµ
1
1
∑=
=
n
i
iTTWC
1
WCTD ±= µ
∑∑ =
−
=
−=
n
ki
i
k
i
i µµµ
1
1
∑∑ =
−
=
−=
n
ki
i
k
i
i µµµ
1
1
σ3=RSST
RSSTD ±= µ
CT f
MRSS ×= σ3
MRSSTD ±= µ
∑∑ =
−
=
−=
n
ki
i
k
i
i µµµ
1
1
∑=
=
n
i
Ti
1
2
)
3
(σ
σ×= aT t eS6
TD S6
±= µ
∑
=
=
n
i
Ti
1
2
3
σ ∑
=
=
n
i
e
C
T
pki
i
1
2
3
σ
Page 7
Coefficients
( )
() 1
1
5.0
+
−
−
=
nT
TTC
RSS
RSSWC
f
• MRSS coefficient,
• Limit size coefficient,
Cf
6~3=at
at
8.
Page 8
Coefficients
( )
() 1
1
5.0
+
−
−
=
nT
TTC
RSS
RSSWC
f
• MRSS coefficient,
• Limit size coefficient,
Cf
6~3=at
at
Limit sizes Process yield
(%)
Number of
rejects per
million
component
produced
µ±1σ 68.2 317310
µ±2σ 95.4 45500
µ±3σ 99.73 2700
µ±3.5σ 99.95 465
µ±4σ 99.994 63
µ±4.5σ 99.9993 6.8
µ±5σ 99.99994 0.6
µ±6σ 99.9999998 0.002
9.
Page 9
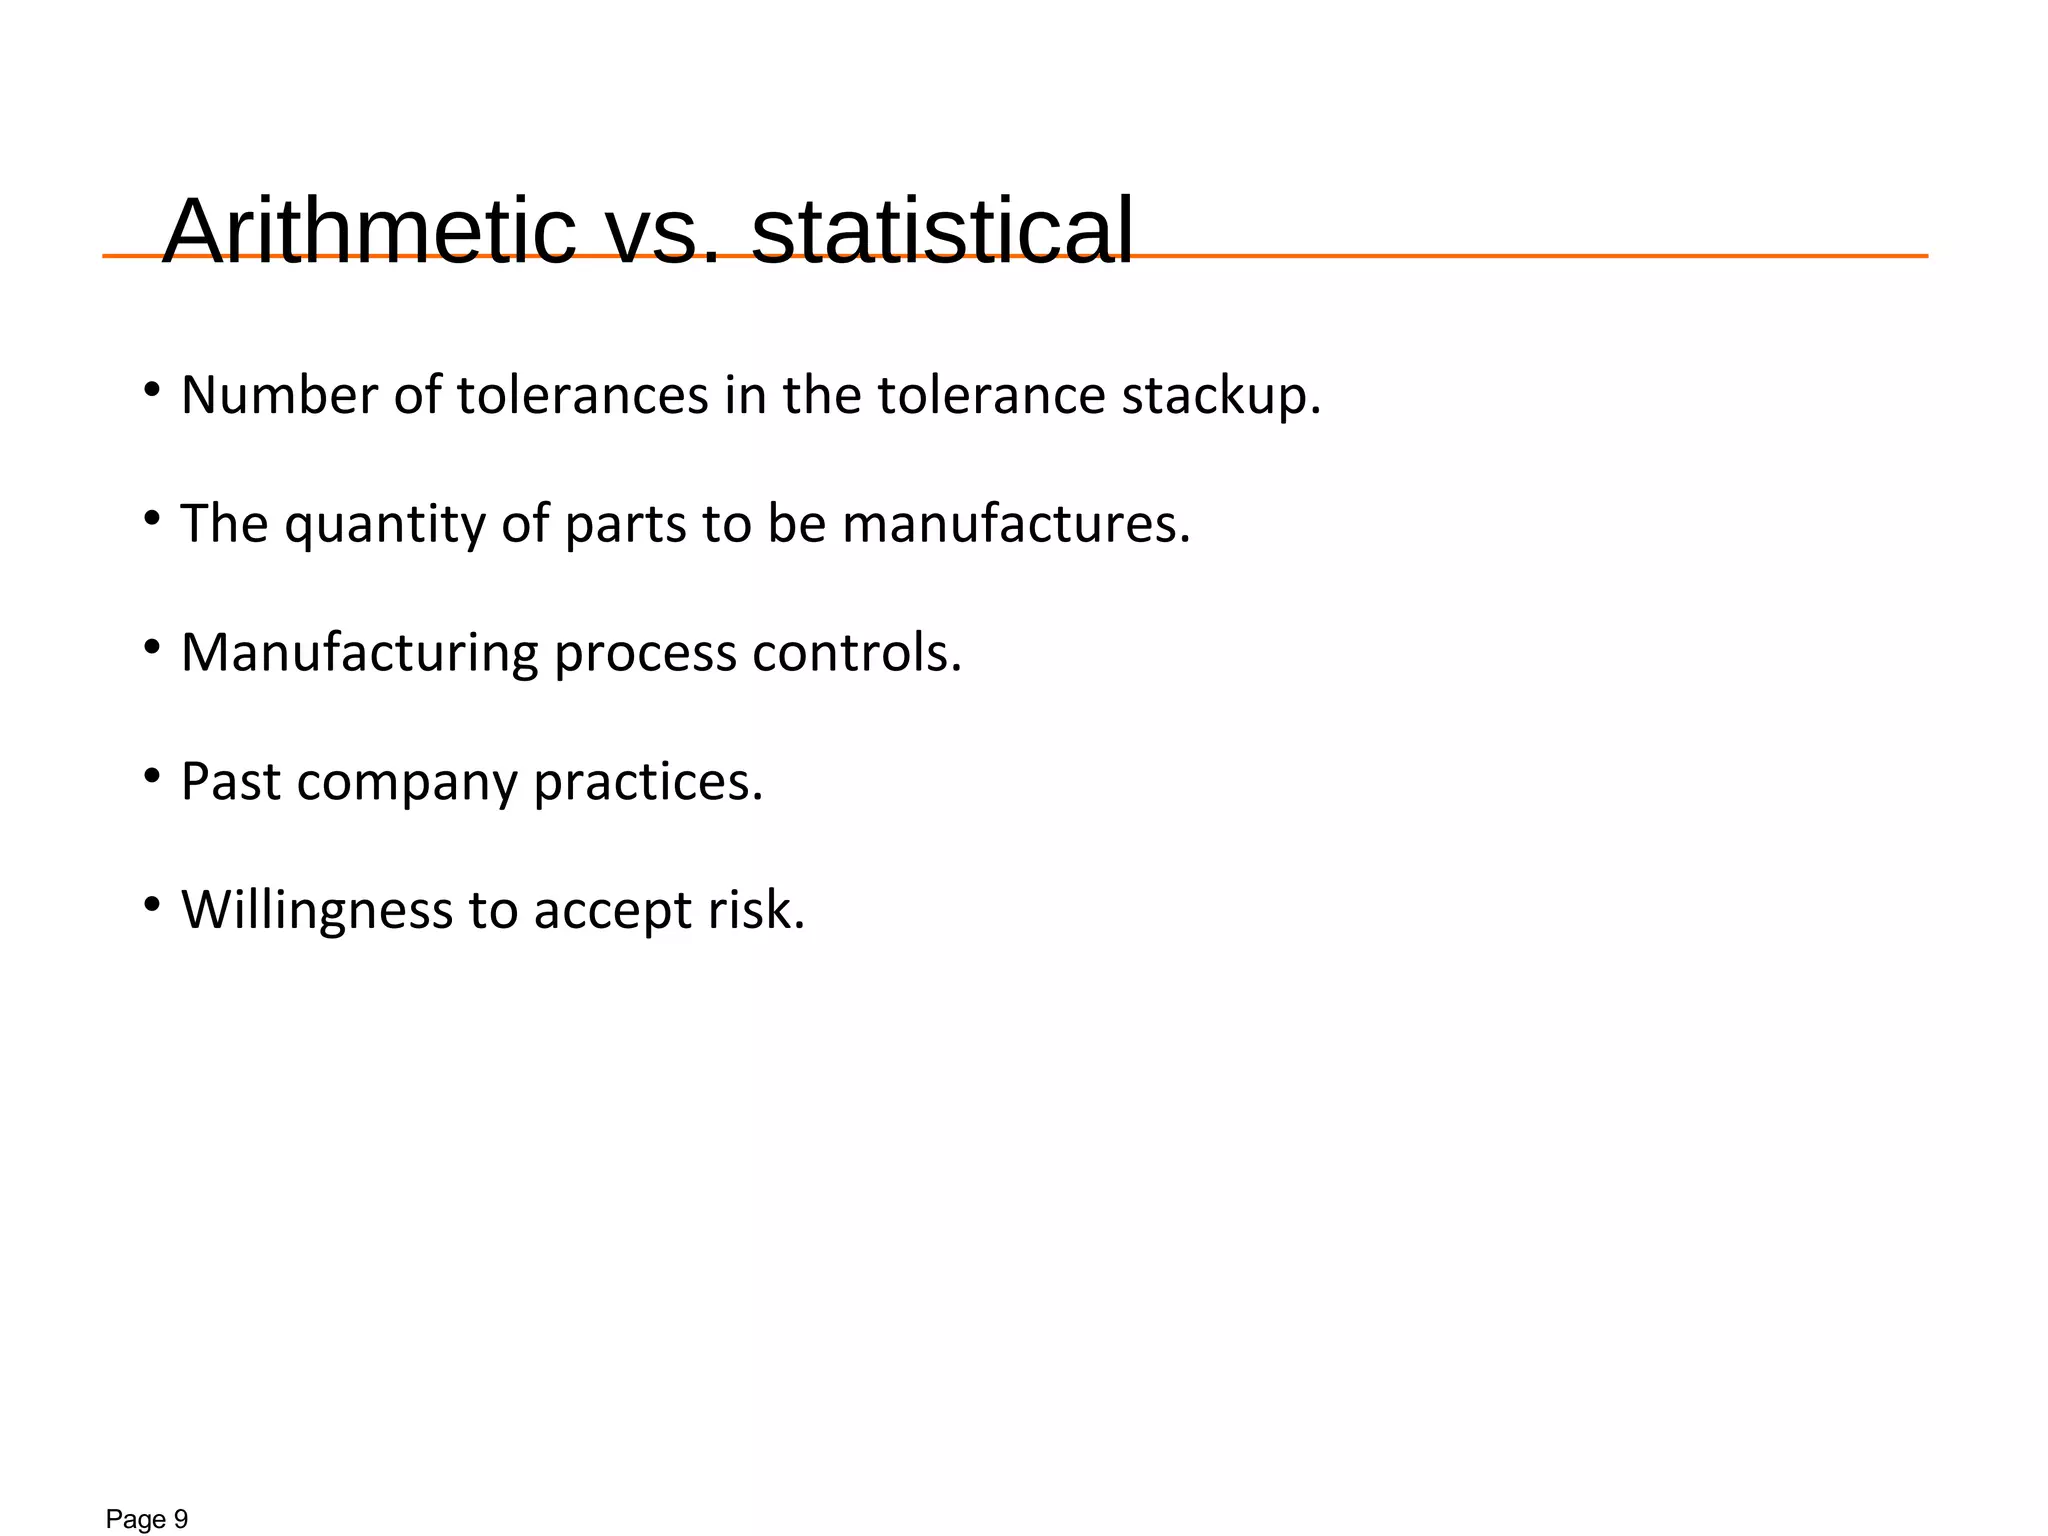
Arithmetic vs.statistical
• Number of tolerances in the tolerance stackup.
• The quantity of parts to be manufactures.
• Manufacturing process controls.
• Past company practices.
• Willingness to accept risk.
10.
Page 10
Step-by-step procedure
Equalbilateral
tolerancing
Define direction
of dimensions
Ite
m
+
Dim
-
Dim
Tol
1 30 ±0.2
2 45.5 ±0.5
3 13.5 ±0.5
Total 45.5 43.5 ±1.2
25.435.45 =−=µ 2.1±=Tol
Fill in table