Download to read offline

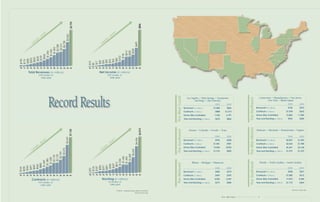


This document is Toll Brothers' annual report which summarizes their strong financial performance in fiscal year 2005, ending October 31, 2005. Some key points: - Toll Brothers had record results in 2005 with net income up 97% to $806.1 million, earnings per share up 90% to $4.78, total revenues up 50% to $5.79 billion, and contracts and backlog also up significantly. - They attribute their success to expanding their operations nationally, developing high-quality communities across various luxury housing segments, and having over 83,000 home sites under control to support future growth. - Looking ahead, Toll Brothers expects continued growth through expanding their community count and believes housing market fundament


