Download as PDF, PPTX


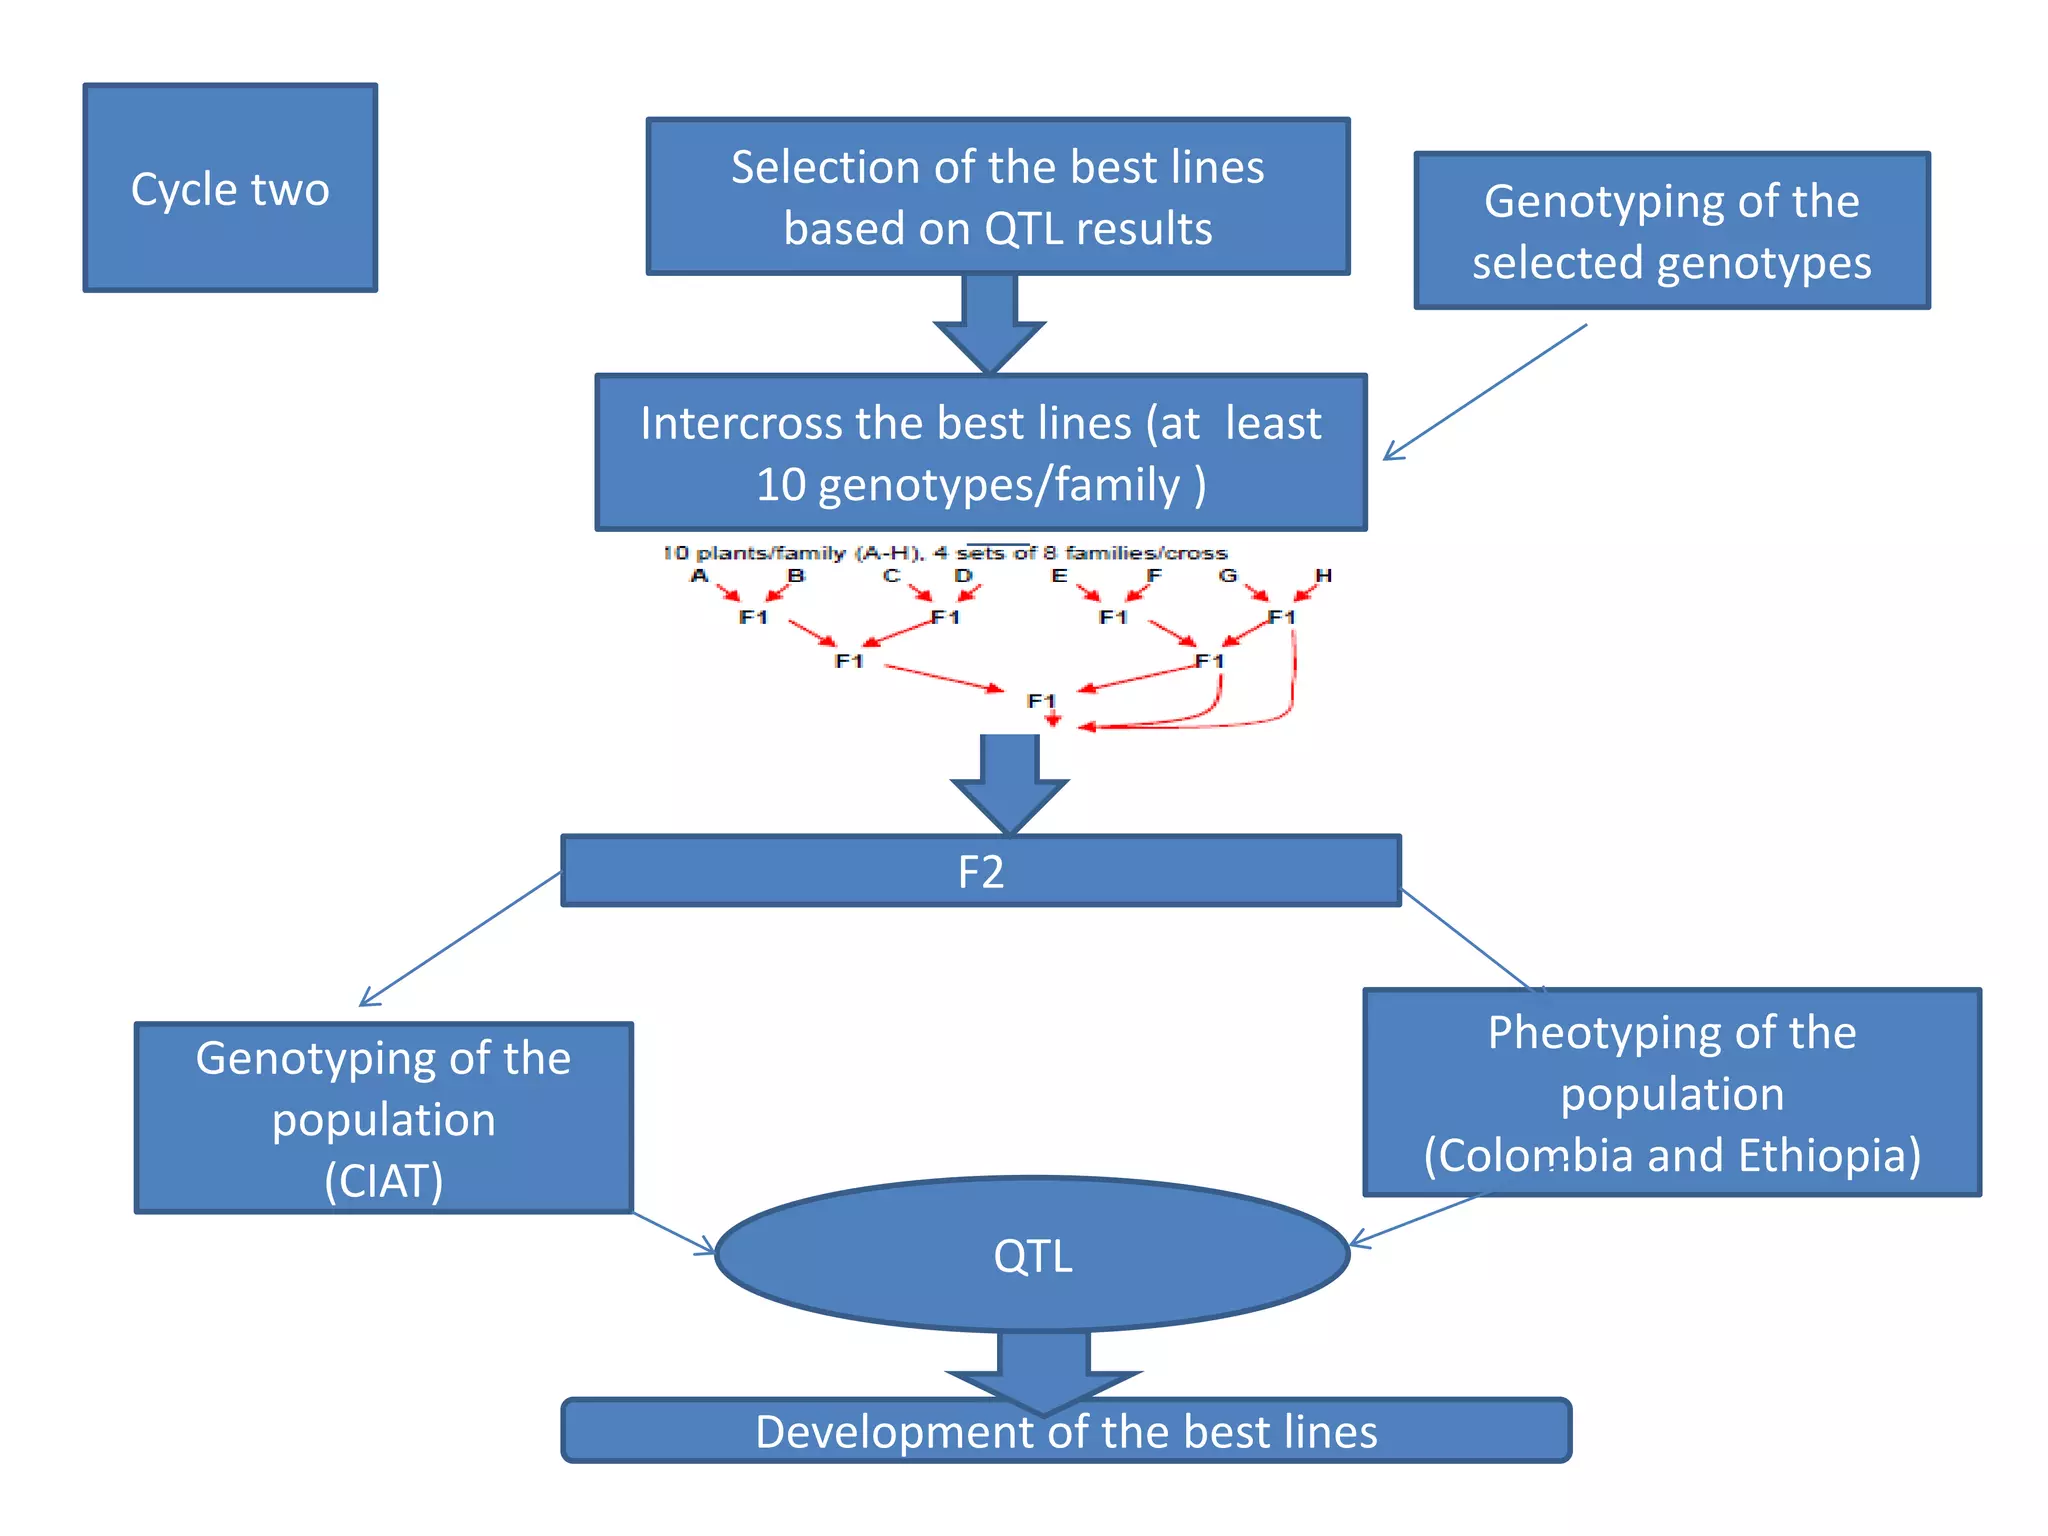
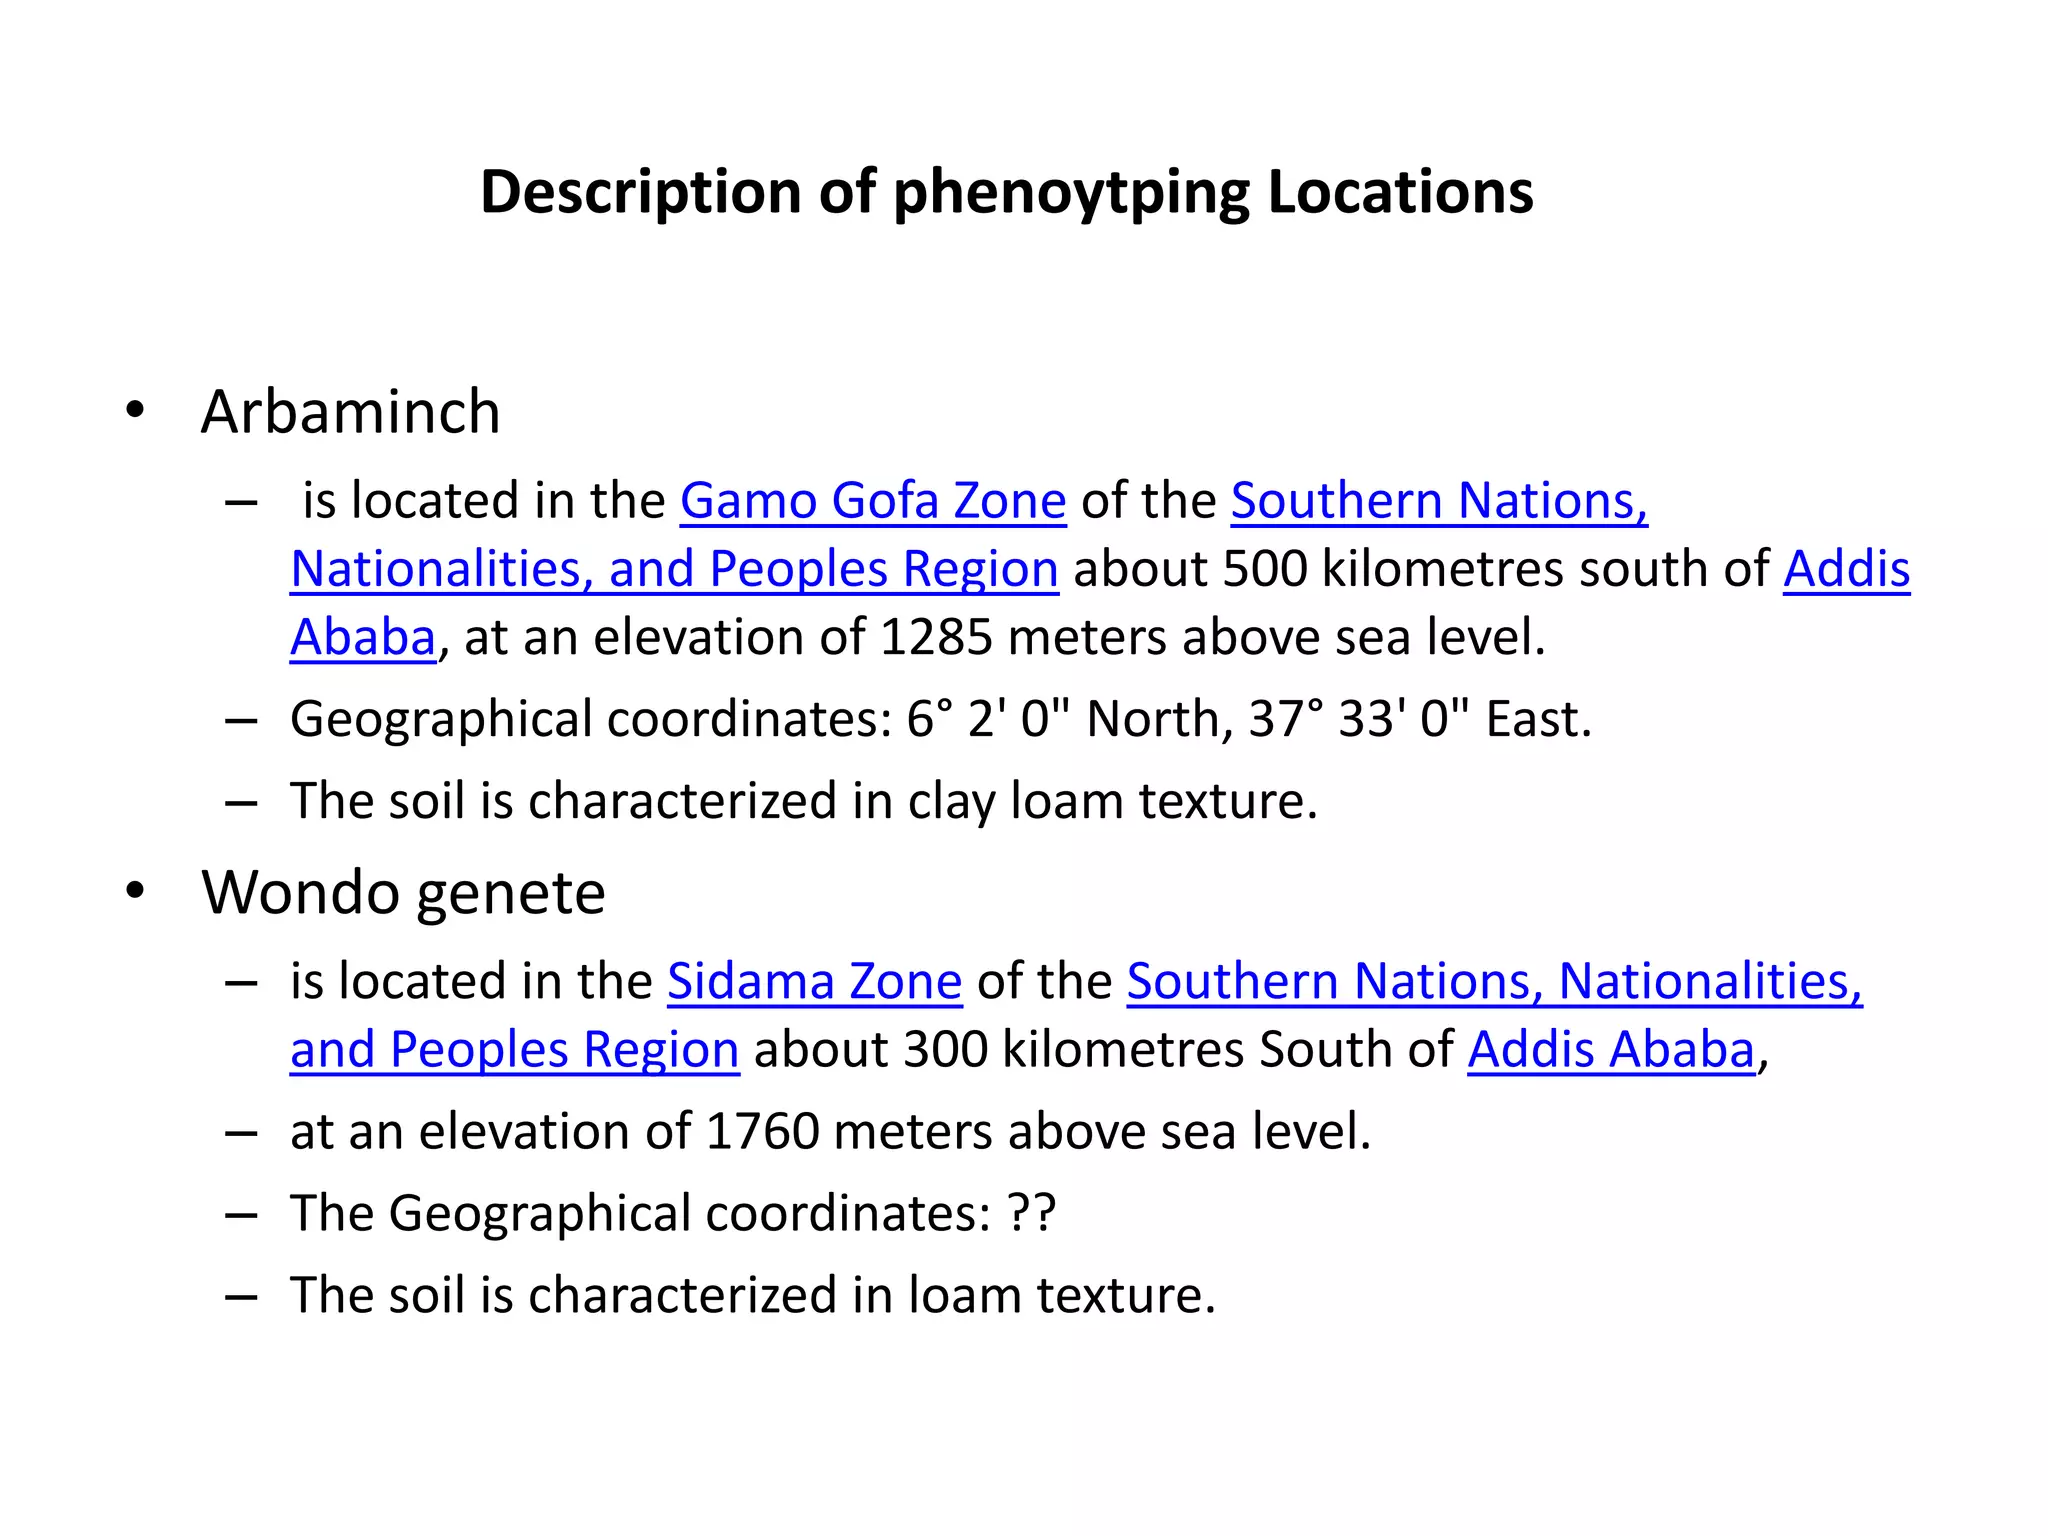


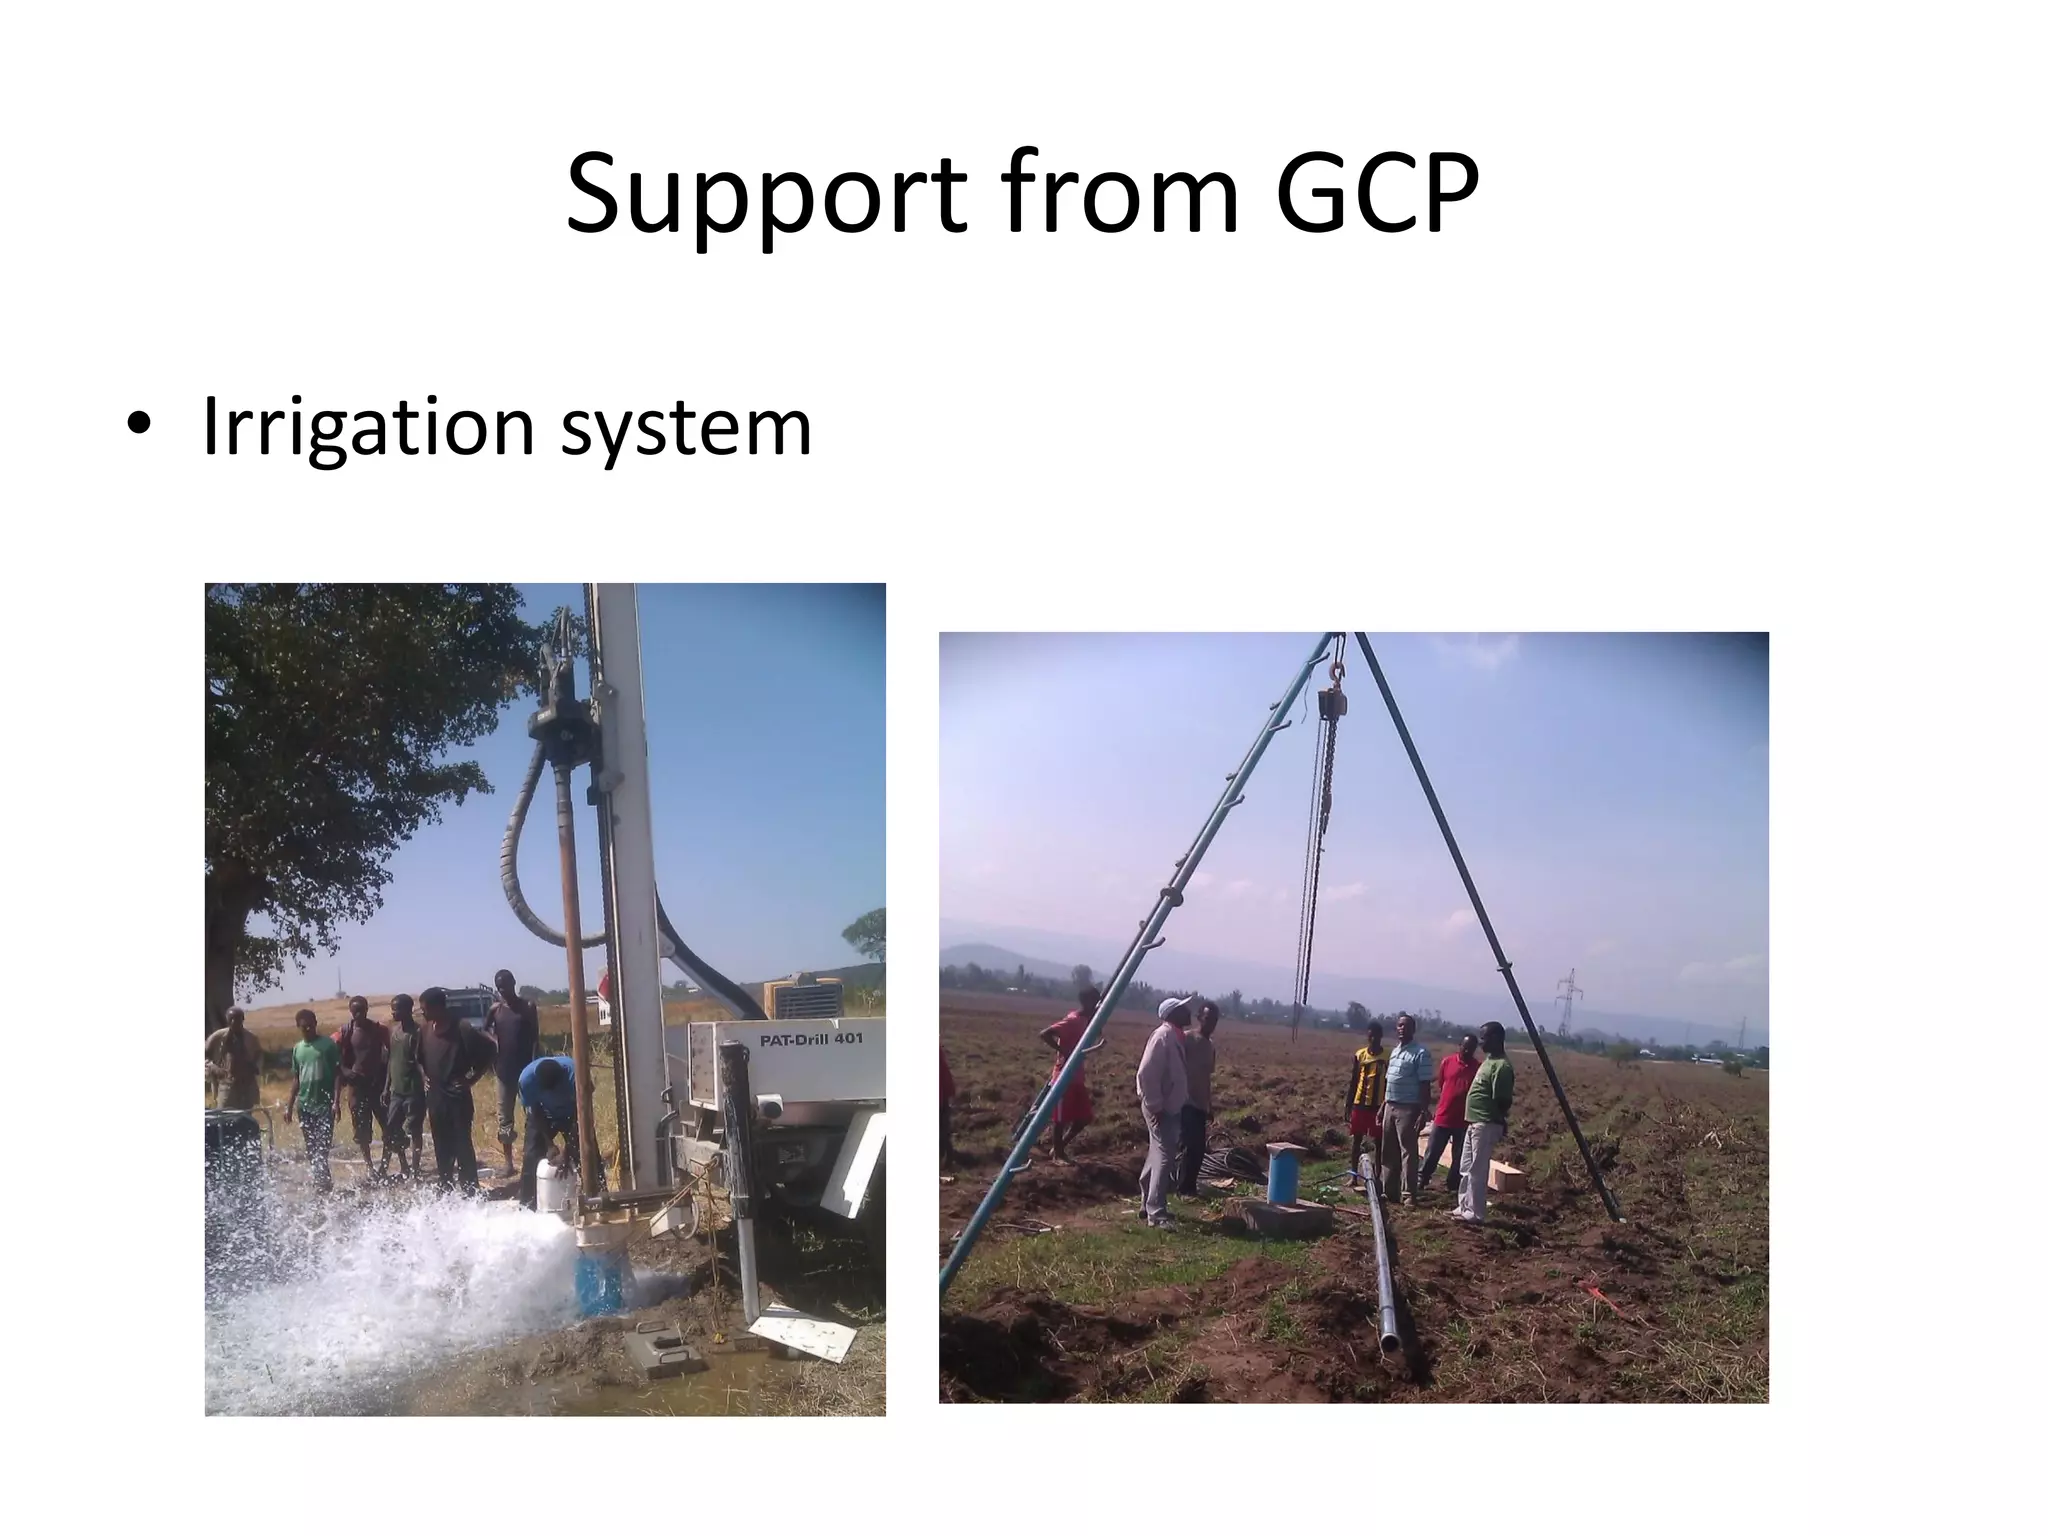


This document summarizes research on phenotyping common bean populations and breeding lines for drought and bean stem maggot (BSM) tolerance in Ethiopia. Two populations consisting of 82 and 100 recombinant inbred lines were evaluated at three locations under different stress conditions. Data was collected on various traits related to drought and BSM tolerance. The populations showed variability in their performance. Additionally, 36 Andean genotypes were evaluated for drought tolerance traits under irrigated and stressed conditions. A marker-assisted recurrent selection scheme was used to develop populations for further evaluating drought tolerance. The research was supported by various collaborators and organizations.


