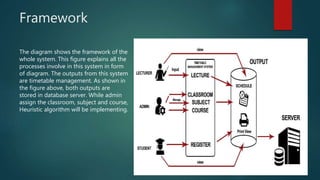
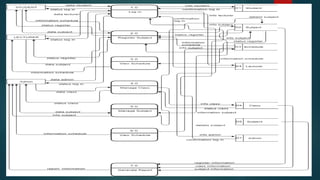
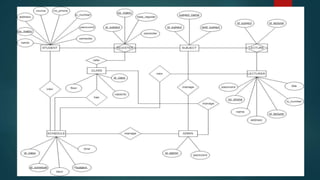
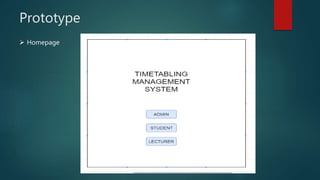
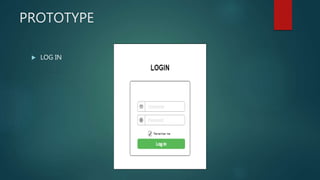
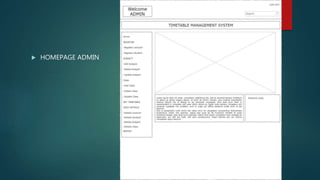
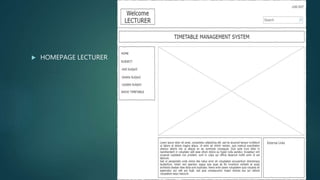
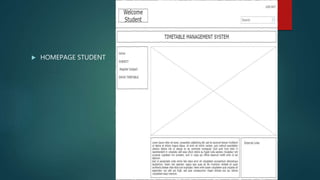
TIMETABLE MANAGEMENT SYSTEM USING AHP
CSW 35104: FINAL YEAR PROJECT 1
NAME : EMEER SHAFIQ BIN ROSLAN
NO MATRIC : 043039
SUBJECT : CSF 35104 FINAL YEAR PROJECT I
SUPERVISOR : DR. AZRUL AMRI BIN JAMAL
METHODOLOGY
Rapid Prototyping:
 The process of prototyping involves quick building up of a prototype or
working model for the purpose of testing the various design features,
ideas, concepts, functionality, output and performance.
 Refers to the creation of a model that will eventually be discarded rather
than becoming part of the final delivered software.
 The following illustration is a representation of the different phases of the
Rapid Prototyping model.
Rapid Prototyping - Design
TECHNIQUE USED :
ANALYTHIC HIERARCHY PROCESSTECHNIQUE USED :
ANALYTHIC HIERARCHY PROCESS
 AHP considers a set of evaluation criteria, and a set of alternative options
among which the best decision is to be made.
 It is important to note that, since some of the criteria could be contrasting,
it is not true in general that the best option is the one which optimizes
each single criterion, rather the one which achieves the most suitable
trade-off among the different criteria.
AHP CONCEPT
AHP ALGORITHM :
NUMERIC ALGORITHM
Assuming the AHP hierarchy on the left as our sample,
for :
Level 1 : Expertise Criteria (4 x 4 size)
Level 2 : Lecturer (3 x 3 size)
We have to make a comparison matrices, (4 X 4) and
(3 X 3)
Using equation :
Paired comparison matrix level 1 with
respect to the goal
Paired comparison matrix level 2 with respect
for Factor A
Paired comparison matrix level 2 with respect
for Factor B
Overall composite weight of the alternatives
Framework
The diagram shows the framework of the
whole system. This figure explains all the
processes involve in this system in form
of diagram. The outputs from this system
are timetable management. As shown in
the figure above, both outputs are
stored in database server. While admin
assign the classroom, subject and course,
Heuristic algorithm will be implementing.
Context Diagram
 Diagram below shows the context diagram that displays all the function of
the systems.
DATA FLOW DIAGRAM
 Diagram below shows the Data Flow Diagram level 0 that displays all the
function of the systems.
ERD DIAGRAM
 Diagram below shows the Entity Relationship Diagram that displays the
relationship of the systems.
id
Prototype
 Homepage
PROTOTYPE
 LOG IN
 HOMEPAGE ADMIN
 HOMEPAGE LECTURER
 HOMEPAGE STUDENT

Timetable management system(chapter 3)

  • 1.
    TIMETABLE MANAGEMENT SYSTEMUSING AHP CSW 35104: FINAL YEAR PROJECT 1 NAME : EMEER SHAFIQ BIN ROSLAN NO MATRIC : 043039 SUBJECT : CSF 35104 FINAL YEAR PROJECT I SUPERVISOR : DR. AZRUL AMRI BIN JAMAL
  • 2.
    METHODOLOGY Rapid Prototyping:  Theprocess of prototyping involves quick building up of a prototype or working model for the purpose of testing the various design features, ideas, concepts, functionality, output and performance.  Refers to the creation of a model that will eventually be discarded rather than becoming part of the final delivered software.  The following illustration is a representation of the different phases of the Rapid Prototyping model.
  • 3.
  • 4.
    TECHNIQUE USED : ANALYTHICHIERARCHY PROCESSTECHNIQUE USED : ANALYTHIC HIERARCHY PROCESS  AHP considers a set of evaluation criteria, and a set of alternative options among which the best decision is to be made.  It is important to note that, since some of the criteria could be contrasting, it is not true in general that the best option is the one which optimizes each single criterion, rather the one which achieves the most suitable trade-off among the different criteria.
  • 5.
  • 6.
    AHP ALGORITHM : NUMERICALGORITHM Assuming the AHP hierarchy on the left as our sample, for : Level 1 : Expertise Criteria (4 x 4 size) Level 2 : Lecturer (3 x 3 size) We have to make a comparison matrices, (4 X 4) and (3 X 3) Using equation :
  • 7.
    Paired comparison matrixlevel 1 with respect to the goal Paired comparison matrix level 2 with respect for Factor A
  • 8.
    Paired comparison matrixlevel 2 with respect for Factor B Overall composite weight of the alternatives
  • 9.
    Framework The diagram showsthe framework of the whole system. This figure explains all the processes involve in this system in form of diagram. The outputs from this system are timetable management. As shown in the figure above, both outputs are stored in database server. While admin assign the classroom, subject and course, Heuristic algorithm will be implementing.
  • 10.
    Context Diagram  Diagrambelow shows the context diagram that displays all the function of the systems.
  • 12.
    DATA FLOW DIAGRAM Diagram below shows the Data Flow Diagram level 0 that displays all the function of the systems.
  • 14.
    ERD DIAGRAM  Diagrambelow shows the Entity Relationship Diagram that displays the relationship of the systems.
  • 15.
  • 16.
  • 17.
  • 18.
  • 19.
  • 20.