Downloaded 232 times
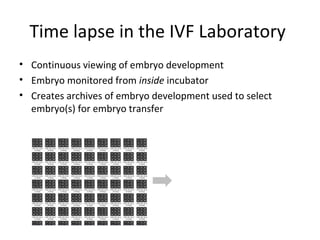
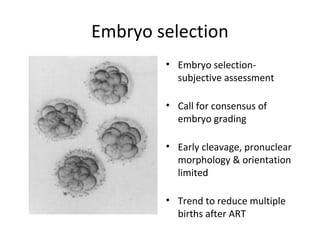
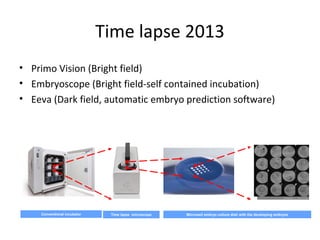
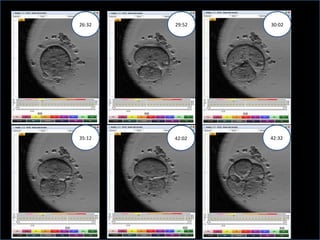
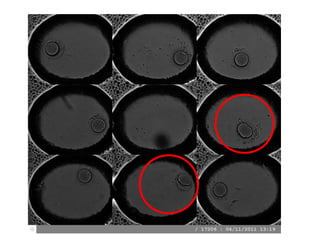
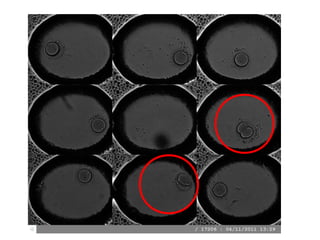
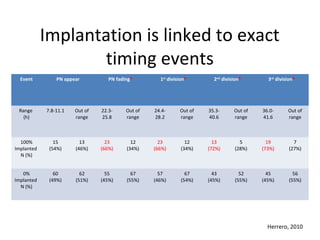
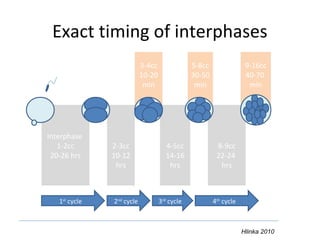
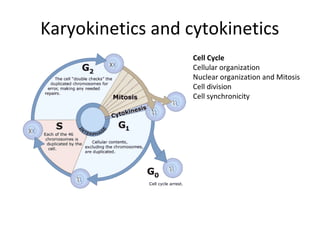
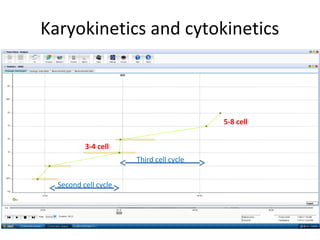
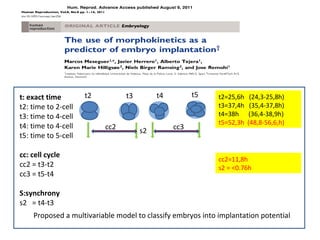
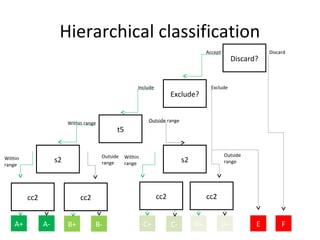
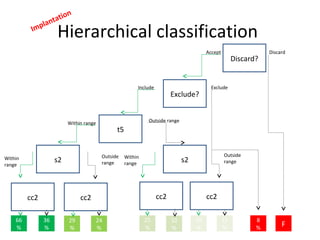
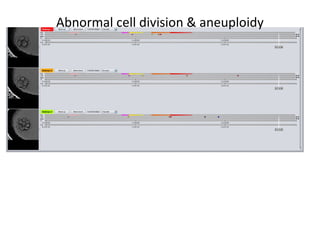
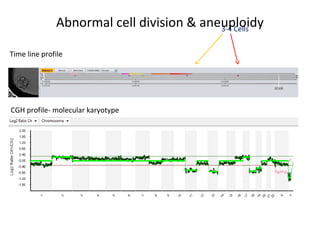
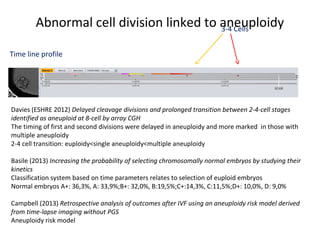
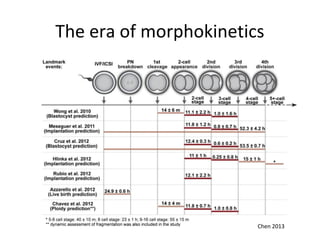
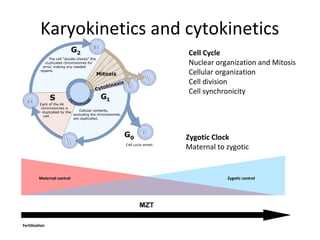
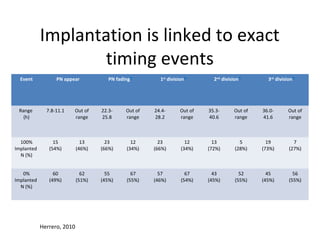

Time lapse observation of embryos through incubation allows continuous monitoring of development from fertilization. This non-invasive technique creates a developmental timeline used to assess embryo health and select the best embryo for transfer based on adherence to normal timing of cleavages and divisions. Precise timing data of early embryonic events like pronuclear fading and cell divisions correlates with implantation potential, with substantial deviations linked to lower success rates. Abnormal cell patterns or asynchronous cell cycles seen through time lapse also indicate higher risk of aneuploidy.


