SlideShare a Scribd company logo
Theoritical Statistics
Example 1:
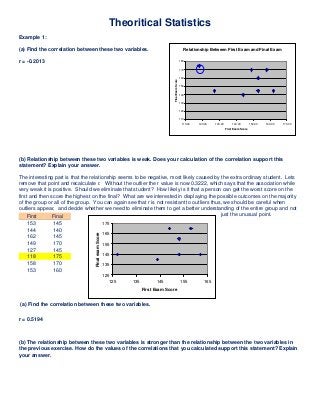
(a) Find the correlation between these two variables.
r = -0.2013
(b) Relationship between these two variables is weak. Does your calculation of the correlation support this
statement? Explain your answer.
The interesting part is that the relationship seems to be negative, most likely caused by the extra ordinary student. Lets
remove that point and recalculate r. Without the outlier the r value is now 0.3222, which says that the association while
very weak it is positive. Should we eliminate that student? How likely is it that a person can get the worst score on the
first and then score the highest on the final? What are we interested in displaying the possible outcomes on the majority
of the group or all of the group. You can again see that r is not resistant to outliers thus, we should be careful when
outliers appear, and decide whether we need to eliminate them to get a better understanding of the entire group and not
just the unusual point.
(a) Find the correlation between these two variables.
r = 0.5194
(b) The relationship between these two variables is stronger than the relationship between the two variables in
the previous exercise. How do the values of the correlations that you calculated support this statement? Explain
your answer.
First Final
153 145
144 140
162 145
149 170
127 145
118 175
158 170
153 160
Relationship Between First Exam and Final Exam
110
120
130
140
150
160
170
180
110.00 120.00 130.00 140.00 150.00 160.00 170.00
First Exam Score
FinalExamScore
125
135
145
155
165
175
125 135 145 155 165
First Exam Score
FinalexamScore
The variation about a straight line seems to be less and as the second exam score increases there is a larger increase in
the average value of the final exam score. Yet one can still see a quite a lot of variation about the average trend line, thus
the reason for the correlation value of 0.5194.
130
140
150
160
170
180
190
200
130 140 150 160 170 180
Score for Second Exam
ScoreonFinal
Example 2:
Refer to the previous exercise. Add a ninth student whose scores on the second test and final exam would lead
you to classify the additional data point as an outlier. Recalculate the correlation with this additional case and
summarize the effect it has on the value of the correlation.
Second Final
1 158 145
2 162 140
3 144 145
4 162 170
5 136 145
6 158 175
7 175 170
8 153 160
9 200 200
The ninth student gets two perfect scores on the second and the final (assuming that 200 is the most one can
score). The corresponding r value is 0.8015. This is quite a large change from r = 0.5194.
130
140
150
160
170
180
190
200
130 140 150 160 170 180 190 200 210
Score for Second Exam
ScoreonFinal
Example 3:
Make a scatterplot find the correlation r. Explain why r is close to zero despite a strong relationship between
speed and gas used.
The value of r = -0.1716
The value of r only measures how close our data
follows a linear relationship, which this situation
does not.
Notice r = 0 despite the fact that we do not have a
straight line. This shows the importance of looking
at the scatterplot.
Example 4:-
What's wrong? Each of the following statements
contains a blunder. Explain in each case what is wrong.
(a) "There is a high correlation between the gender of American workers and their income."
Gender is a categorical variable. The correlation value r is only to be used to indicate linear association between two
quantitative variables.
(b) "We found a high correlation (r = 1.09) between students' ratings of faculty teaching and ratings made by other
faculty members."
The r value can only be a number in the interval [-1, 1].
Chart Title
0
5
10
15
20
25
0 50 100 150 200
Speed (km/h)
FuelSpent(l/100km)
Fuel
Linear (Fuel)
(c) "The correlation between planting rate and yield of corn was found to be r = 0.23 bushel."
The statistic r is a unitless number, thus the statement above, “…was found to be r = 0.23 bushel." attaches a unit to r
which is not correct. The correlation r does not depend on the unit of the measurement.

More Related Content

Recently uploaded

The basics of sentences session 4pptx.pptx
The basics of sentences session 4pptx.pptxThe basics of sentences session 4pptx.pptx
The basics of sentences session 4pptx.pptx
heathfieldcps1
 

Recently uploaded (20)

[GDSC YCCE] Build with AI Online Presentation
[GDSC YCCE] Build with AI Online Presentation[GDSC YCCE] Build with AI Online Presentation
[GDSC YCCE] Build with AI Online Presentation
 
How to Split Bills in the Odoo 17 POS Module
How to Split Bills in the Odoo 17 POS ModuleHow to Split Bills in the Odoo 17 POS Module
How to Split Bills in the Odoo 17 POS Module
 
Incoming and Outgoing Shipments in 2 STEPS Using Odoo 17
Incoming and Outgoing Shipments in 2 STEPS Using Odoo 17Incoming and Outgoing Shipments in 2 STEPS Using Odoo 17
Incoming and Outgoing Shipments in 2 STEPS Using Odoo 17
 
B.ed spl. HI pdusu exam paper-2023-24.pdf
B.ed spl. HI pdusu exam paper-2023-24.pdfB.ed spl. HI pdusu exam paper-2023-24.pdf
B.ed spl. HI pdusu exam paper-2023-24.pdf
 
Sectors of the Indian Economy - Class 10 Study Notes pdf
Sectors of the Indian Economy - Class 10 Study Notes pdfSectors of the Indian Economy - Class 10 Study Notes pdf
Sectors of the Indian Economy - Class 10 Study Notes pdf
 
The basics of sentences session 4pptx.pptx
The basics of sentences session 4pptx.pptxThe basics of sentences session 4pptx.pptx
The basics of sentences session 4pptx.pptx
 
The Last Leaf, a short story by O. Henry
The Last Leaf, a short story by O. HenryThe Last Leaf, a short story by O. Henry
The Last Leaf, a short story by O. Henry
 
MARUTI SUZUKI- A Successful Joint Venture in India.pptx
MARUTI SUZUKI- A Successful Joint Venture in India.pptxMARUTI SUZUKI- A Successful Joint Venture in India.pptx
MARUTI SUZUKI- A Successful Joint Venture in India.pptx
 
Phrasal Verbs.XXXXXXXXXXXXXXXXXXXXXXXXXX
Phrasal Verbs.XXXXXXXXXXXXXXXXXXXXXXXXXXPhrasal Verbs.XXXXXXXXXXXXXXXXXXXXXXXXXX
Phrasal Verbs.XXXXXXXXXXXXXXXXXXXXXXXXXX
 
slides CapTechTalks Webinar May 2024 Alexander Perry.pptx
slides CapTechTalks Webinar May 2024 Alexander Perry.pptxslides CapTechTalks Webinar May 2024 Alexander Perry.pptx
slides CapTechTalks Webinar May 2024 Alexander Perry.pptx
 
Operations Management - Book1.p - Dr. Abdulfatah A. Salem
Operations Management - Book1.p  - Dr. Abdulfatah A. SalemOperations Management - Book1.p  - Dr. Abdulfatah A. Salem
Operations Management - Book1.p - Dr. Abdulfatah A. Salem
 
Basic phrases for greeting and assisting costumers
Basic phrases for greeting and assisting costumersBasic phrases for greeting and assisting costumers
Basic phrases for greeting and assisting costumers
 
Telling Your Story_ Simple Steps to Build Your Nonprofit's Brand Webinar.pdf
Telling Your Story_ Simple Steps to Build Your Nonprofit's Brand Webinar.pdfTelling Your Story_ Simple Steps to Build Your Nonprofit's Brand Webinar.pdf
Telling Your Story_ Simple Steps to Build Your Nonprofit's Brand Webinar.pdf
 
INU_CAPSTONEDESIGN_비밀번호486_업로드용 발표자료.pdf
INU_CAPSTONEDESIGN_비밀번호486_업로드용 발표자료.pdfINU_CAPSTONEDESIGN_비밀번호486_업로드용 발표자료.pdf
INU_CAPSTONEDESIGN_비밀번호486_업로드용 발표자료.pdf
 
The Benefits and Challenges of Open Educational Resources
The Benefits and Challenges of Open Educational ResourcesThe Benefits and Challenges of Open Educational Resources
The Benefits and Challenges of Open Educational Resources
 
NCERT Solutions Power Sharing Class 10 Notes pdf
NCERT Solutions Power Sharing Class 10 Notes pdfNCERT Solutions Power Sharing Class 10 Notes pdf
NCERT Solutions Power Sharing Class 10 Notes pdf
 
GIÁO ÁN DẠY THÊM (KẾ HOẠCH BÀI BUỔI 2) - TIẾNG ANH 8 GLOBAL SUCCESS (2 CỘT) N...
GIÁO ÁN DẠY THÊM (KẾ HOẠCH BÀI BUỔI 2) - TIẾNG ANH 8 GLOBAL SUCCESS (2 CỘT) N...GIÁO ÁN DẠY THÊM (KẾ HOẠCH BÀI BUỔI 2) - TIẾNG ANH 8 GLOBAL SUCCESS (2 CỘT) N...
GIÁO ÁN DẠY THÊM (KẾ HOẠCH BÀI BUỔI 2) - TIẾNG ANH 8 GLOBAL SUCCESS (2 CỘT) N...
 
aaaaaaaaaaaaaaaaaaaaaaaaaaaaaaaaaaaaaaaaaaaaaaaaaaaaaaa
aaaaaaaaaaaaaaaaaaaaaaaaaaaaaaaaaaaaaaaaaaaaaaaaaaaaaaaaaaaaaaaaaaaaaaaaaaaaaaaaaaaaaaaaaaaaaaaaaaaaaaaaaaaaaa
aaaaaaaaaaaaaaaaaaaaaaaaaaaaaaaaaaaaaaaaaaaaaaaaaaaaaaa
 
Pragya Champions Chalice 2024 Prelims & Finals Q/A set, General Quiz
Pragya Champions Chalice 2024 Prelims & Finals Q/A set, General QuizPragya Champions Chalice 2024 Prelims & Finals Q/A set, General Quiz
Pragya Champions Chalice 2024 Prelims & Finals Q/A set, General Quiz
 
How to Break the cycle of negative Thoughts
How to Break the cycle of negative ThoughtsHow to Break the cycle of negative Thoughts
How to Break the cycle of negative Thoughts
 

Featured

Social Media Marketing Trends 2024 // The Global Indie Insights
Social Media Marketing Trends 2024 // The Global Indie InsightsSocial Media Marketing Trends 2024 // The Global Indie Insights
Social Media Marketing Trends 2024 // The Global Indie Insights
Kurio // The Social Media Age(ncy)
 

Featured (20)

Skeleton Culture Code
Skeleton Culture CodeSkeleton Culture Code
Skeleton Culture Code
 
PEPSICO Presentation to CAGNY Conference Feb 2024
PEPSICO Presentation to CAGNY Conference Feb 2024PEPSICO Presentation to CAGNY Conference Feb 2024
PEPSICO Presentation to CAGNY Conference Feb 2024
 
Content Methodology: A Best Practices Report (Webinar)
Content Methodology: A Best Practices Report (Webinar)Content Methodology: A Best Practices Report (Webinar)
Content Methodology: A Best Practices Report (Webinar)
 
How to Prepare For a Successful Job Search for 2024
How to Prepare For a Successful Job Search for 2024How to Prepare For a Successful Job Search for 2024
How to Prepare For a Successful Job Search for 2024
 
Social Media Marketing Trends 2024 // The Global Indie Insights
Social Media Marketing Trends 2024 // The Global Indie InsightsSocial Media Marketing Trends 2024 // The Global Indie Insights
Social Media Marketing Trends 2024 // The Global Indie Insights
 
Trends In Paid Search: Navigating The Digital Landscape In 2024
Trends In Paid Search: Navigating The Digital Landscape In 2024Trends In Paid Search: Navigating The Digital Landscape In 2024
Trends In Paid Search: Navigating The Digital Landscape In 2024
 
5 Public speaking tips from TED - Visualized summary
5 Public speaking tips from TED - Visualized summary5 Public speaking tips from TED - Visualized summary
5 Public speaking tips from TED - Visualized summary
 
ChatGPT and the Future of Work - Clark Boyd
ChatGPT and the Future of Work - Clark Boyd ChatGPT and the Future of Work - Clark Boyd
ChatGPT and the Future of Work - Clark Boyd
 
Getting into the tech field. what next
Getting into the tech field. what next Getting into the tech field. what next
Getting into the tech field. what next
 
Google's Just Not That Into You: Understanding Core Updates & Search Intent
Google's Just Not That Into You: Understanding Core Updates & Search IntentGoogle's Just Not That Into You: Understanding Core Updates & Search Intent
Google's Just Not That Into You: Understanding Core Updates & Search Intent
 
How to have difficult conversations
How to have difficult conversations How to have difficult conversations
How to have difficult conversations
 
Introduction to Data Science
Introduction to Data ScienceIntroduction to Data Science
Introduction to Data Science
 
Time Management & Productivity - Best Practices
Time Management & Productivity -  Best PracticesTime Management & Productivity -  Best Practices
Time Management & Productivity - Best Practices
 
The six step guide to practical project management
The six step guide to practical project managementThe six step guide to practical project management
The six step guide to practical project management
 
Beginners Guide to TikTok for Search - Rachel Pearson - We are Tilt __ Bright...
Beginners Guide to TikTok for Search - Rachel Pearson - We are Tilt __ Bright...Beginners Guide to TikTok for Search - Rachel Pearson - We are Tilt __ Bright...
Beginners Guide to TikTok for Search - Rachel Pearson - We are Tilt __ Bright...
 
Unlocking the Power of ChatGPT and AI in Testing - A Real-World Look, present...
Unlocking the Power of ChatGPT and AI in Testing - A Real-World Look, present...Unlocking the Power of ChatGPT and AI in Testing - A Real-World Look, present...
Unlocking the Power of ChatGPT and AI in Testing - A Real-World Look, present...
 
12 Ways to Increase Your Influence at Work
12 Ways to Increase Your Influence at Work12 Ways to Increase Your Influence at Work
12 Ways to Increase Your Influence at Work
 
ChatGPT webinar slides
ChatGPT webinar slidesChatGPT webinar slides
ChatGPT webinar slides
 
More than Just Lines on a Map: Best Practices for U.S Bike Routes
More than Just Lines on a Map: Best Practices for U.S Bike RoutesMore than Just Lines on a Map: Best Practices for U.S Bike Routes
More than Just Lines on a Map: Best Practices for U.S Bike Routes
 
Ride the Storm: Navigating Through Unstable Periods / Katerina Rudko (Belka G...
Ride the Storm: Navigating Through Unstable Periods / Katerina Rudko (Belka G...Ride the Storm: Navigating Through Unstable Periods / Katerina Rudko (Belka G...
Ride the Storm: Navigating Through Unstable Periods / Katerina Rudko (Belka G...
 

Theoritical Statistics Assignment Help

  • 1. Theoritical Statistics Example 1: (a) Find the correlation between these two variables. r = -0.2013 (b) Relationship between these two variables is weak. Does your calculation of the correlation support this statement? Explain your answer. The interesting part is that the relationship seems to be negative, most likely caused by the extra ordinary student. Lets remove that point and recalculate r. Without the outlier the r value is now 0.3222, which says that the association while very weak it is positive. Should we eliminate that student? How likely is it that a person can get the worst score on the first and then score the highest on the final? What are we interested in displaying the possible outcomes on the majority of the group or all of the group. You can again see that r is not resistant to outliers thus, we should be careful when outliers appear, and decide whether we need to eliminate them to get a better understanding of the entire group and not just the unusual point. (a) Find the correlation between these two variables. r = 0.5194 (b) The relationship between these two variables is stronger than the relationship between the two variables in the previous exercise. How do the values of the correlations that you calculated support this statement? Explain your answer. First Final 153 145 144 140 162 145 149 170 127 145 118 175 158 170 153 160 Relationship Between First Exam and Final Exam 110 120 130 140 150 160 170 180 110.00 120.00 130.00 140.00 150.00 160.00 170.00 First Exam Score FinalExamScore 125 135 145 155 165 175 125 135 145 155 165 First Exam Score FinalexamScore
  • 2. The variation about a straight line seems to be less and as the second exam score increases there is a larger increase in the average value of the final exam score. Yet one can still see a quite a lot of variation about the average trend line, thus the reason for the correlation value of 0.5194. 130 140 150 160 170 180 190 200 130 140 150 160 170 180 Score for Second Exam ScoreonFinal Example 2: Refer to the previous exercise. Add a ninth student whose scores on the second test and final exam would lead you to classify the additional data point as an outlier. Recalculate the correlation with this additional case and summarize the effect it has on the value of the correlation. Second Final 1 158 145 2 162 140 3 144 145 4 162 170 5 136 145 6 158 175 7 175 170 8 153 160 9 200 200 The ninth student gets two perfect scores on the second and the final (assuming that 200 is the most one can score). The corresponding r value is 0.8015. This is quite a large change from r = 0.5194.
  • 3. 130 140 150 160 170 180 190 200 130 140 150 160 170 180 190 200 210 Score for Second Exam ScoreonFinal Example 3: Make a scatterplot find the correlation r. Explain why r is close to zero despite a strong relationship between speed and gas used. The value of r = -0.1716 The value of r only measures how close our data follows a linear relationship, which this situation does not. Notice r = 0 despite the fact that we do not have a straight line. This shows the importance of looking at the scatterplot. Example 4:- What's wrong? Each of the following statements contains a blunder. Explain in each case what is wrong. (a) "There is a high correlation between the gender of American workers and their income." Gender is a categorical variable. The correlation value r is only to be used to indicate linear association between two quantitative variables. (b) "We found a high correlation (r = 1.09) between students' ratings of faculty teaching and ratings made by other faculty members." The r value can only be a number in the interval [-1, 1]. Chart Title 0 5 10 15 20 25 0 50 100 150 200 Speed (km/h) FuelSpent(l/100km) Fuel Linear (Fuel)
  • 4. (c) "The correlation between planting rate and yield of corn was found to be r = 0.23 bushel." The statistic r is a unitless number, thus the statement above, “…was found to be r = 0.23 bushel." attaches a unit to r which is not correct. The correlation r does not depend on the unit of the measurement.