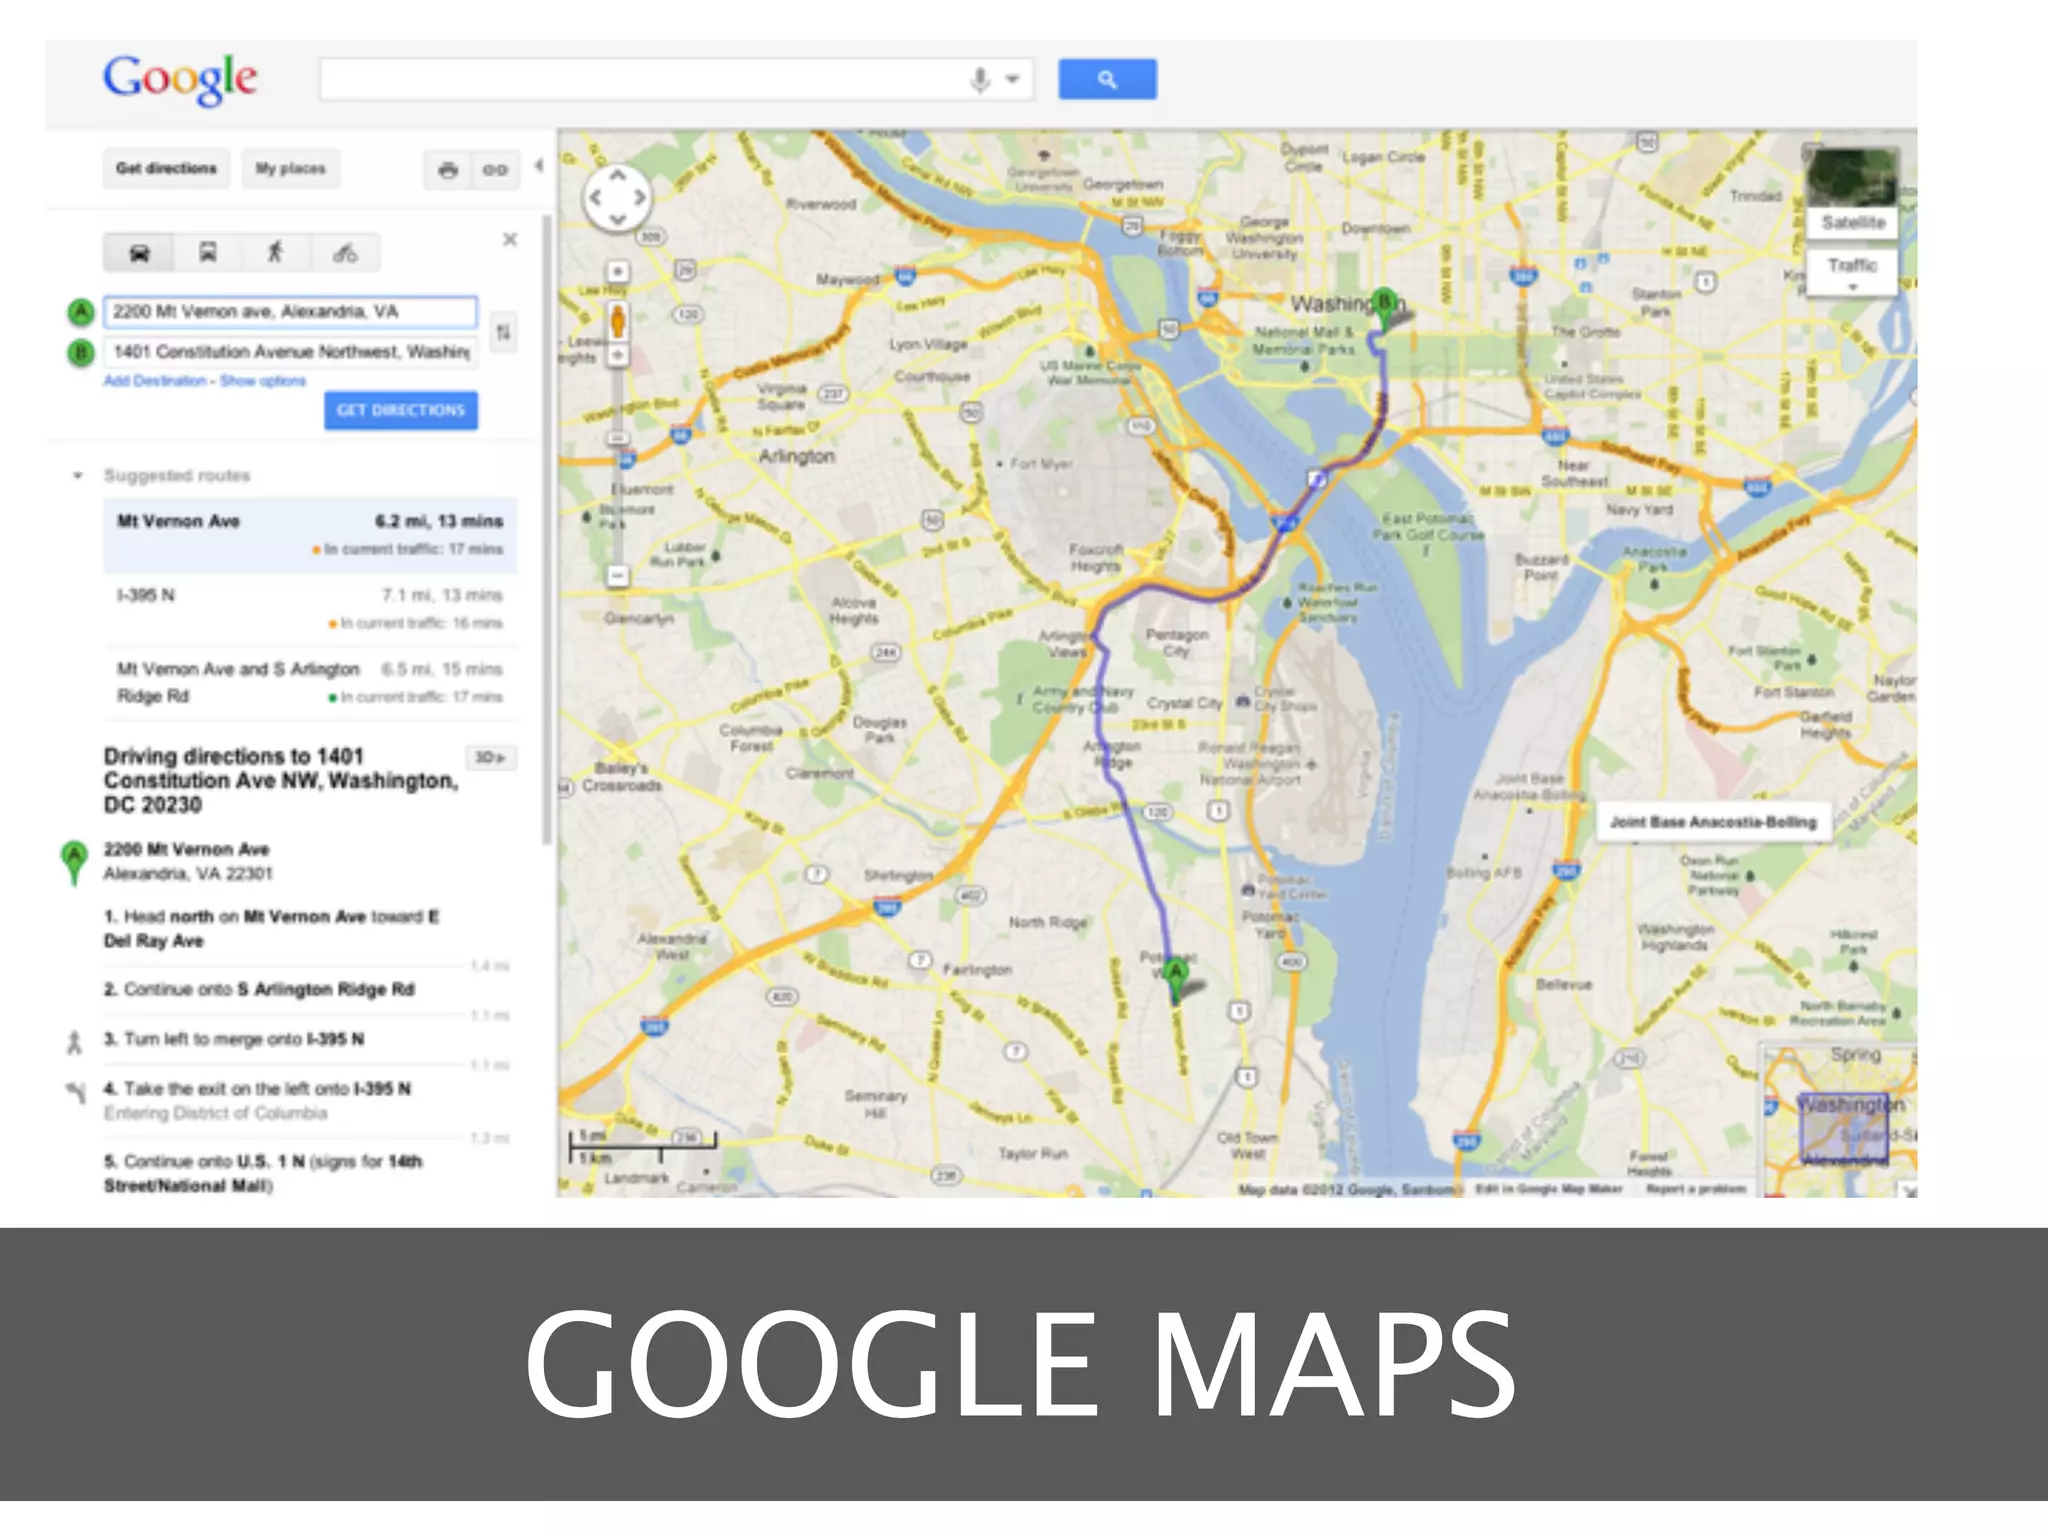
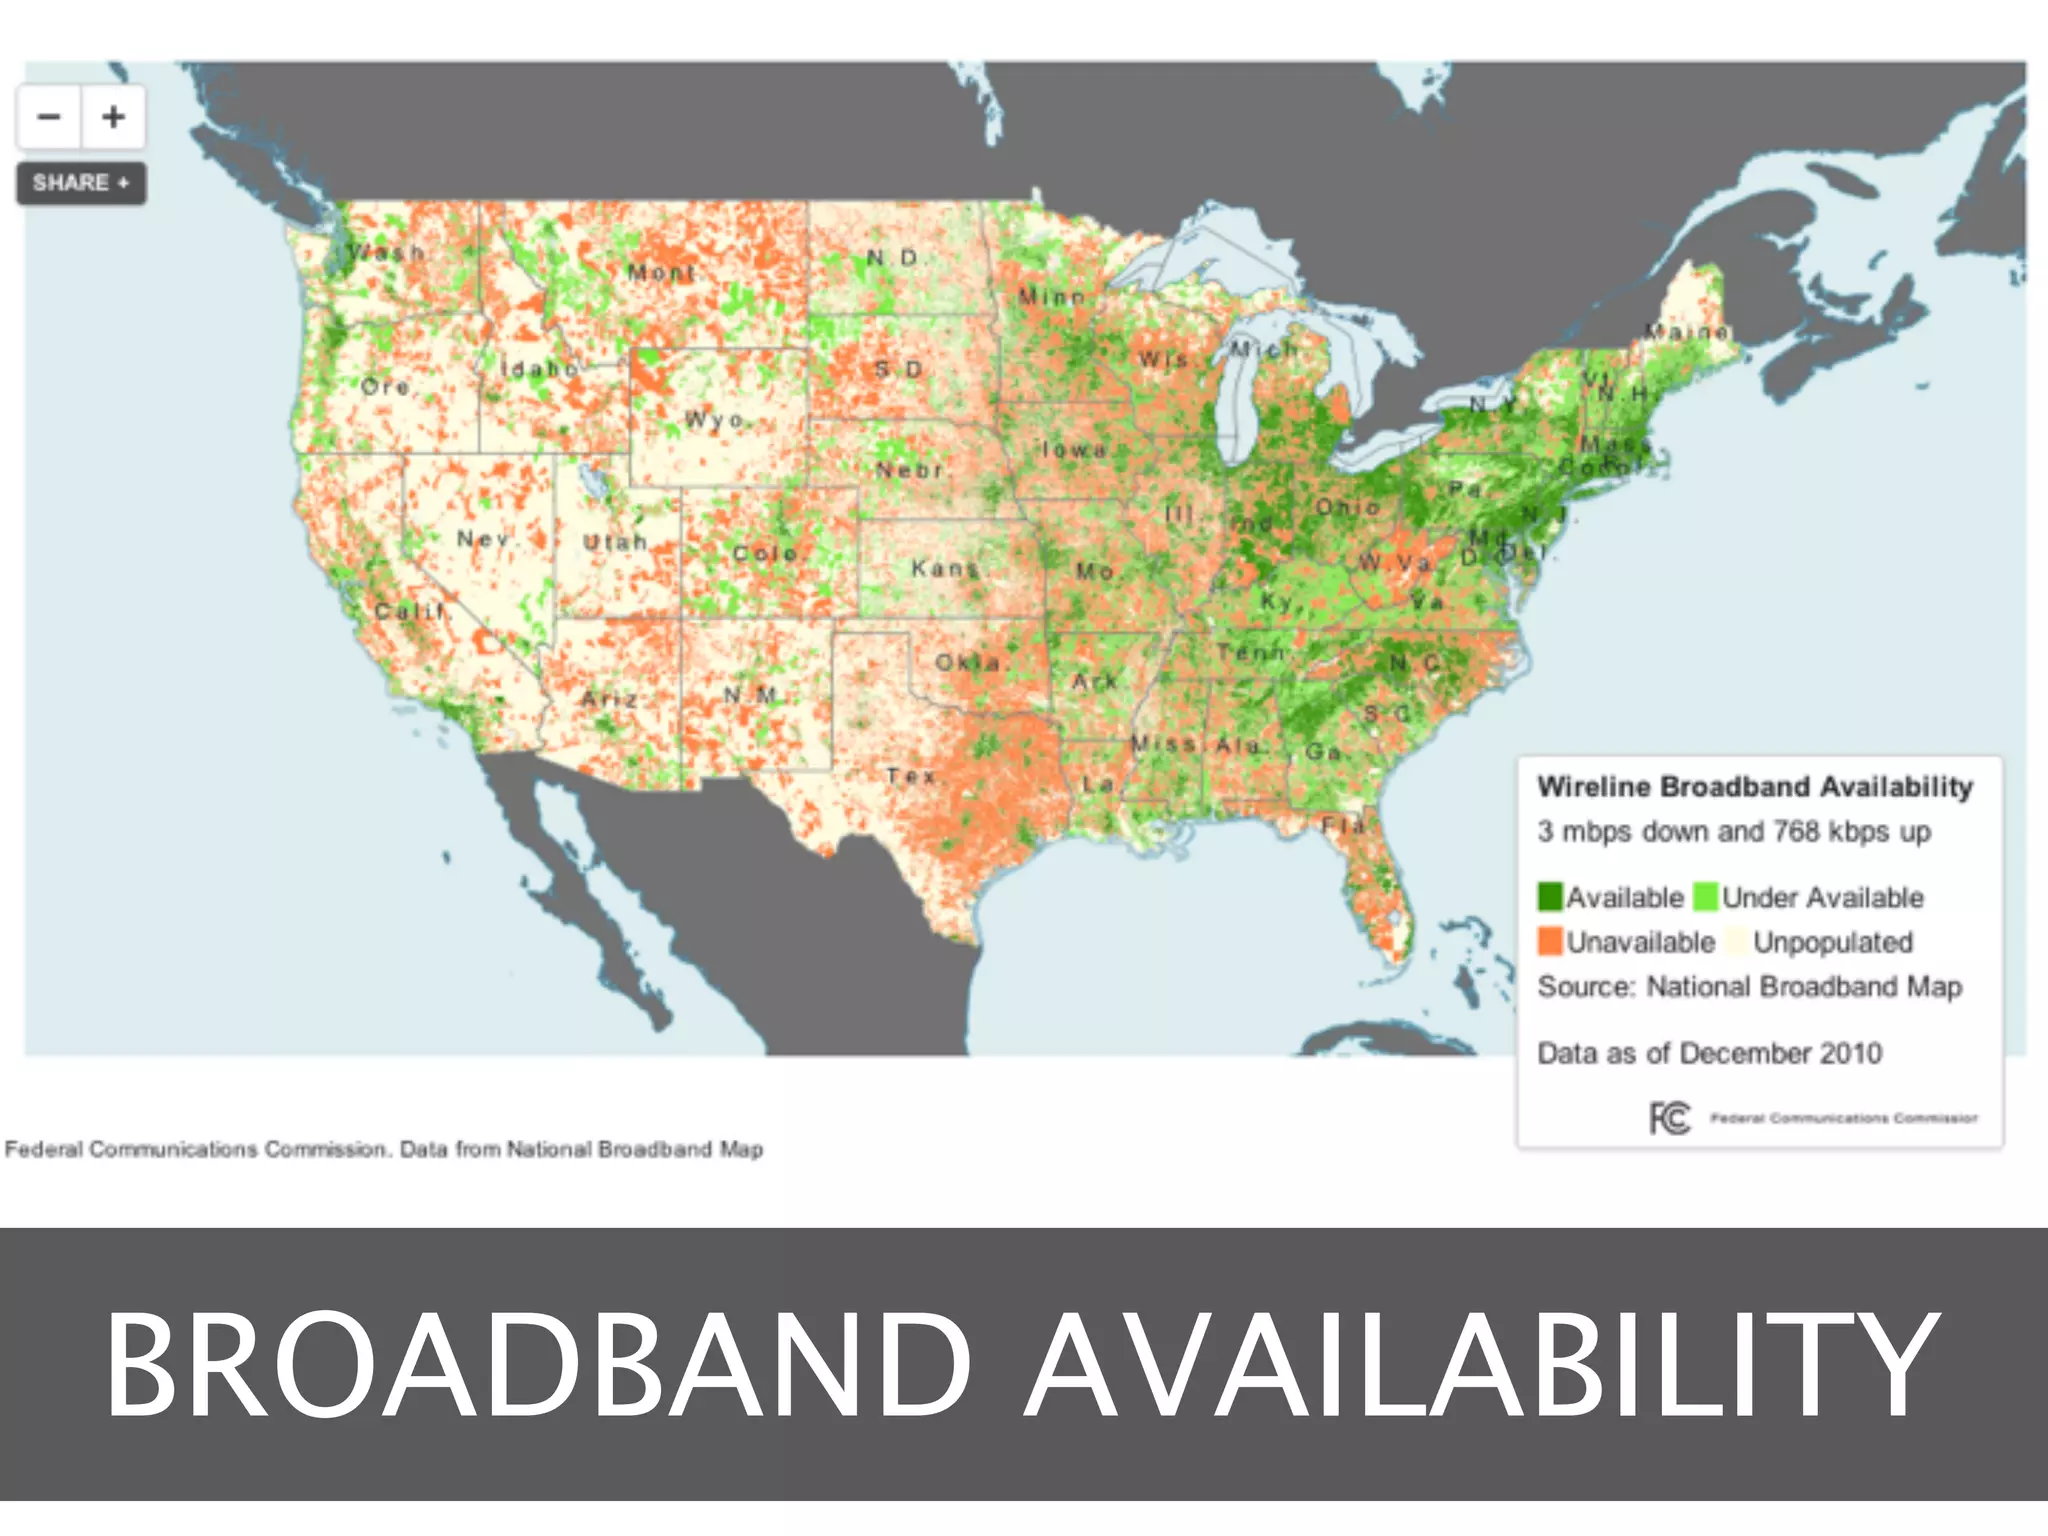
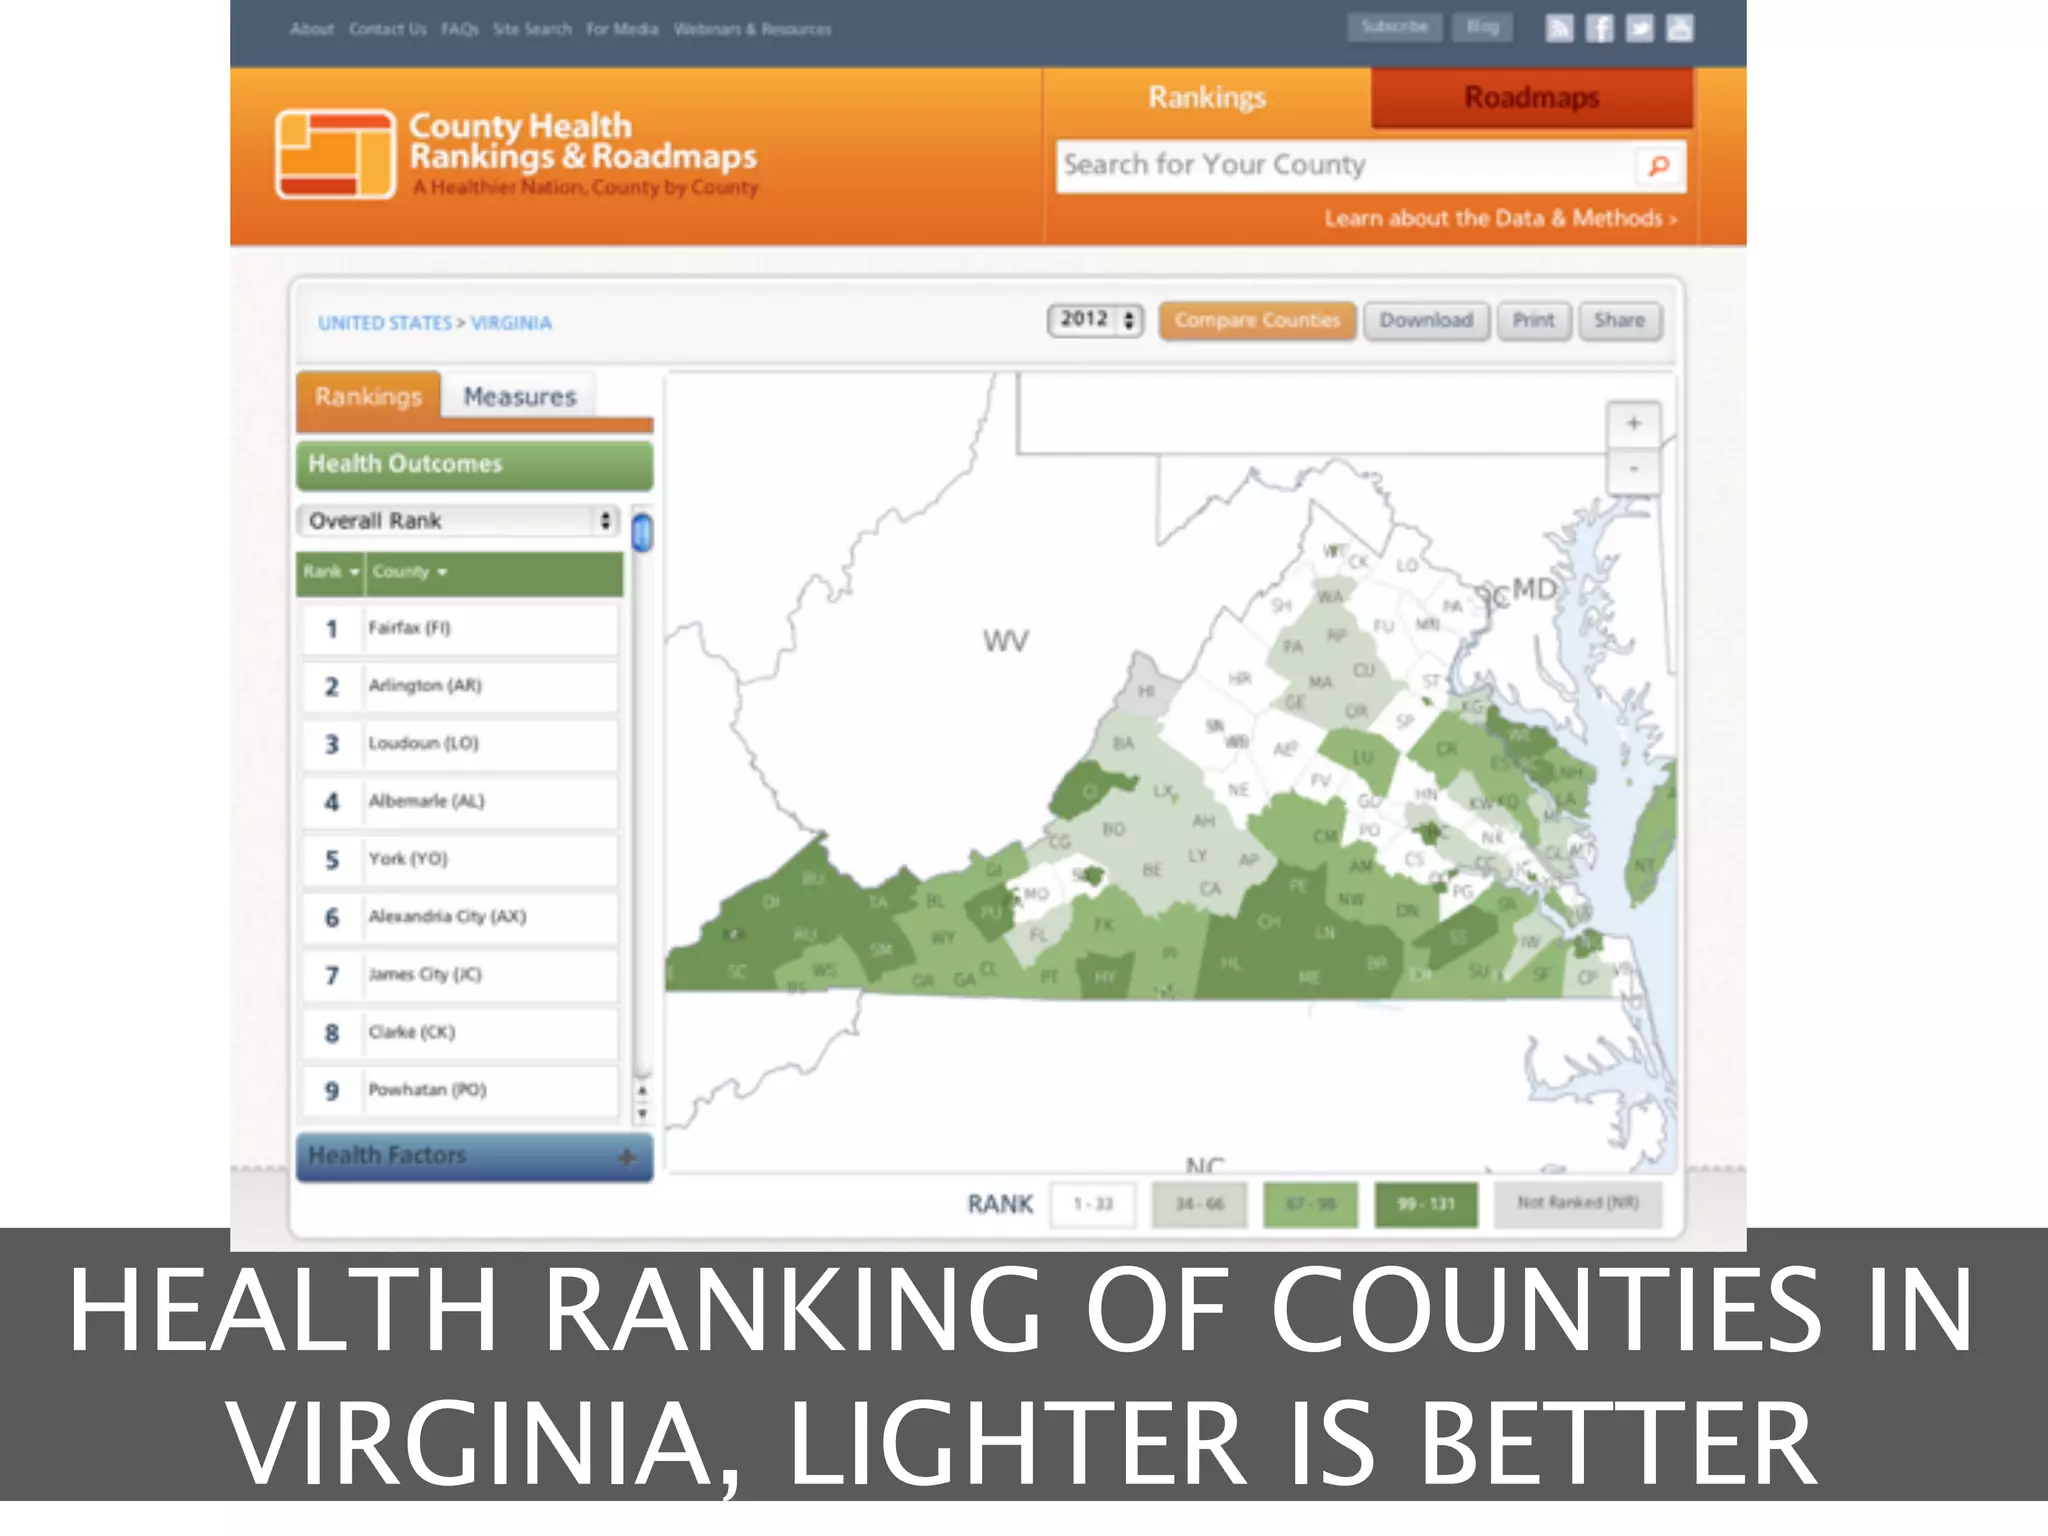
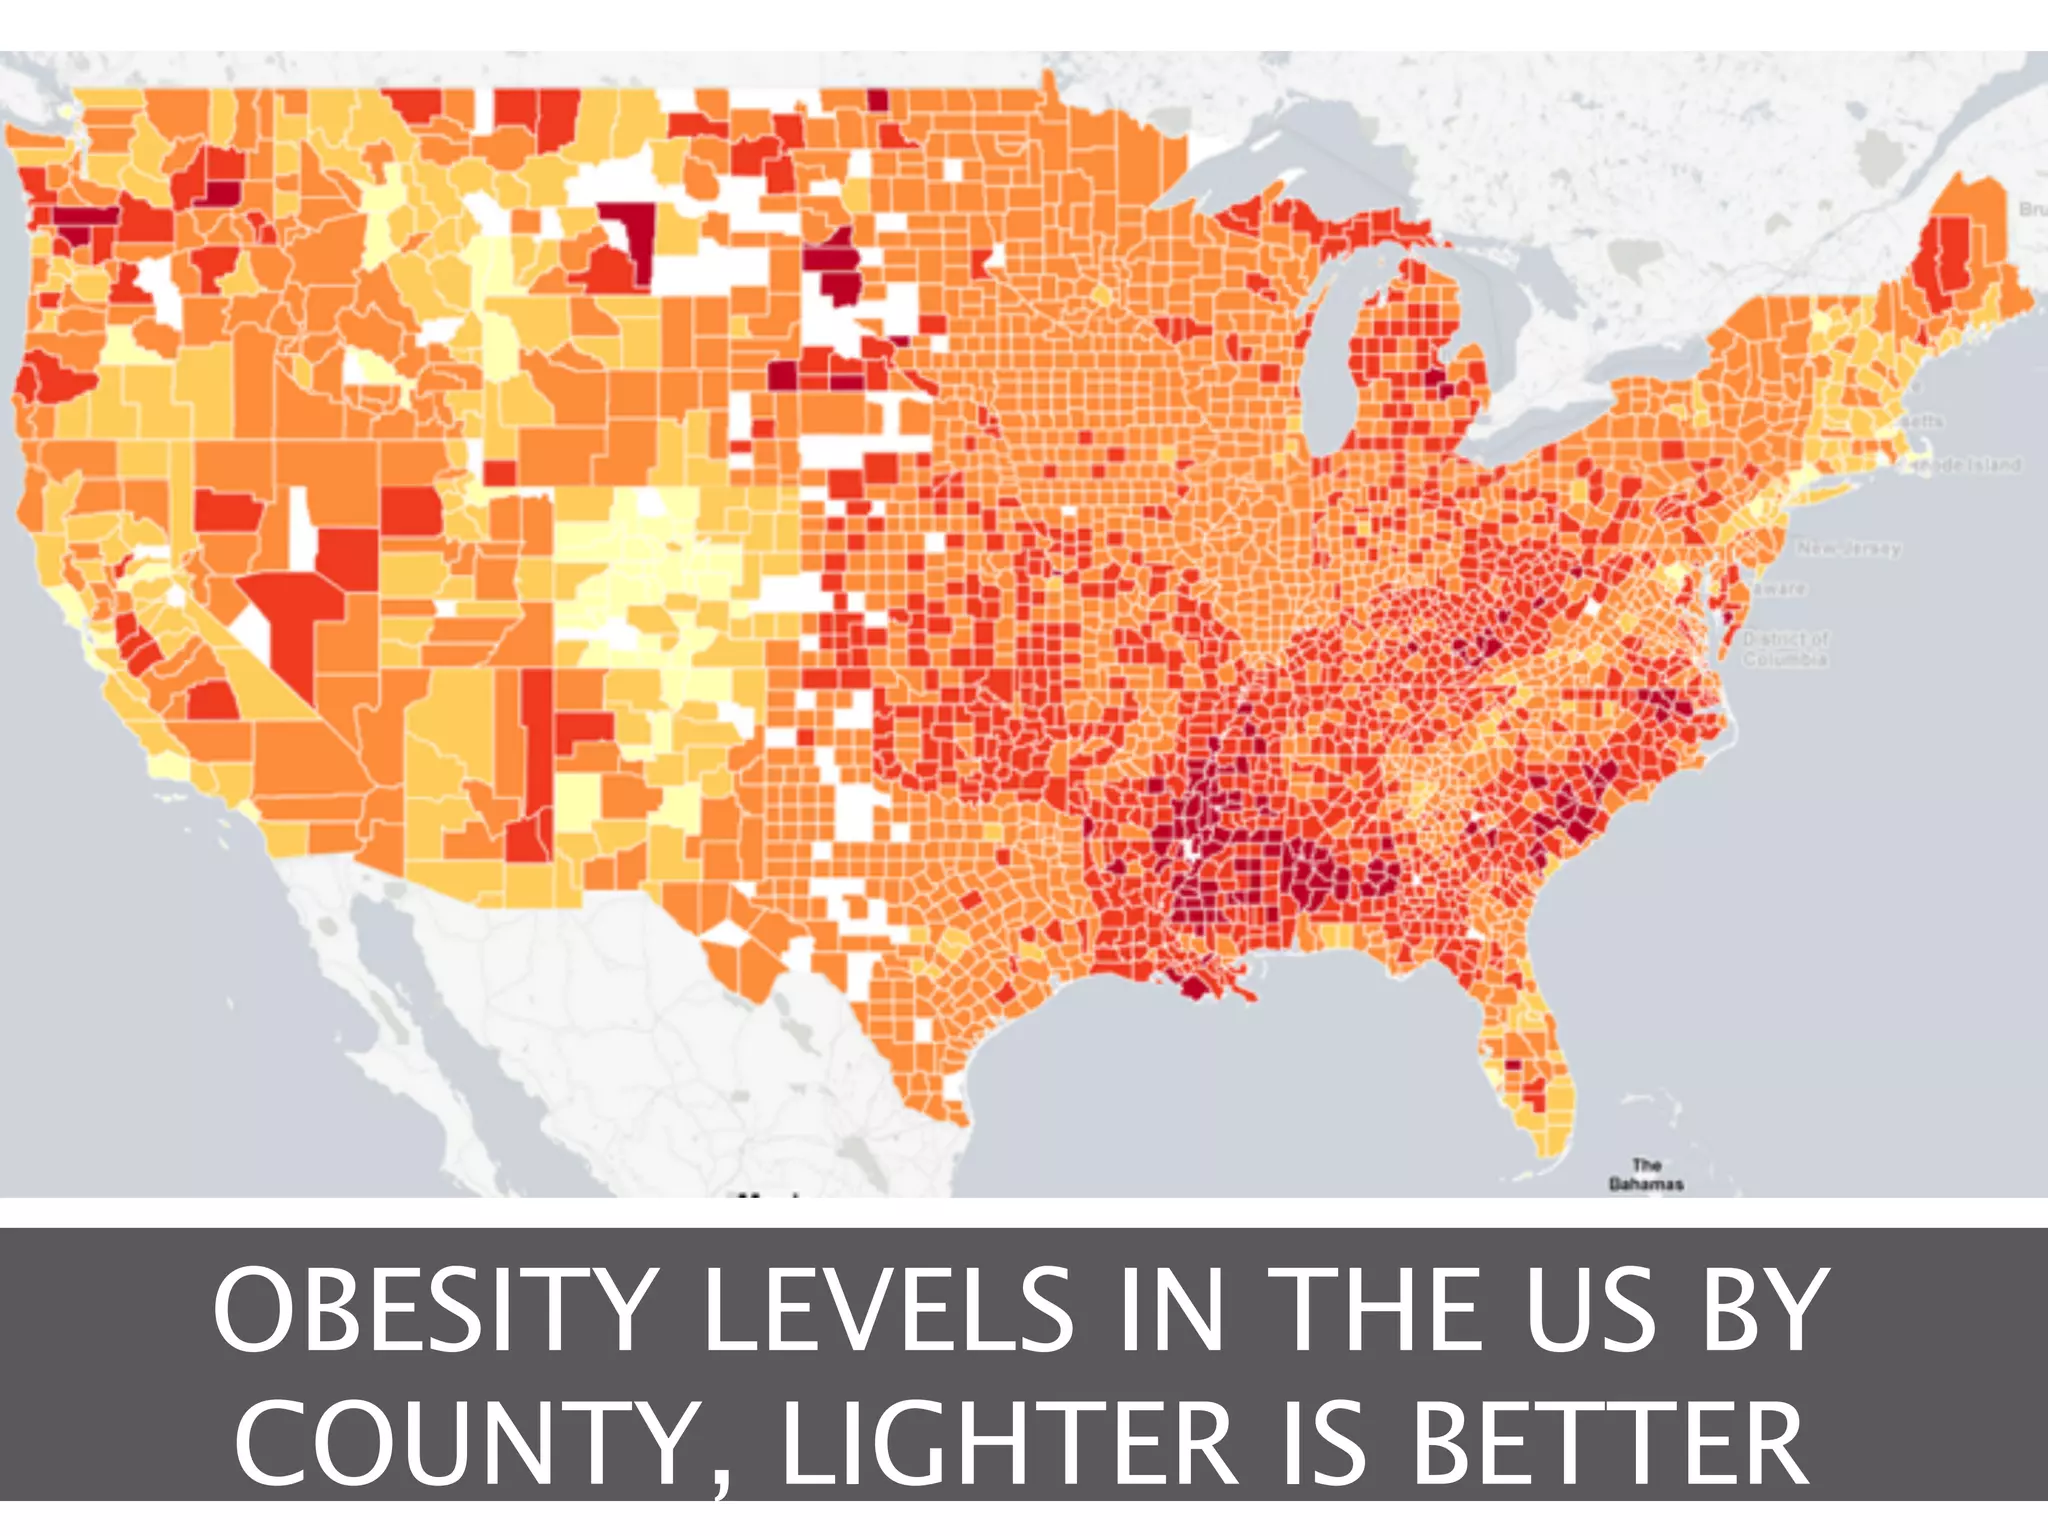
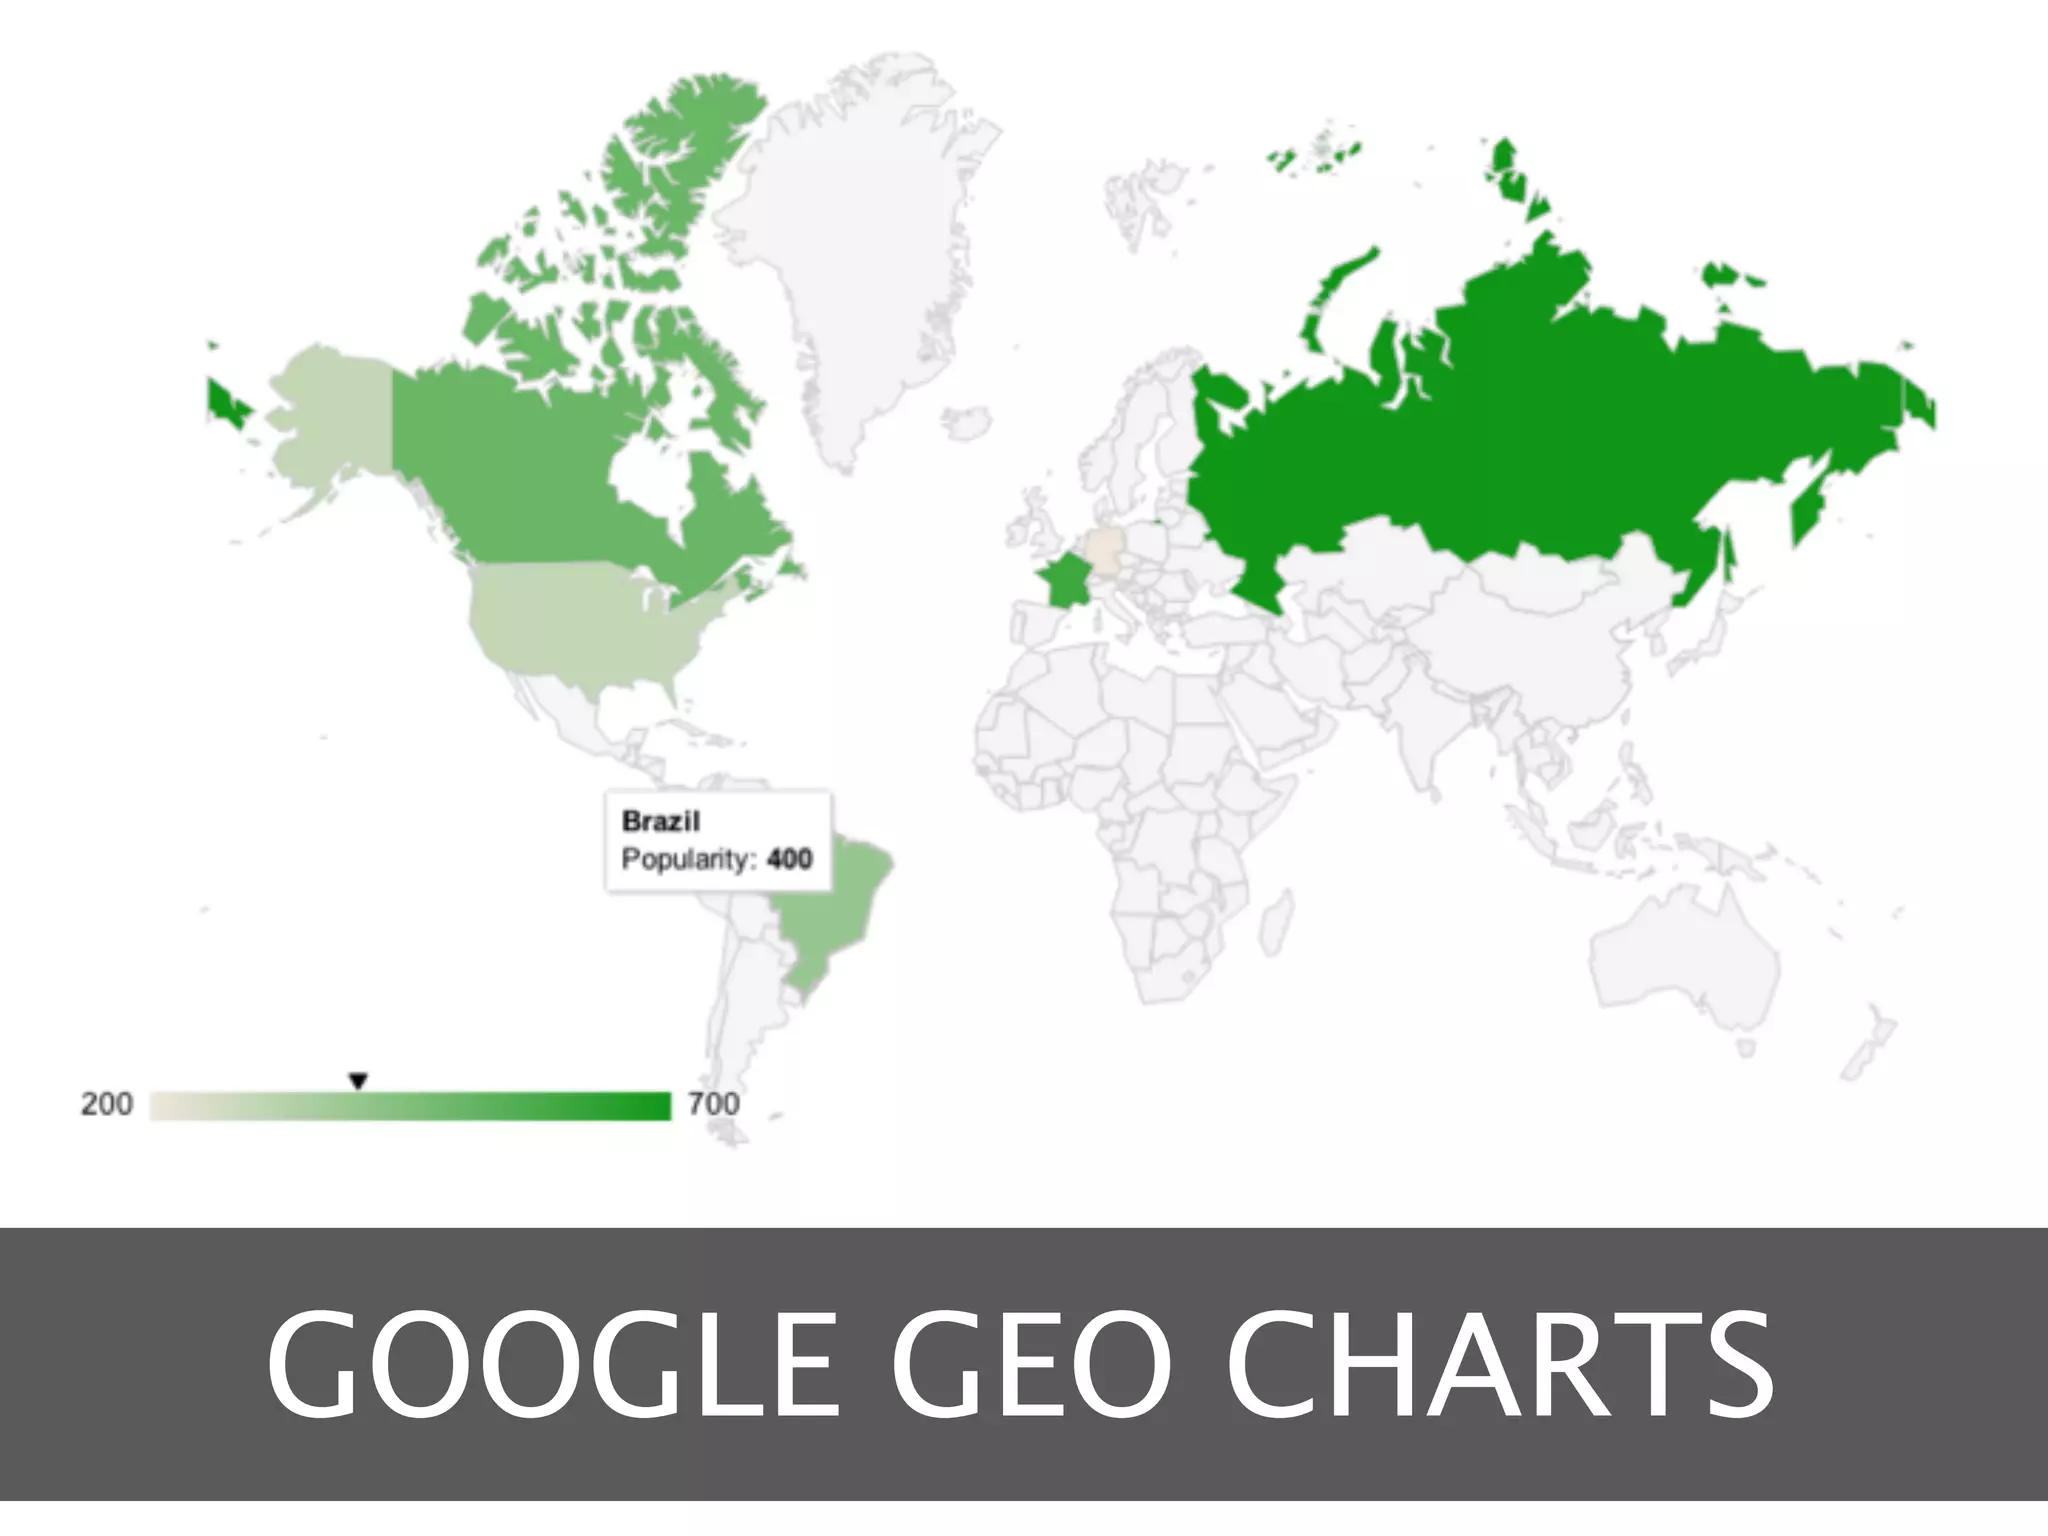
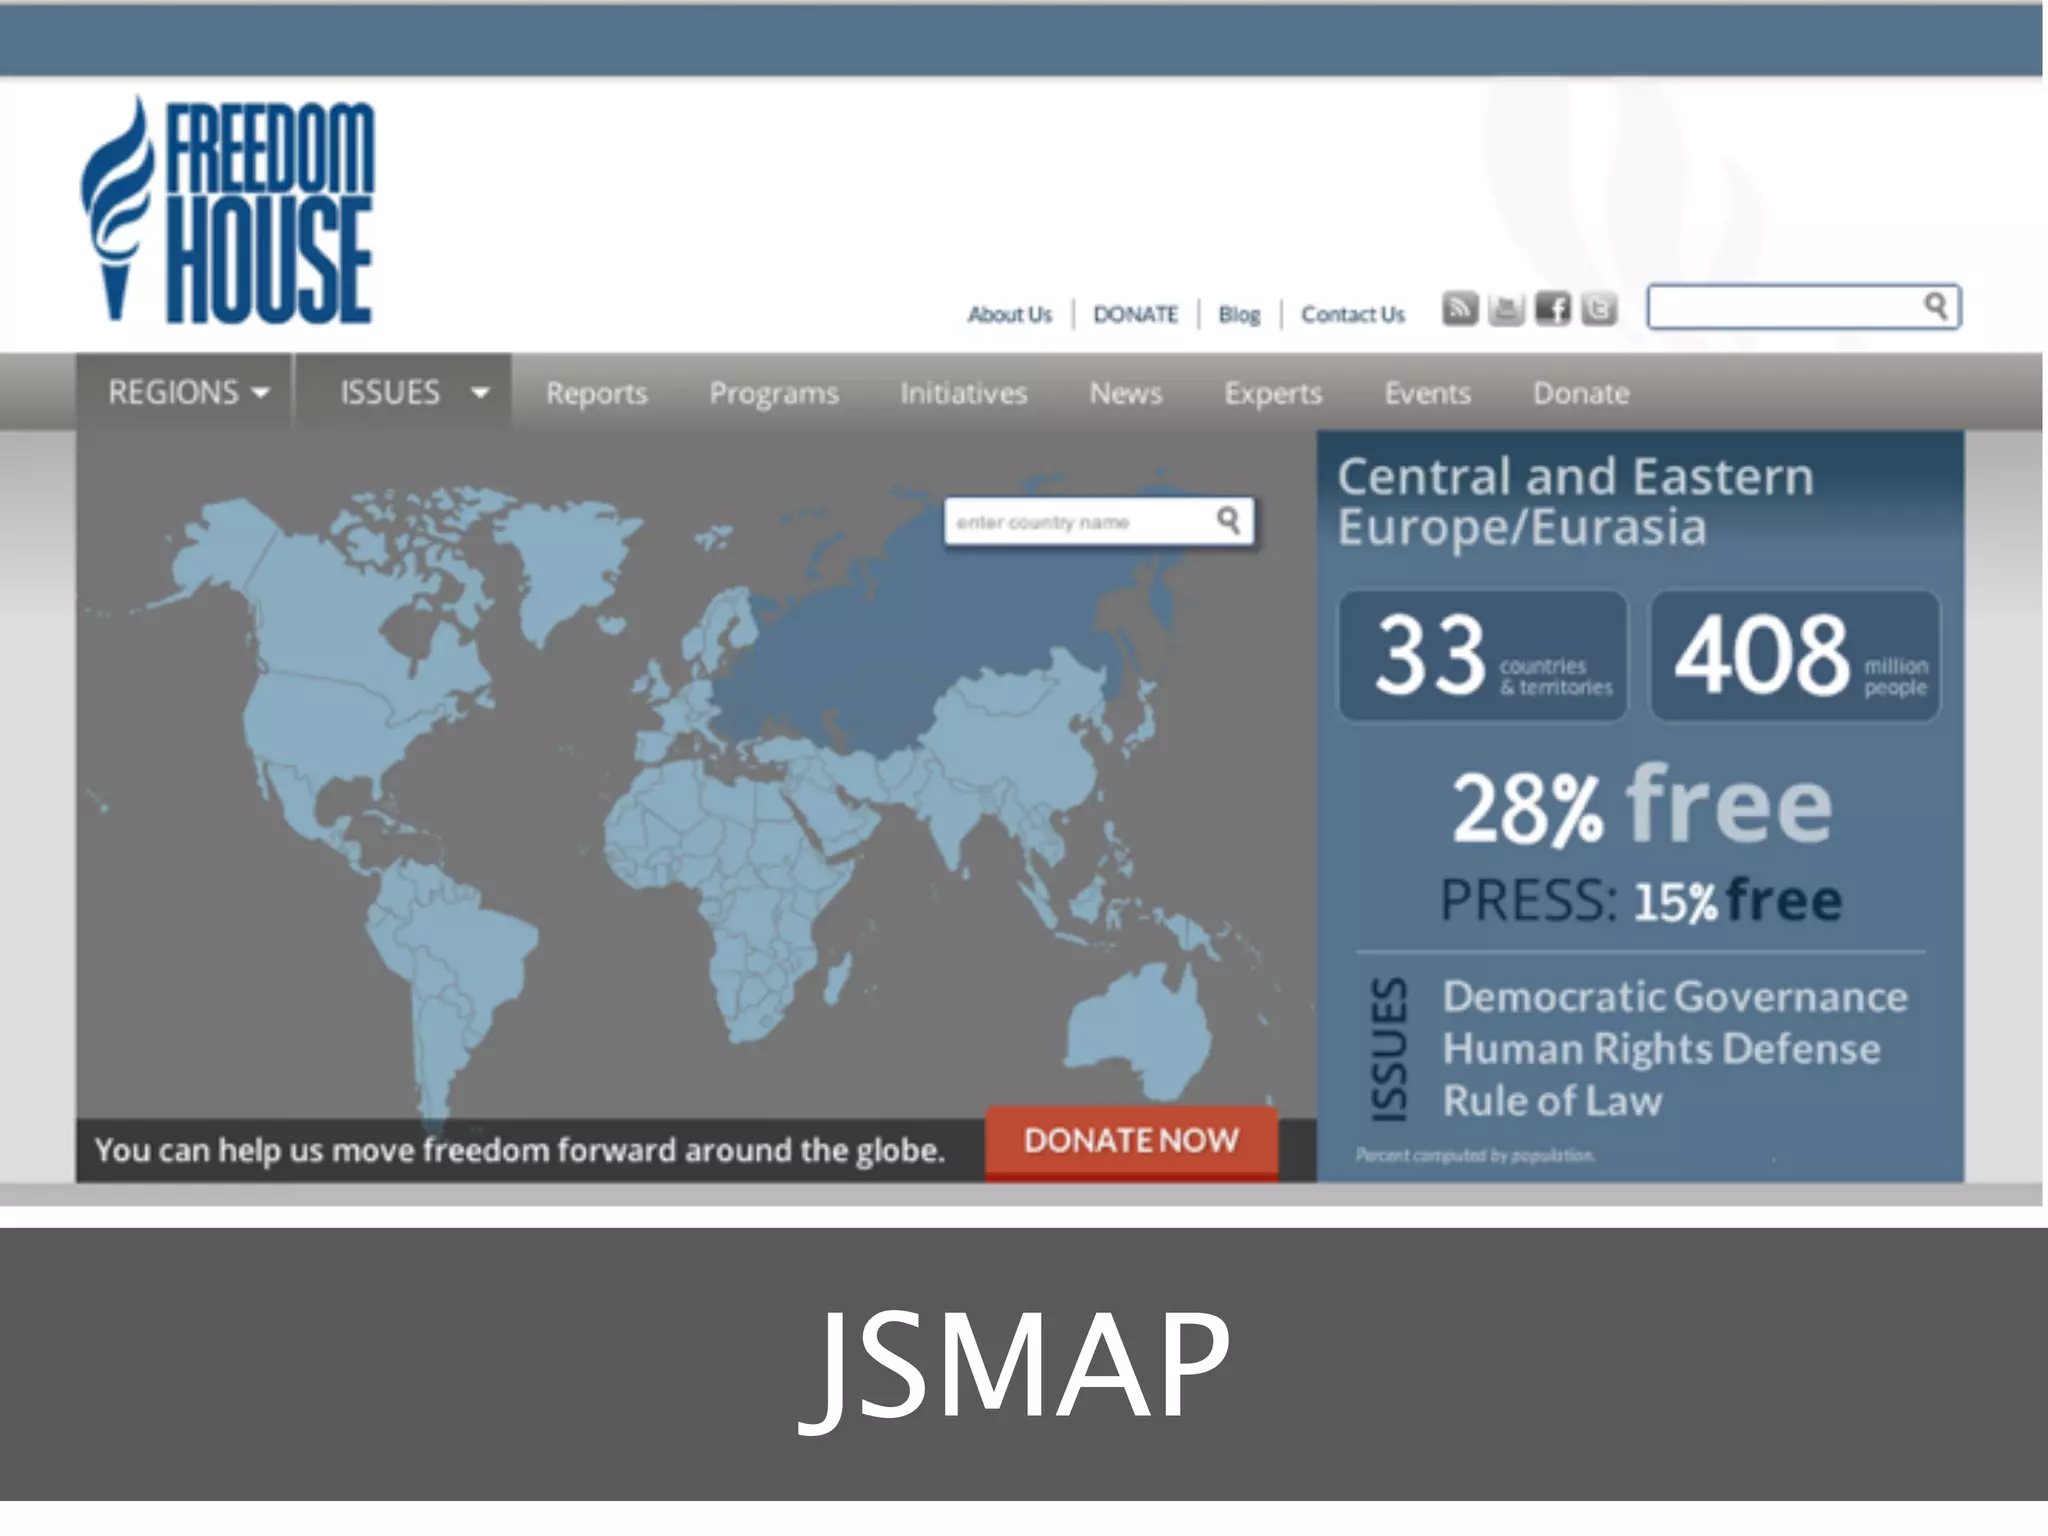
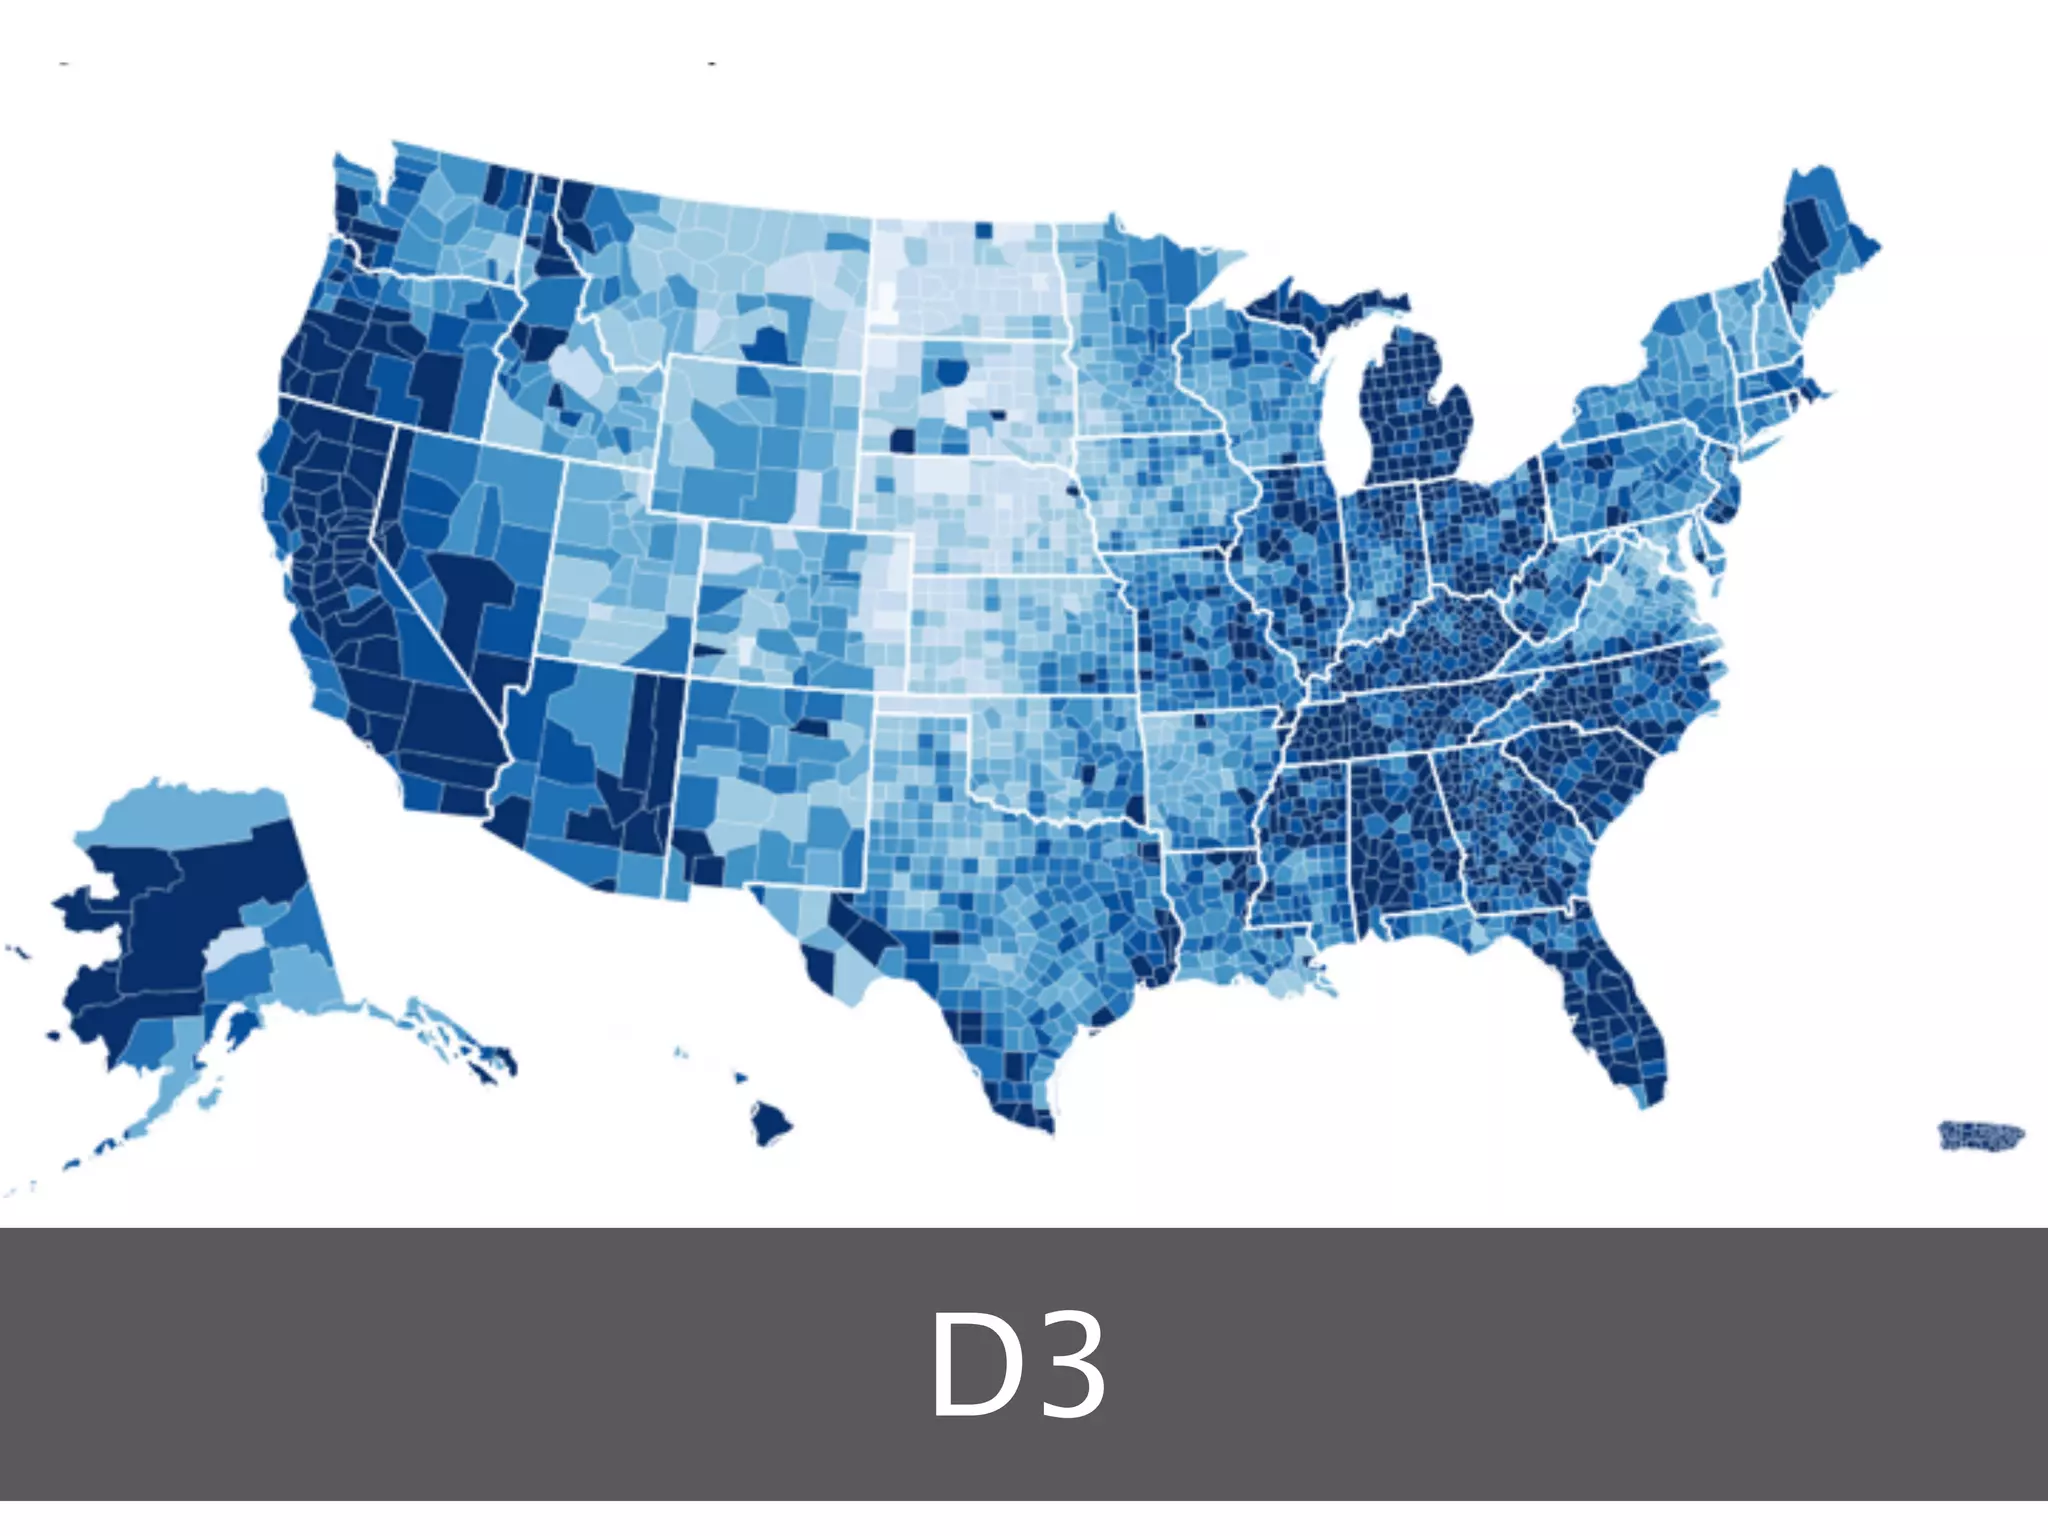
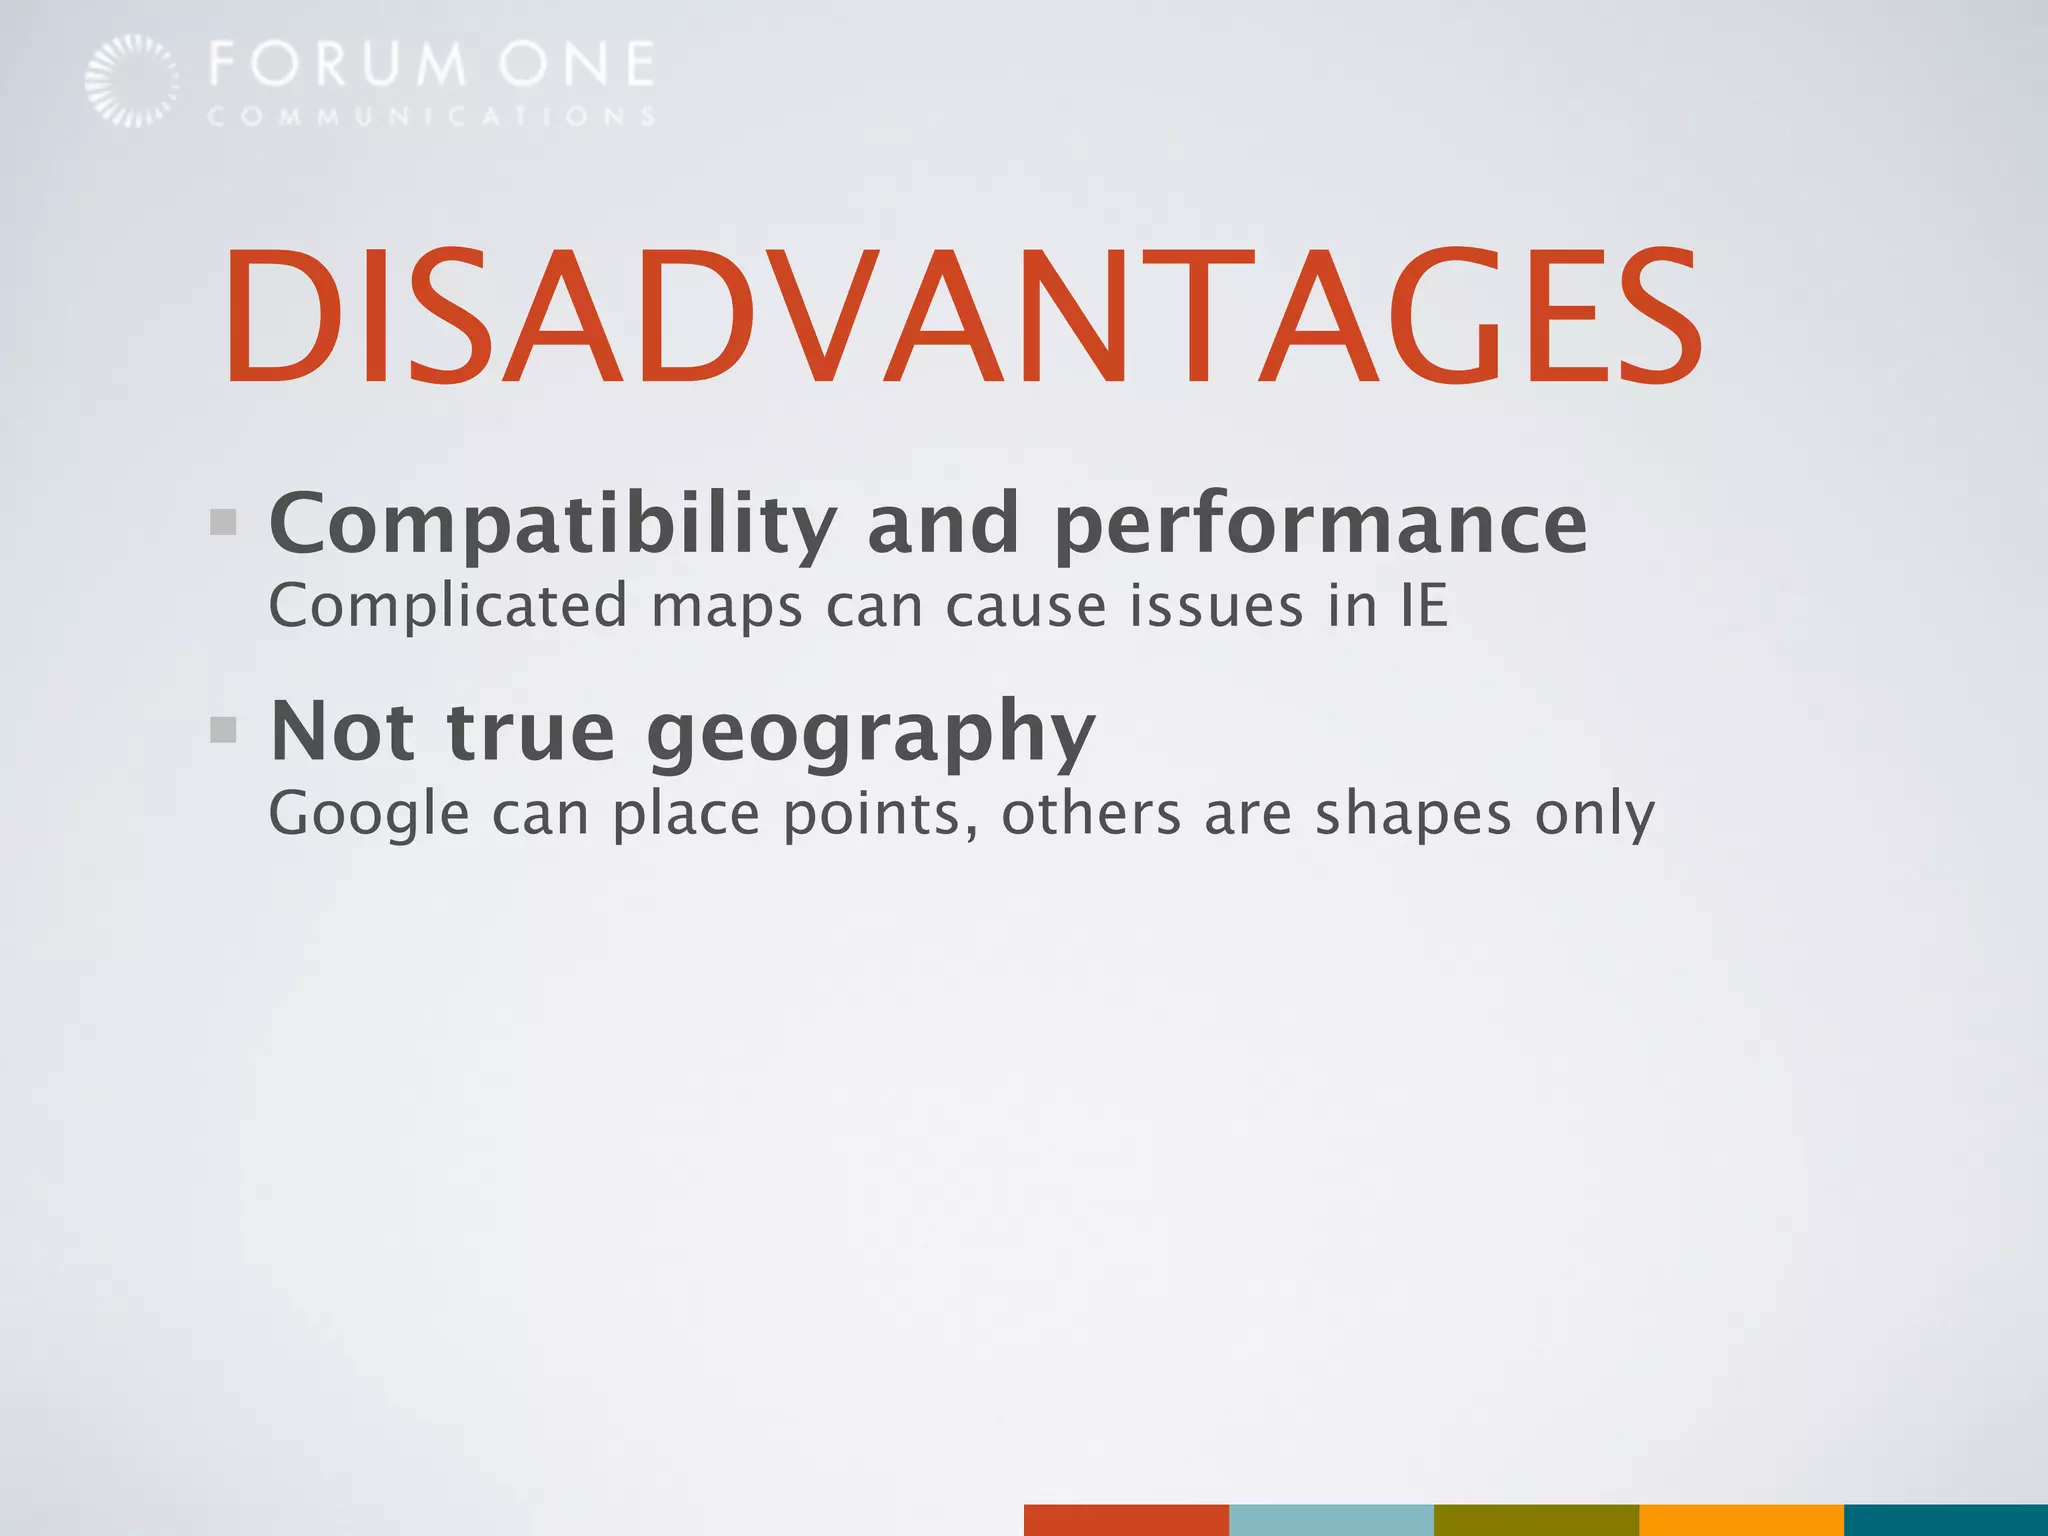
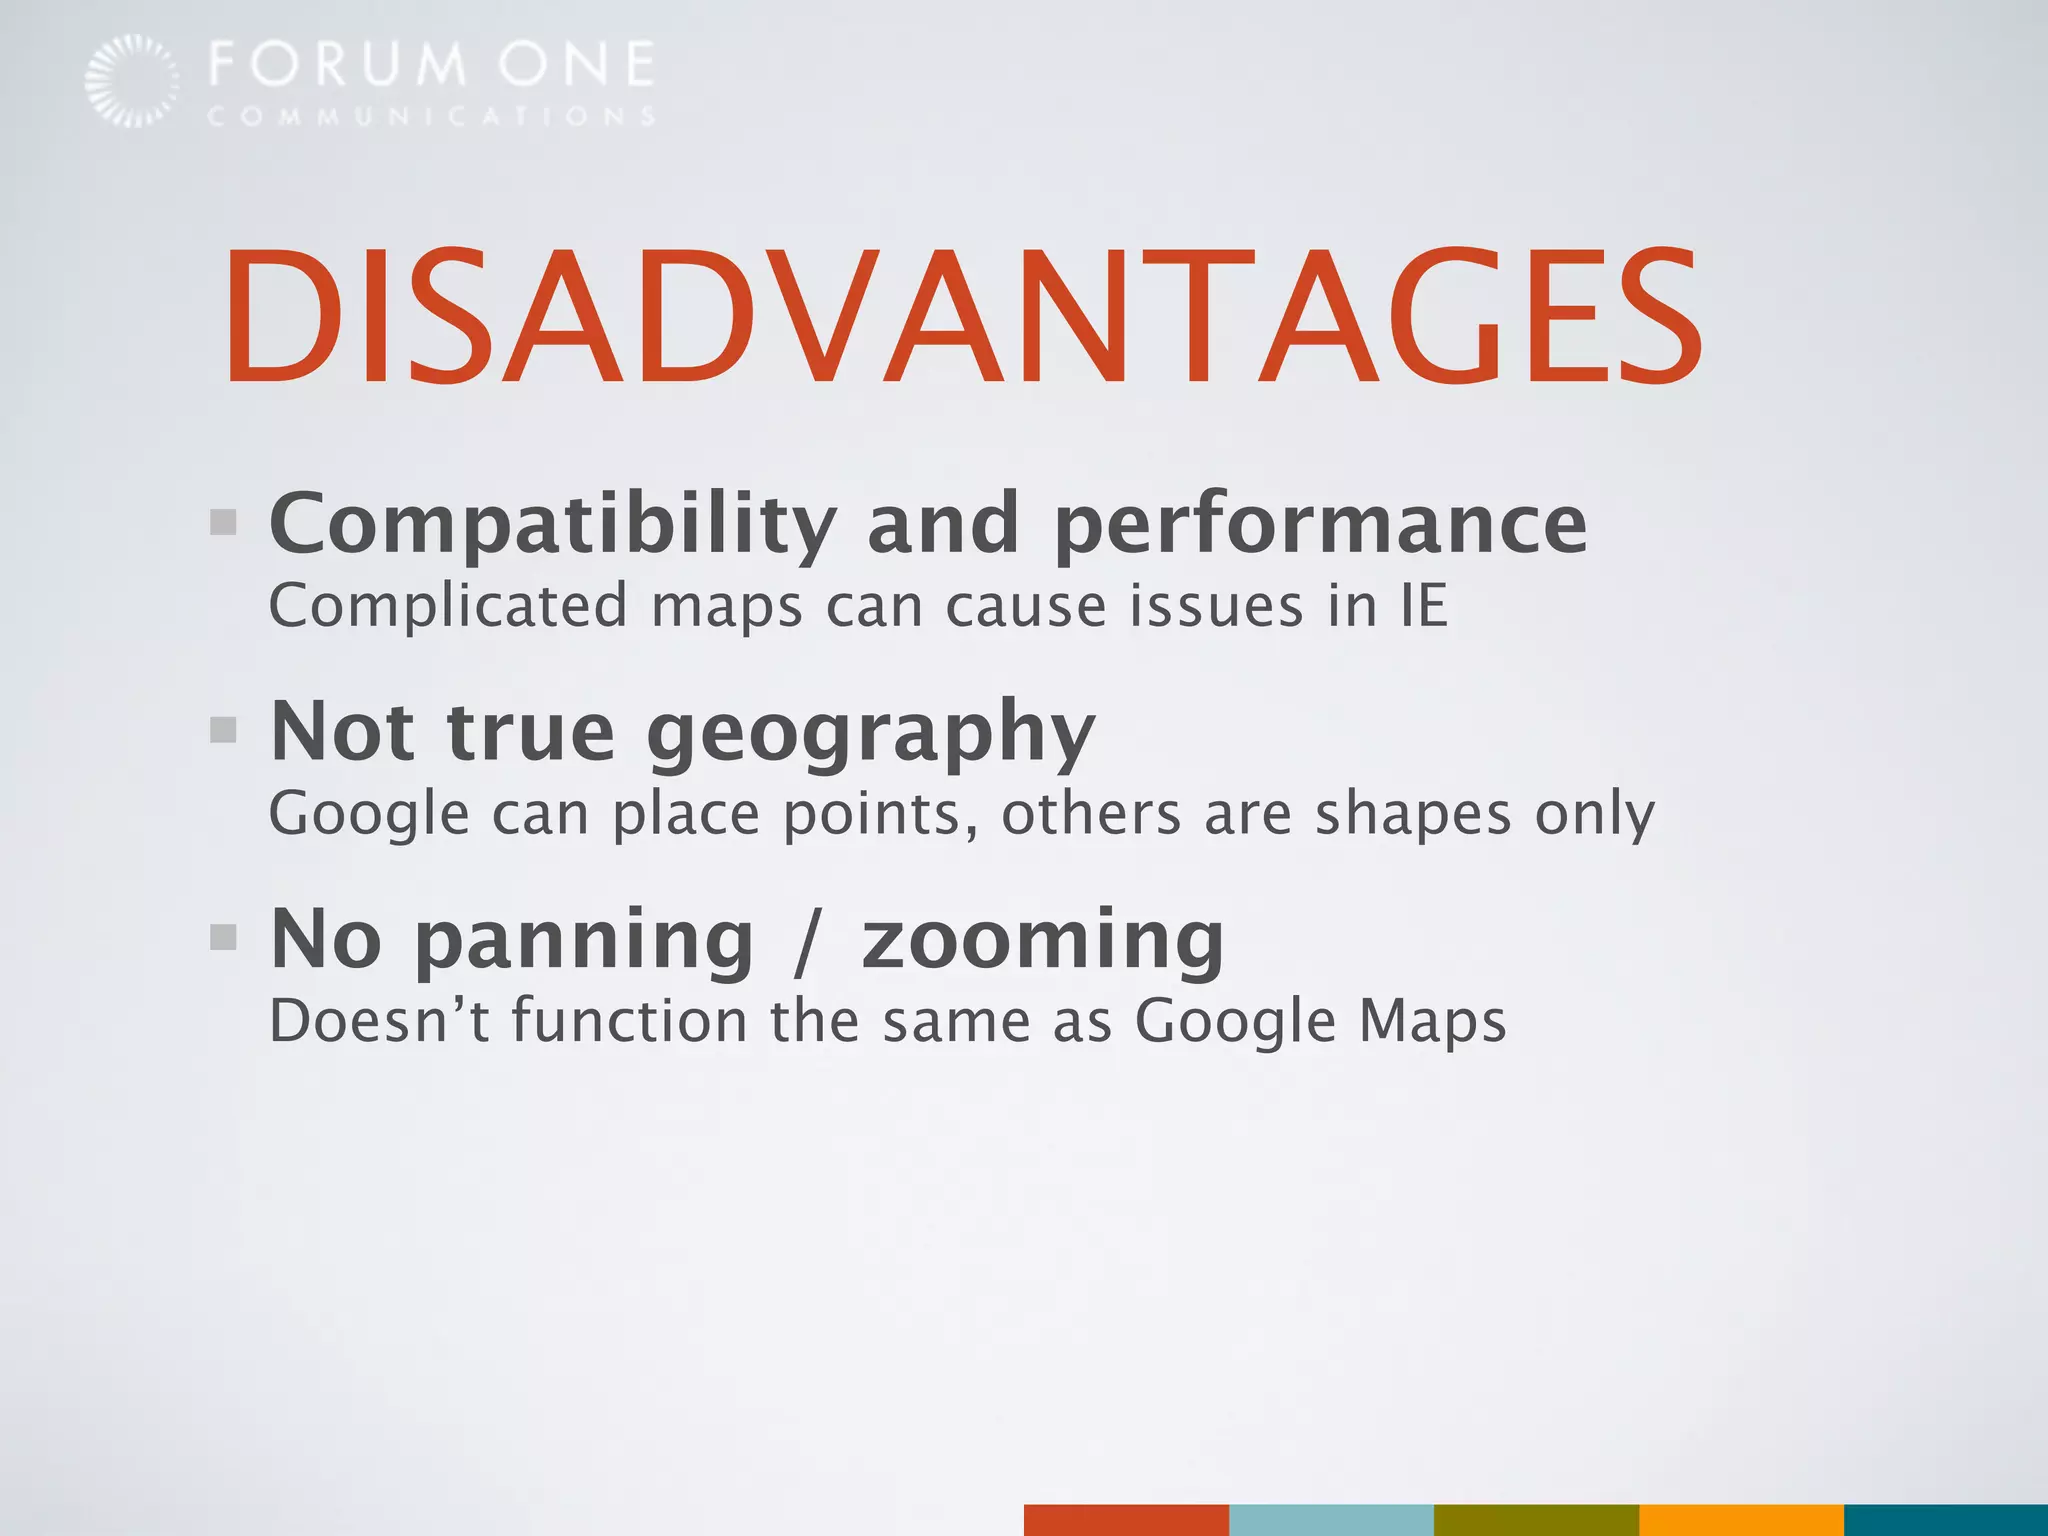
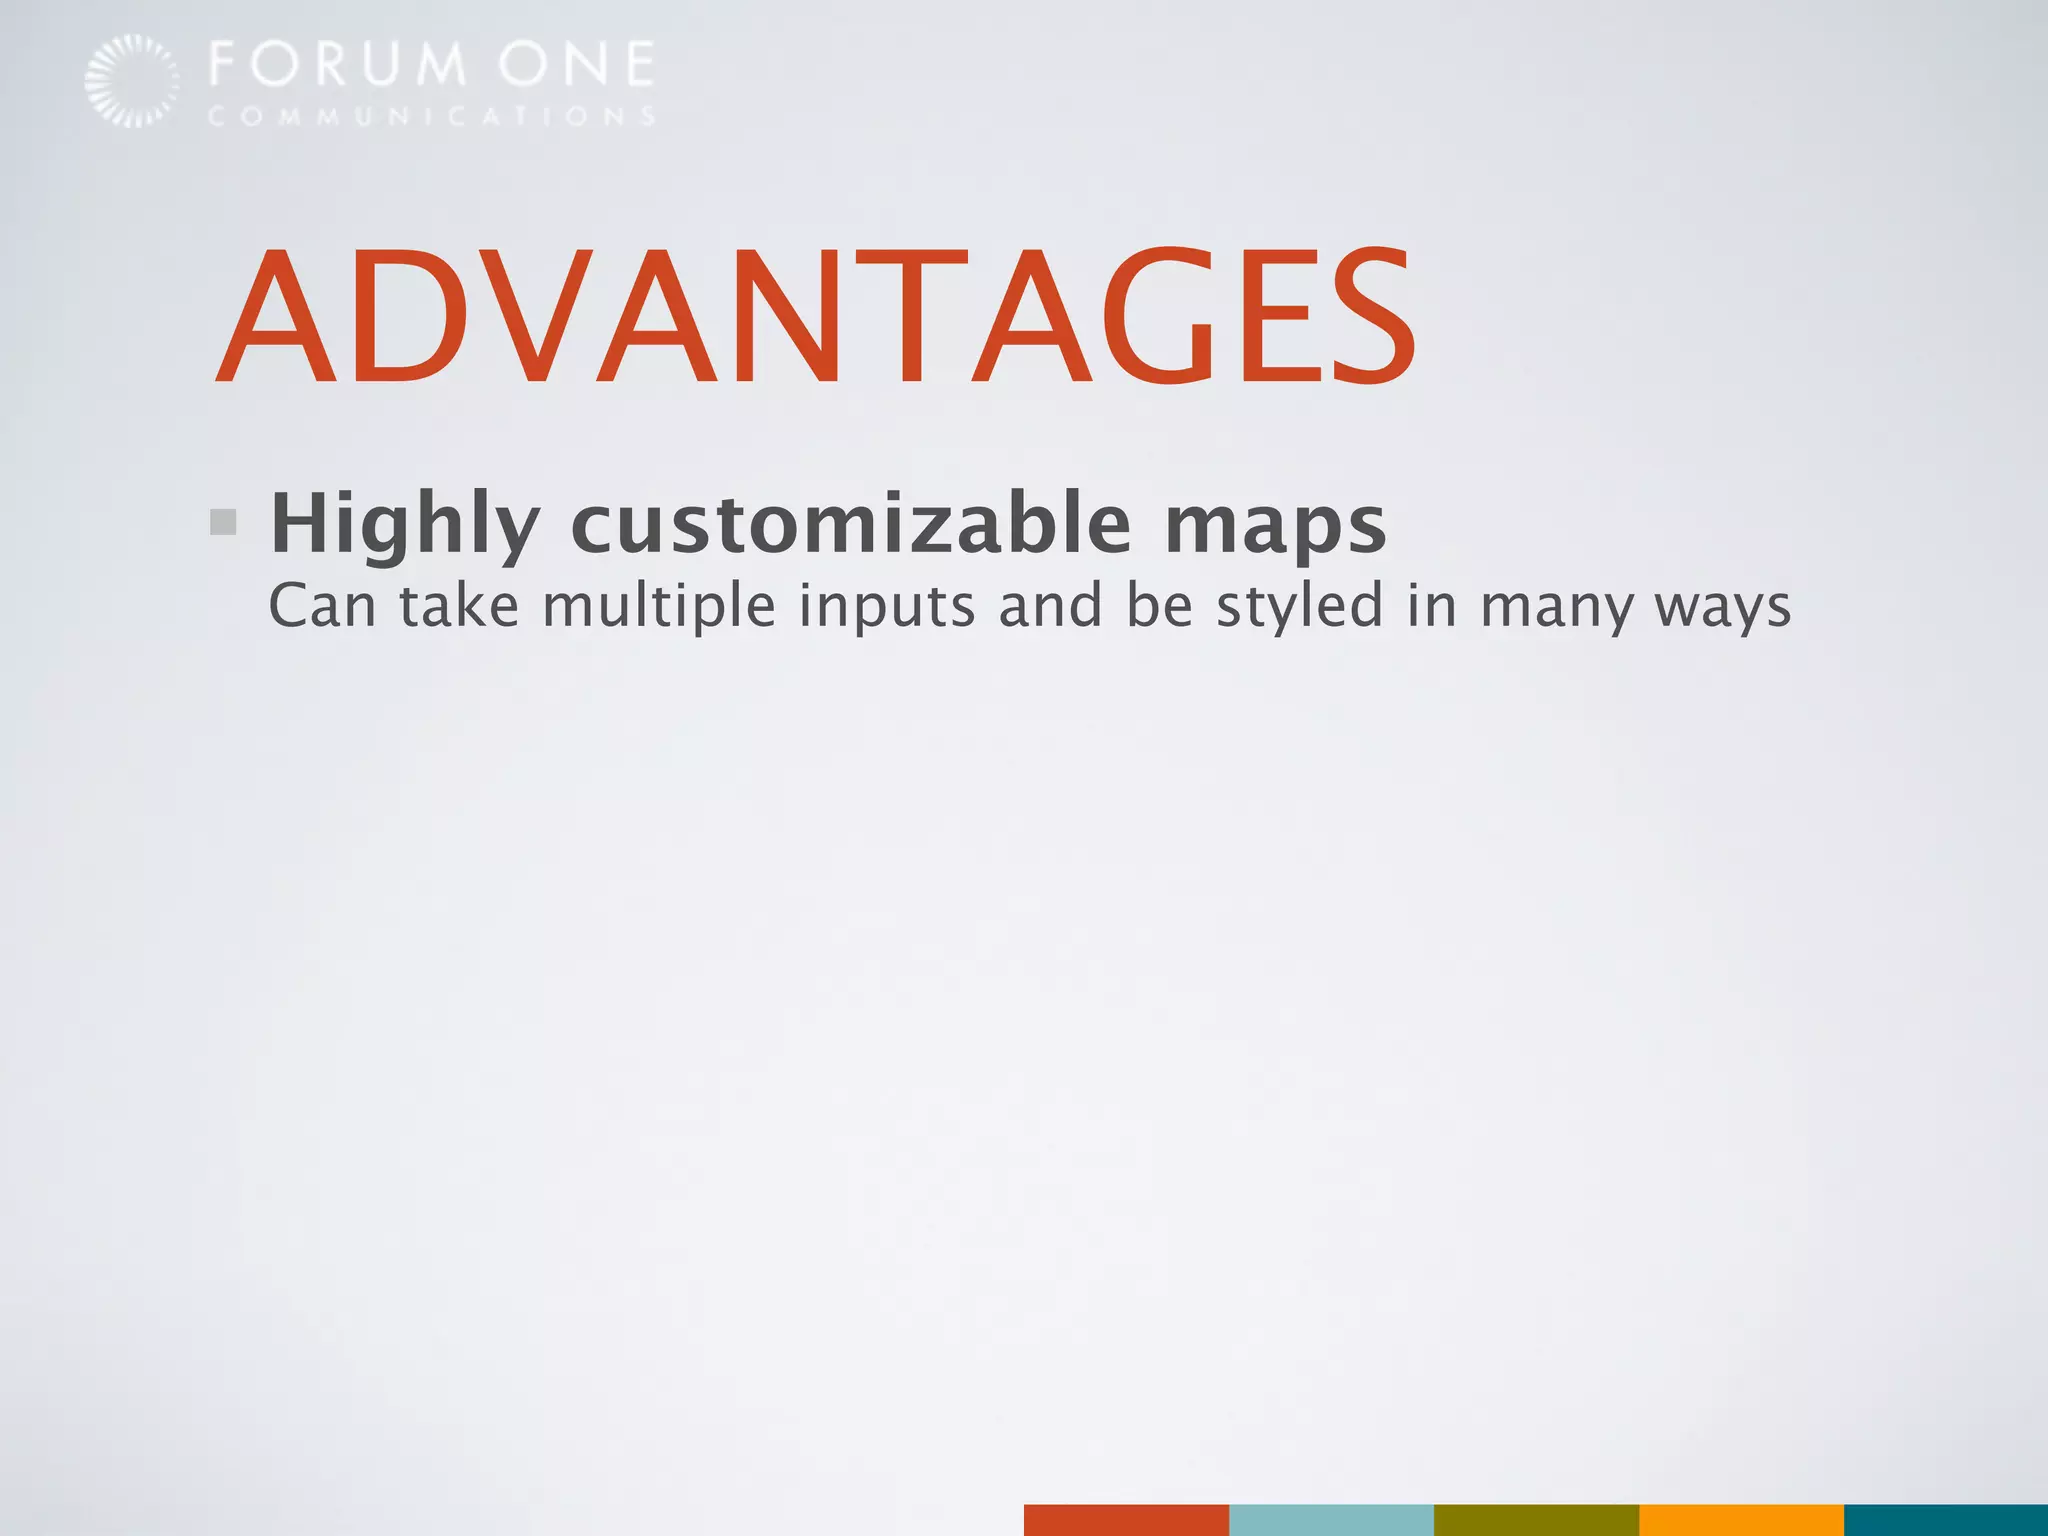
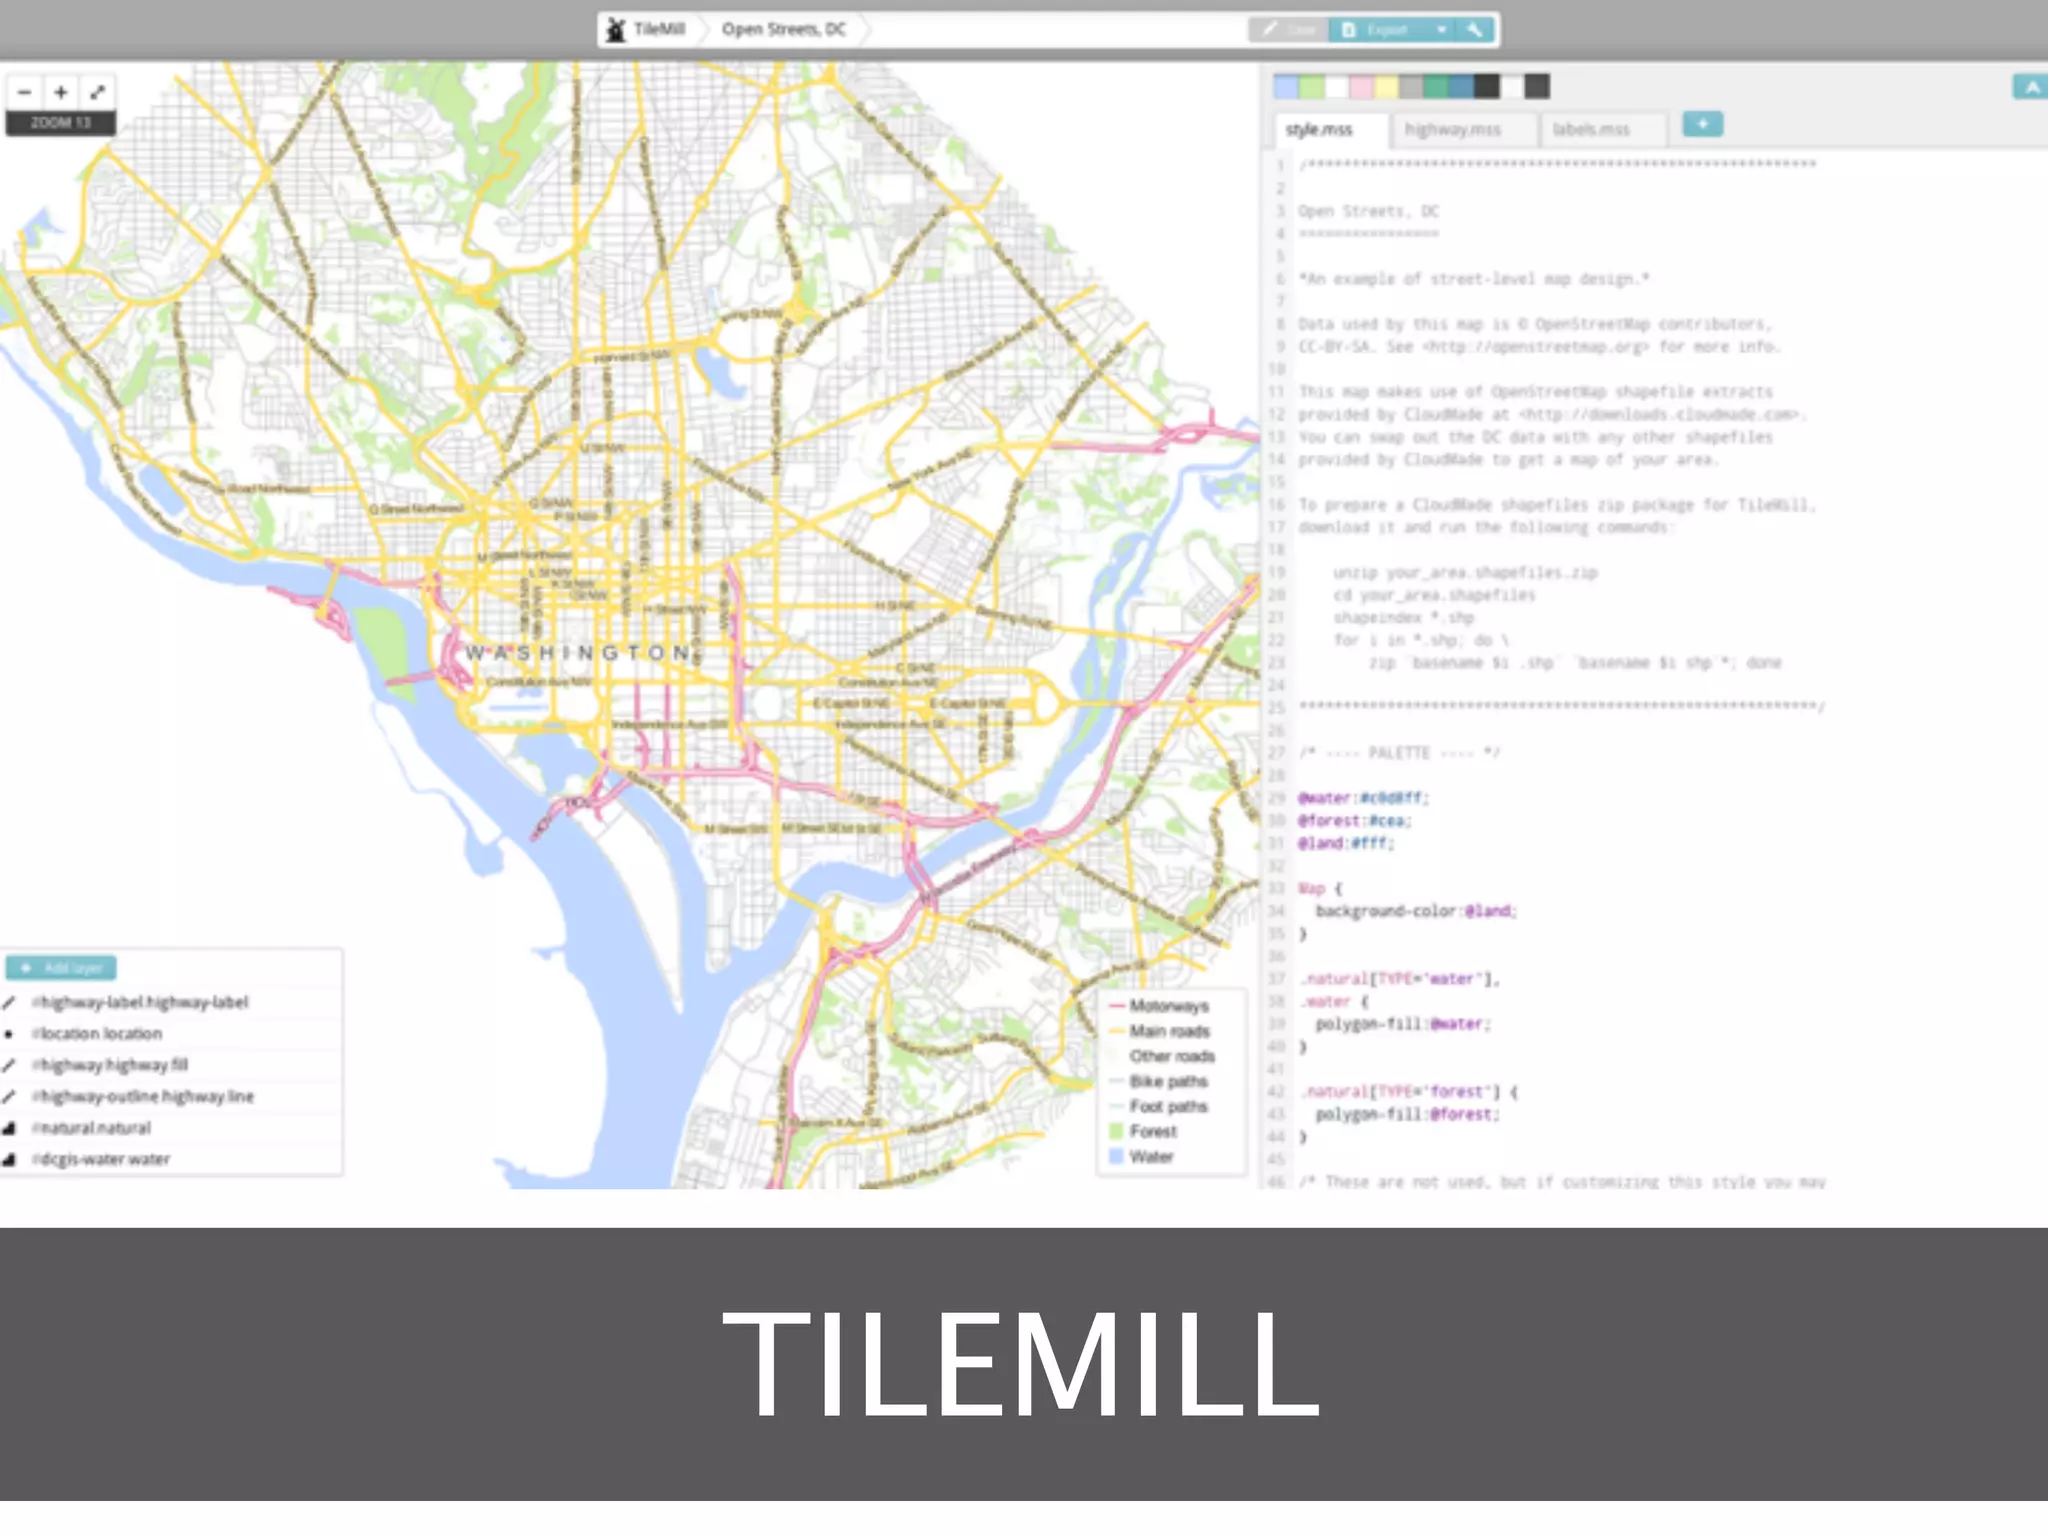
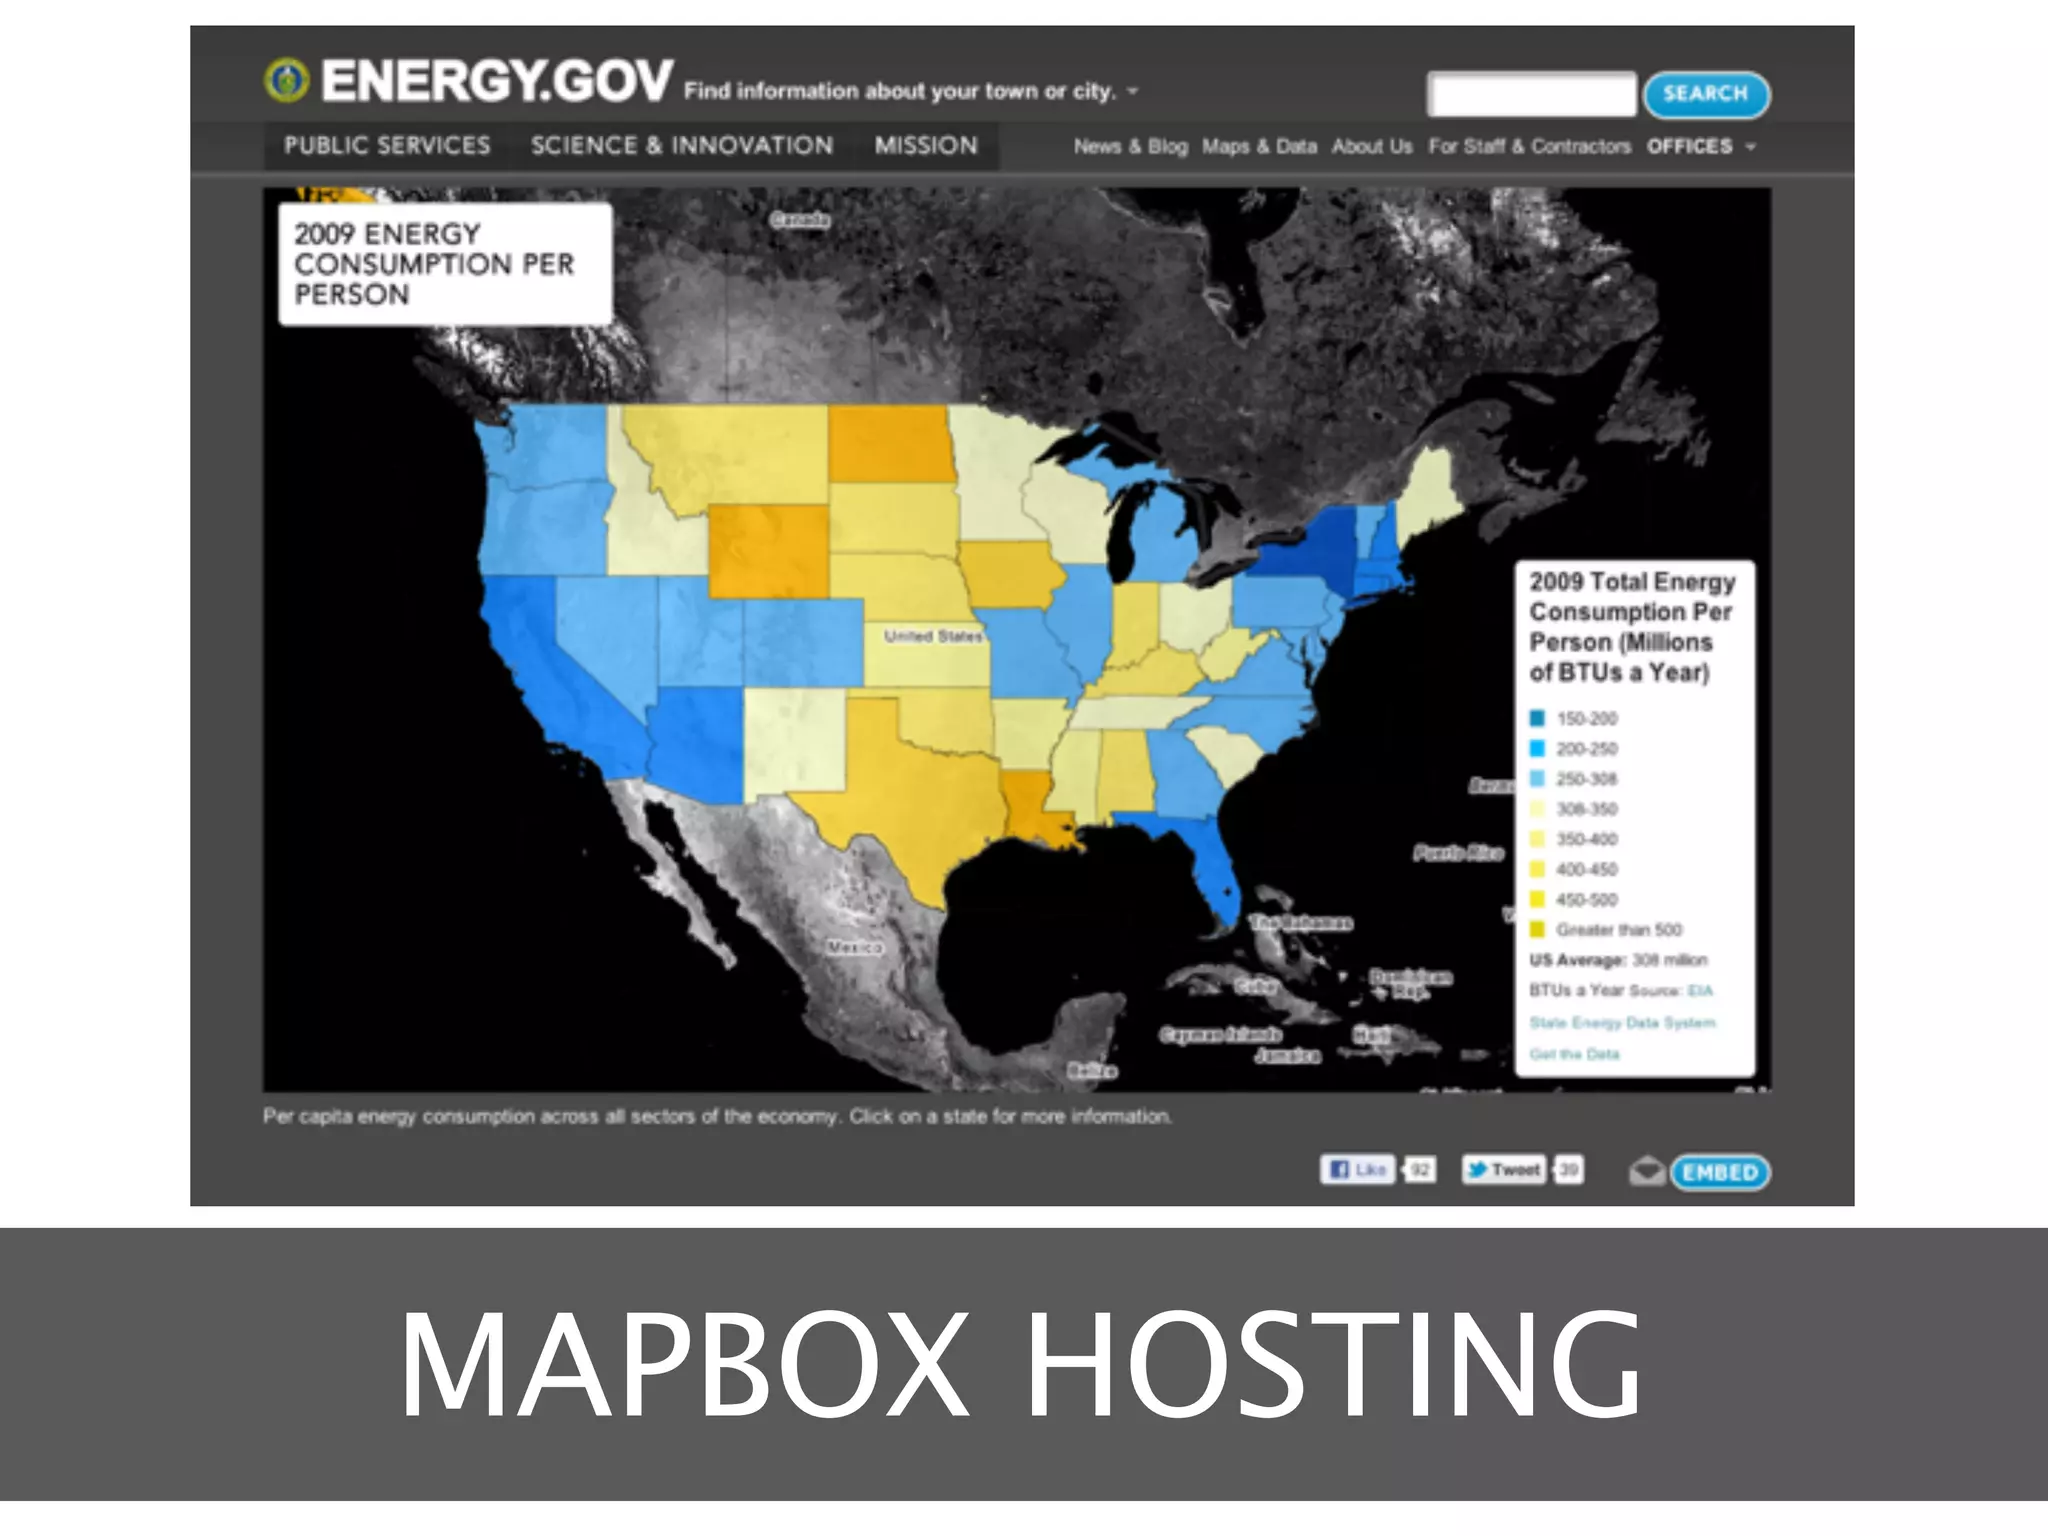
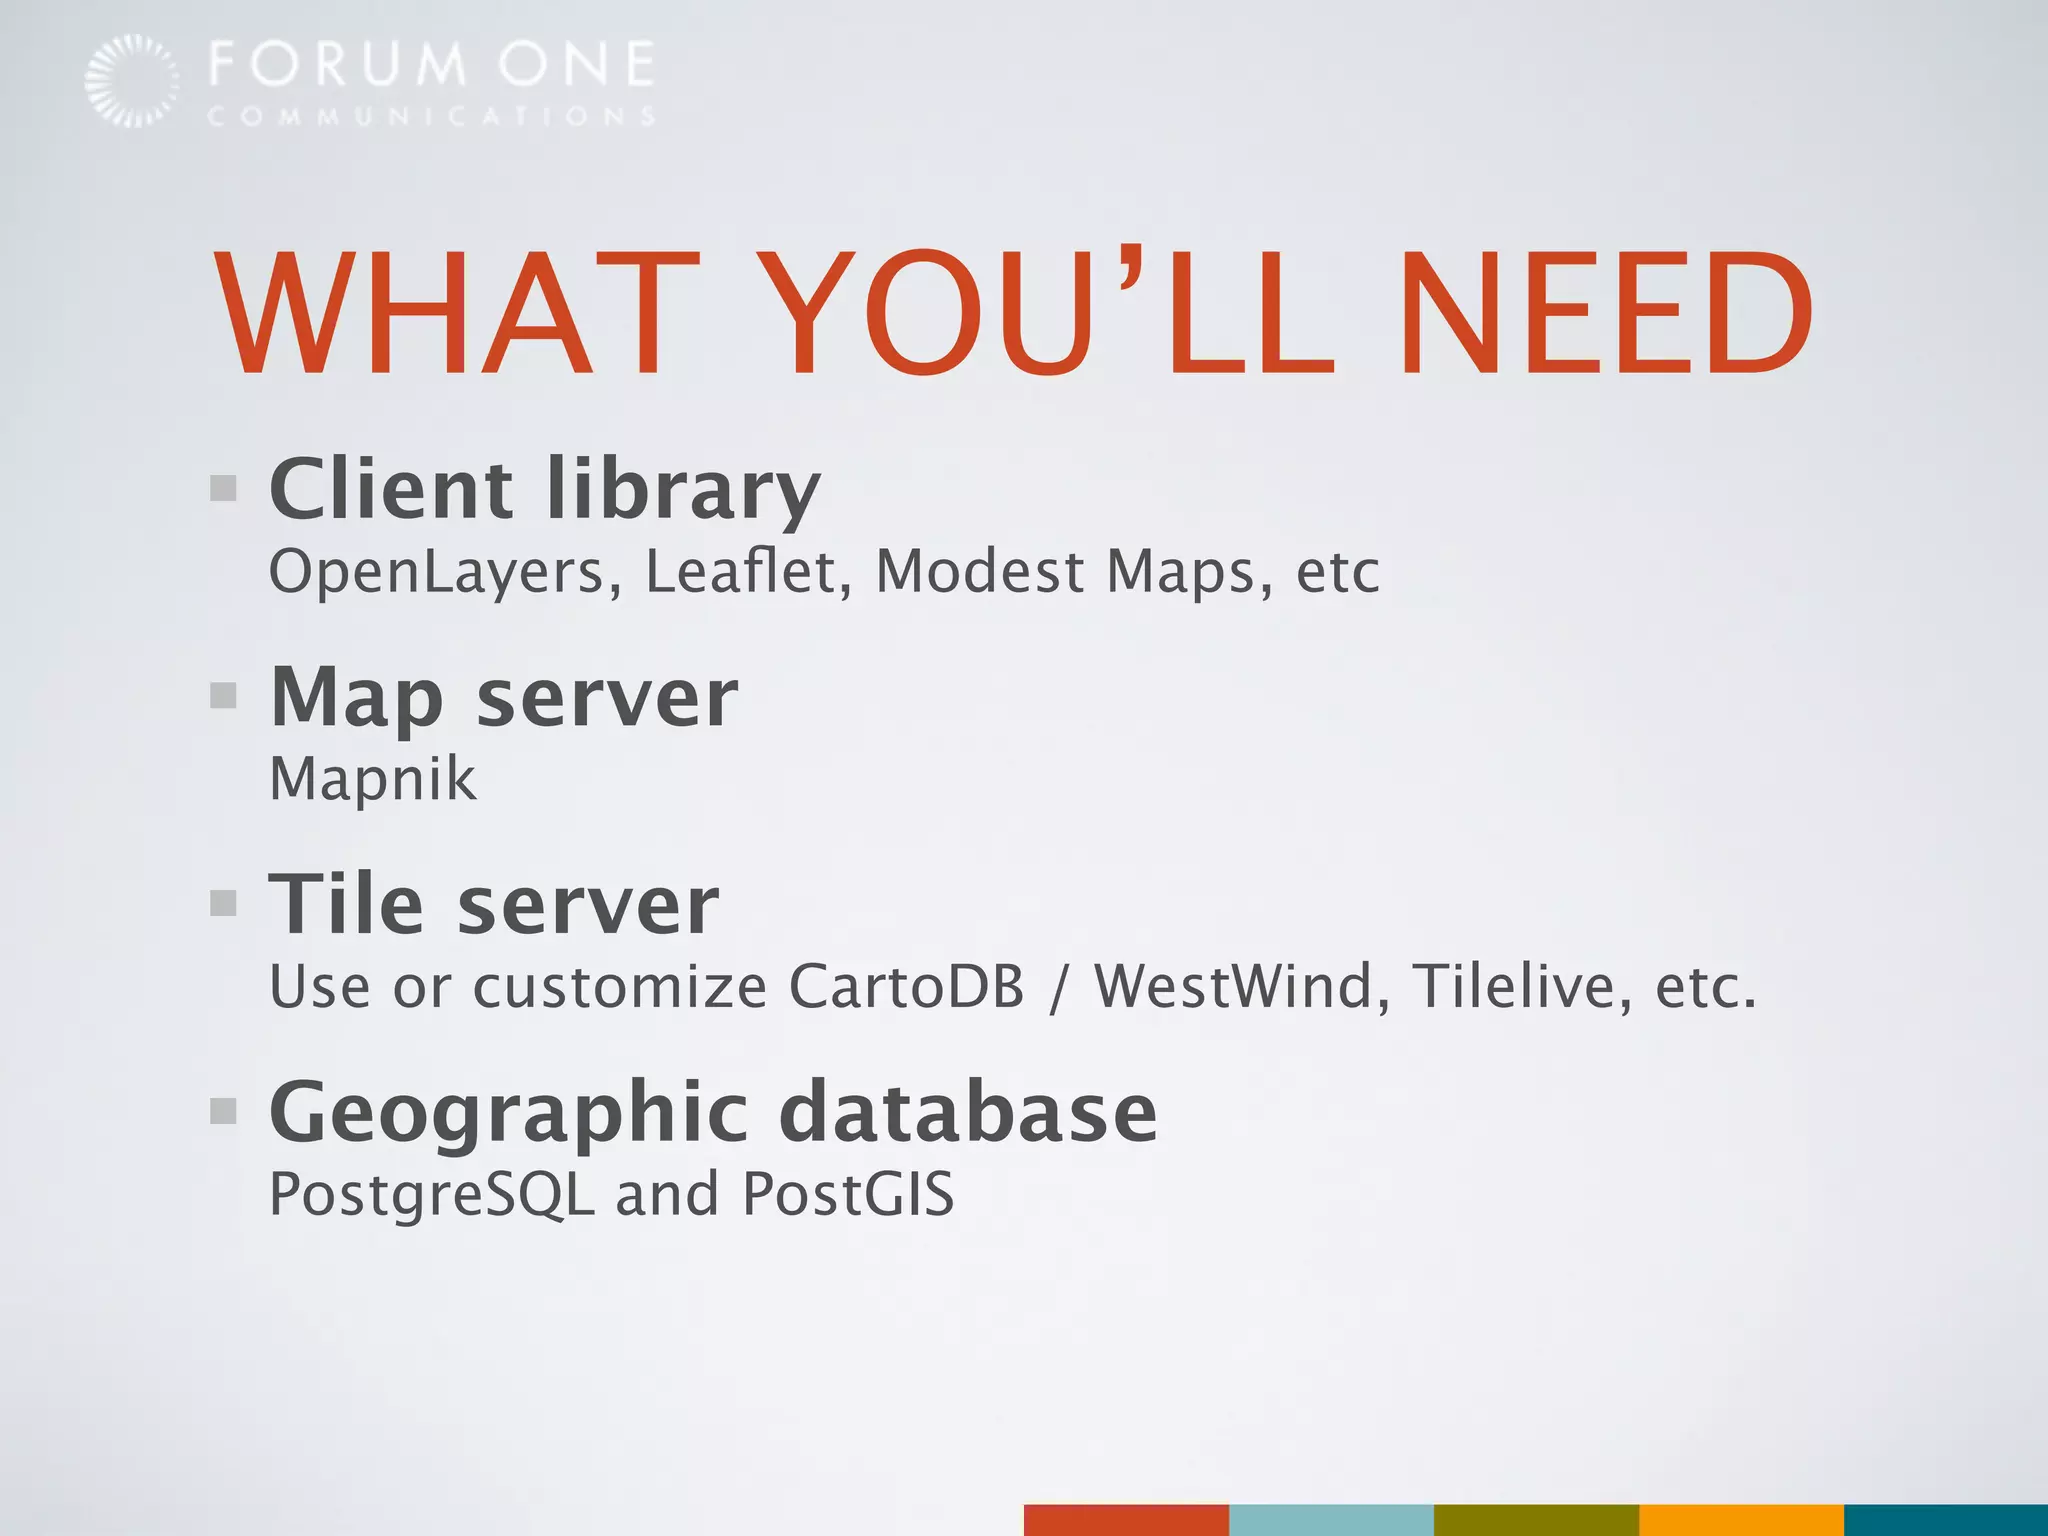
THEMATIC MAPPING &
              DRUPAL
        Building Citizen Engagement
                     with
             Open Source Tools
William Hurley, Manager of
       Programming
GOOGLE MAPS
CHOROPLETH
A map in which areas are shaded
          or patterned
     in proportion to the
     measurement of the
   statistical variable being
BROADBAND AVAILABILITY
HEALTH RANKING OF COUNTIES IN
  VIRGINIA, LIGHTER IS BETTER
OBESITY LEVELS IN THE US BY
COUNTY, LIGHTER IS BETTER
SO HOW DO WE DO
      IT?
MAPPING IN THE
  BROWSER
The simplest solution
ADVANTAGES
ADVANTAGES
Larger talent pool
Javascript is a common skill for web developers
ADVANTAGES
Larger talent pool
Javascript is a common skill for web developers

Easily integrated into Drupal
Drupal modules exist for many libraries
ADVANTAGES
Larger talent pool
Javascript is a common skill for web developers

Easily integrated into Drupal
Drupal modules exist for many libraries

Quicker to deploy
Fewer options means less code to write and test
GOOGLE GEO CHARTS
JSMAP
D3
DISADVANTAGES
DISADVANTAGES
Compatibility and performance
Complicated maps can cause issues in IE
DISADVANTAGES
Compatibility and performance
Complicated maps can cause issues in IE

Not true geography
Google can place points, others are shapes only
DISADVANTAGES
Compatibility and performance
Complicated maps can cause issues in IE

Not true geography
Google can place points, others are shapes only

No panning / zooming
Doesn’t function the same as Google Maps
MAPPING IN THE
   CLOUD
Mapping as a service
ADVANTAGES
ADVANTAGES
Highly customizable maps
Can take multiple inputs and be styled in many ways
ADVANTAGES
Highly customizable maps
Can take multiple inputs and be styled in many ways

Can be used by less technical staff
All configuration done through a user interface
ADVANTAGES
Highly customizable maps
Can take multiple inputs and be styled in many ways

Can be used by less technical staff
All configuration done through a user interface

Easy to set up
Just create an account
TILEMILL
MAPBOX HOSTING
CARTODB DATA VIEW
CARTODB MAP VIEW
GOOGLE FUSION TABLES
DISADVANTAGES
DISADVANTAGES
Dependent on a service
Potential vendor lock-in
DISADVANTAGES
Dependent on a service
Potential vendor lock-in

Data security
It resides outside your firewall
DISADVANTAGES
Dependent on a service
Potential vendor lock-in

Data security
It resides outside your firewall

Opaque infrastructure
How well will it scale?
MAPPING ON YOUR
   NETWORK
   Do it yourself
ADVANTAGES
ADVANTAGES
Complete customization
Total control over every part of the process
ADVANTAGES
Complete customization
Total control over every part of the process

Data and infrastructure security
Ensure that it runs at the compliance level you need
ADVANTAGES
Complete customization
Total control over every part of the process

Data and infrastructure security
Ensure that it runs at the compliance level you need

Scalability
Your hardware, your rules
WHAT YOU’LL NEED
WHAT YOU’LL NEED
Client library
OpenLayers, Leaflet, Modest Maps, etc
WHAT YOU’LL NEED
Client library
OpenLayers, Leaflet, Modest Maps, etc

Map server
Mapnik
WHAT YOU’LL NEED
Client library
OpenLayers, Leaflet, Modest Maps, etc

Map server
Mapnik

Tile server
Use or customize CartoDB / WestWind, Tilelive, etc.
WHAT YOU’LL NEED
Client library
OpenLayers, Leaflet, Modest Maps, etc

Map server
Mapnik

Tile server
Use or customize CartoDB / WestWind, Tilelive, etc.

Geographic database
PostgreSQL and PostGIS
DISADVANTAGES
DISADVANTAGES
Custom development
You build it, you own it
DISADVANTAGES
Custom development
You build it, you own it

Larger investment
Servers and development costs
DISADVANTAGES
Custom development
You build it, you own it

Larger investment
Servers and development costs

Maintenance
Many products in the stack are under active
 development
SO WHAT ARE YOU
  WAITING FOR?
THANK YOU!

Thematic Mapping and Drupal: Building Citizen Engagement with Open Source Tools

Editor's Notes

  • #2 \n
  • #3 When we ask people about maps this is often what they think of. Something that shows where things are, where they are, how to get from here to there. And while that’s great for finding and navigating, what happens if we want to show something about a place that’s more than just an address?\n
  • #4 So I want to introduce you to a word that’s always fun to say. “Choropleth.” Basically a fancy way of describing a map where different colors or shades tell you something about that place.\n
  • #5 They can help people understand public policy\n
  • #6 They can be a way to compare where you are to places around you\n
  • #7 They can help make show trends and patterns\n
  • #8 So now the big question, how do we get there from here?\n
  • #9 So let’s talk about the easiest way first. \n
  • #10 Most client side tools are pretty similar. They use Javascript inside the browser to show and color the map. They are made to be fairly easy to work with most have a Drupal module or two already written to take advantage of them.\n
  • #11 Most client side tools are pretty similar. They use Javascript inside the browser to show and color the map. They are made to be fairly easy to work with most have a Drupal module or two already written to take advantage of them.\n
  • #12 Most client side tools are pretty similar. They use Javascript inside the browser to show and color the map. They are made to be fairly easy to work with most have a Drupal module or two already written to take advantage of them.\n
  • #13 Free, not open source; limited customization but is fast and works in all browsers. \n
  • #14 Native Drupal module, completely customizable shapes.\n
  • #15 Free and open source; customizable shapes. Doesn’t work in older versions of IE.\n
  • #16 Since all of these run completely in the browser it is dependent on the user’s computer. Older computers and older browsers may be slow using these. Most of them also only show shapes, so if you want to layer address over top it will only work in Google Geo Charts. And people can’t zoom or pan in a way they may be used to.\n
  • #17 Since all of these run completely in the browser it is dependent on the user’s computer. Older computers and older browsers may be slow using these. Most of them also only show shapes, so if you want to layer address over top it will only work in Google Geo Charts. And people can’t zoom or pan in a way they may be used to.\n
  • #18 Since all of these run completely in the browser it is dependent on the user’s computer. Older computers and older browsers may be slow using these. Most of them also only show shapes, so if you want to layer address over top it will only work in Google Geo Charts. And people can’t zoom or pan in a way they may be used to.\n
  • #19 \n
  • #20 These services are designed to make creating a wide variety of maps as easy as possible. They accept a range of inputs and allow significant customizations. And they are intended to be used not just by programmers but also by people with less technical knowledge. \n
  • #21 These services are designed to make creating a wide variety of maps as easy as possible. They accept a range of inputs and allow significant customizations. And they are intended to be used not just by programmers but also by people with less technical knowledge. \n
  • #22 These services are designed to make creating a wide variety of maps as easy as possible. They accept a range of inputs and allow significant customizations. And they are intended to be used not just by programmers but also by people with less technical knowledge. \n
  • #23 The Tilemill application is usually run on your desktop. You can input common data sets such as country or state and then customize colors, labels, lines using a CSS-like language. You then upload the final map to...\n
  • #24 The Mapbox hosting service where they can be embedded on the site. It’s been heavily used on both the new energy.gov and fcc.gov sites.\n
  • #25 If you need to create more dynamic maps CartoDB is a new site that allows you to upload and manage your data and then convert that directly to maps through their website.\n
  • #26 These maps can be customized using a CSS-like language and then easily exported and embedded on your site. \n
  • #27 Like CartoDB Google Fusion Tables allows you to import and edit data directly within their site and then change it to be a map\n
  • #28 Which can then be combined with other Google Maps functionality. \n
  • #29 The disadvantages for these services are the same as any software as a service. When you select one you choose a direction that may be difficult to reverse. Similarly any data you upload is outside your immediate control and the infrastructure that supports the service is managed by the service. \n
  • #30 The disadvantages for these services are the same as any software as a service. When you select one you choose a direction that may be difficult to reverse. Similarly any data you upload is outside your immediate control and the infrastructure that supports the service is managed by the service. \n
  • #31 The disadvantages for these services are the same as any software as a service. When you select one you choose a direction that may be difficult to reverse. Similarly any data you upload is outside your immediate control and the infrastructure that supports the service is managed by the service. \n
  • #32 Which brings us to the most difficult of the three approaches.\n
  • #33 This involves hosting and typically developing custom code to do what you need it to do. And with that you get the ability to make any changes you want, have the maps pull data from custom data sources, do custom transformations before it’s visualized. You also ensure that the underlying data is where you need it to be. And lastly it will be running on your infrastructure, so whatever you need to be able to support you can easily provide.\n
  • #34 This involves hosting and typically developing custom code to do what you need it to do. And with that you get the ability to make any changes you want, have the maps pull data from custom data sources, do custom transformations before it’s visualized. You also ensure that the underlying data is where you need it to be. And lastly it will be running on your infrastructure, so whatever you need to be able to support you can easily provide.\n
  • #35 This involves hosting and typically developing custom code to do what you need it to do. And with that you get the ability to make any changes you want, have the maps pull data from custom data sources, do custom transformations before it’s visualized. You also ensure that the underlying data is where you need it to be. And lastly it will be running on your infrastructure, so whatever you need to be able to support you can easily provide.\n
  • #36 There are some components that you’ll need:\n* A way for the user to interact with the map\n* Something to actually create the map -- Mapnik is a common component with a lot of momentum\n* A web server to send the map out -- both CartoDB and MapBox have their code available on Github\n* A place to store this geographic data\n
  • #37 There are some components that you’ll need:\n* A way for the user to interact with the map\n* Something to actually create the map -- Mapnik is a common component with a lot of momentum\n* A web server to send the map out -- both CartoDB and MapBox have their code available on Github\n* A place to store this geographic data\n
  • #38 There are some components that you’ll need:\n* A way for the user to interact with the map\n* Something to actually create the map -- Mapnik is a common component with a lot of momentum\n* A web server to send the map out -- both CartoDB and MapBox have their code available on Github\n* A place to store this geographic data\n
  • #39 There are some components that you’ll need:\n* A way for the user to interact with the map\n* Something to actually create the map -- Mapnik is a common component with a lot of momentum\n* A web server to send the map out -- both CartoDB and MapBox have their code available on Github\n* A place to store this geographic data\n
  • #40 \n
  • #41 \n
  • #42 \n
  • #43 What’s amazing to see is the pace of progress with these tools. Even as far back as a couple of years ago they were so much less mature. The ability to write a little bit of scripting, to sign up a service or -- even if you choose to do it yourself -- to stand on the shoulders of giants and make their work somewhere you can start from is amazing. Geographic context can turn information that’s just a set of numbers in a table to something more meaningful, more personal, more immediate. And now the ability to do that is easily within reach.\n
  • #44 \n