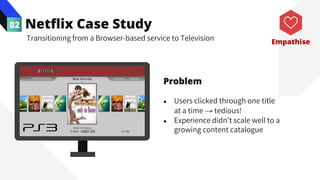
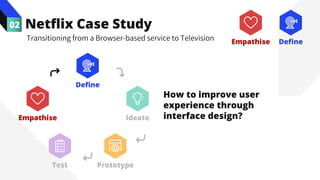
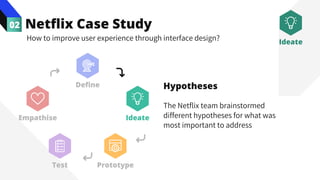
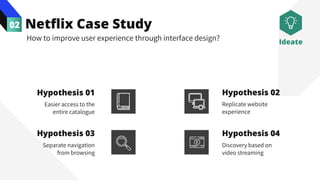
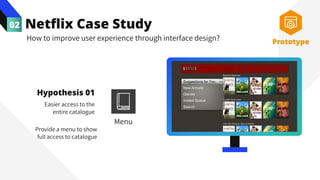
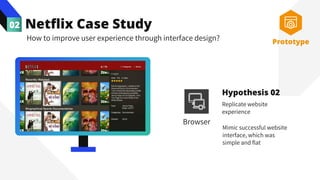
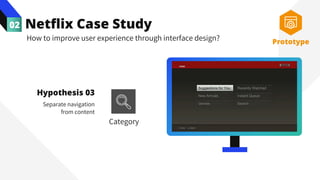
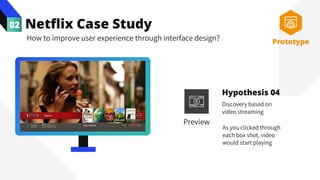
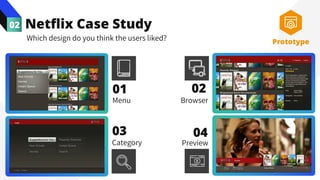
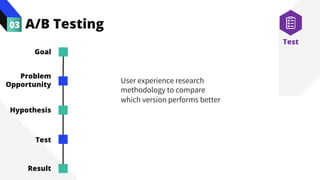
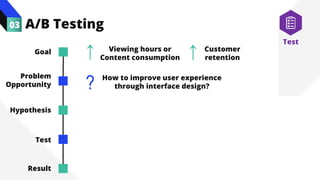
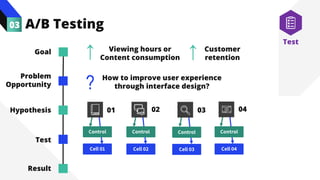
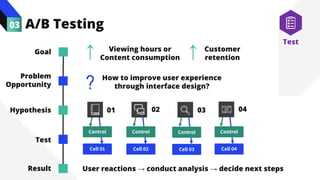
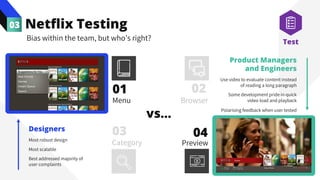
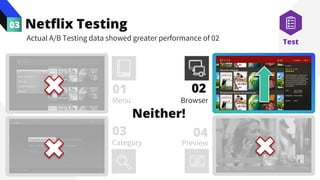
The Value of
Data
in Design
Dr. Michele Nguyen
Research Fellow & Co-Instructor of the Data Science class
Asian School of the Environment, Nanyang Technological University
Data and
Design
01
Netflix
Case Study
02
A/B
Testing
03
Practical
Considerations
04
Takeaway
Questions
05
Session Contents
Further
Resources
Data and Design
01
Are data science and design practice incompatible?
Data and Design
01
Are data science and design practice incompatible?
Data Critics
Data Proponents
Data dehumanizes the design process,
reducing human experience and
design evaluation to “just numbers”
Data science reveals the truth - it is a
proceduralised, scientific endeavour where rigor
leads to irrefutable results and therefore certainty
Data undermines and
undervalues designer’s
intuition and experience
Data stifles creativity
and removes the “art”
from the design process
“Let the crowd speak with their
clicks and what emerges will
necessarily be the best design”
Same Goal
Understanding users
and crafting elegant
experiences for them
Data and Design
01
Are data science and design practice incompatible?
Data Design
à
Data and Design
01
What do we mean by data?
Same Goal
Understanding users
and crafting elegant
experiences for them
Data Design
à
Data and Design
01
Gatherable,
measurable,
and analysable
information
● Craft knowledge
● Lab-based studies
● Surveys
● Field observations
● Large-scale user data
● Online experiments
What do we mean by data?
What
Data and Design
01
Gatherable,
measurable,
and analysable
information
What’s the purpose of data?
What
à
To learn about user
behaviours and needs
Understand the effectiveness
of products and innovations
Why
Data and Design
Behaviour,
Attitudes,
Expectations
Self-reported,
observed or from
experiment
Longitudinal or
snapshot
Qualitative or
quantitative
Collect
contextually or
in isolation
Moderated or
unmoderated
01
What kinds of data? How to collect?
Data and Design
Behaviour,
Attitudes,
Expectations
Questions to ask &
potential biased or
default responses
Self-reported,
observed or from
experiment
Risk of bias vs unable to
measure e.g. emotions
and attitudes
Longitudinal or
snapshot
Qualitative or
quantitative
Collect
contextually or
in isolation
Mimic real-life or
control for external
factors
Moderated or
unmoderated
01
What kinds of data? How to collect?
Data and Design
Collect
contextually or
in isolation
Mimic real-life or
control for external
factors
01
What kinds of data? How to collect?
Data and Design
01
How does this fit into Design Thinking?
Empathise Ideate
Prototype
Test
Define
5 “modes” of Design
Thinking
Data and Design
01
How does this fit into Design Thinking?
Empathise
● Identify the user’s needs
that they may or may not
be aware of themselves
● Identify the right users to
design for
Empathise Ideate
Prototype
Test
Define
Data and Design
01
How does this fit into Design Thinking?
Define, Ideate, Prototype
● Come up with an actionable
problem statement
● Explore a wide solution space
(numerically and in diversity)
● From this repository of ideas,
build prototypes that users can
interact with
Empathise Ideate
Prototype
Test
Define
Data and Design
01
How does this fit into Design Thinking?
Test
e.g. usage metrics, quotes and
reactions
● Encourage buy-in from key
stakeholders
● Choose between different
prototypes
● Inform next iterations of
prototypes
● Signal need to get back to
drawing board or reframe the
problem
Empathise Ideate
Prototype
Test
Define
Many companies with and
without digital roots, have
used data to empower their
designs
02 The Value of
Data in Design
02
*Thomke, S. (2020). Building a Culture of
Experimentation. Harvard Business Review.
The Value of
Data in Design
Many companies with and
without digital roots, have
used data to empower their
designs
e.g. online experiments have
collectively boosted revenue per
search by 10% to 25% a year.*
Netflix Case Study
02
Transitioning from a Browser-based service to Television
Netflix Case Study
02
Transitioning from a Browser-based service to Television
Customer
retention
Key metric
Subscription based
business model
High
Correlation
Netflix Case Study
02
Transitioning from a Browser-based service to Television
Customer
retention
Key metric
Viewing hours or
Content consumption
Subscription based
business model
High
Correlation
Netflix Case Study
02
Transitioning from a Browser-based service to Television
Customer
retention
Key metric Proxy metric
Viewing hours or
Content consumption
Subscription based
business model
Easy to measure
quickly over time
Netflix Case Study
02
Transitioning from a Browser-based service to Television
Early 2000s:
Original user interface on the
Sony PlayStation 3
Empathise
Netflix Case Study
02
Transitioning from a Browser-based service to Television
Problem
● Users clicked through one title
at a time → tedious!
● Experience didn’t scale well to a
growing content catalogue
Empathise
Netflix Case Study
02
Transitioning from a Browser-based service to Television
How to improve user
experience through
interface design?
Empathise Ideate
Prototype
Test
Define
Define
Empathise
Netflix Case Study
02
How to improve user experience through interface design?
Hypotheses
The Netflix team brainstormed
different hypotheses for what was
most important to address
Empathise Ideate
Prototype
Test
Define
Ideate
Netflix Case Study
02
How to improve user experience through interface design?
Hypothesis 01
Easier access to the
entire catalogue
Hypothesis 03
Separate navigation
from browsing
Hypothesis 04
Discovery based on
video streaming
Replicate website
experience
Hypothesis 02
Ideate
Netflix Case Study
02
How to improve user experience through interface design?
Hypothesis 01
Easier access to the
entire catalogue
Provide a menu to show
full access to catalogue
Prototype
Menu
Netflix Case Study
02
How to improve user experience through interface design?
Replicate website
experience
Hypothesis 02
Mimic successful website
interface, which was
simple and flat
Prototype
Browser
Netflix Case Study
02
How to improve user experience through interface design?
Hypothesis 03
Separate navigation
from content
Prototype
Category
Netflix Case Study
02
How to improve user experience through interface design?
Discovery based on
video streaming
Hypothesis 04
As you clicked through
each box shot, video
would start playing
Prototype
Preview
Netflix Case Study
02
Which design do you think the users liked?
01 02
03 04
Prototype
Menu Browser
Preview
Category
A/B Testing
03
User experience research
methodology to compare
which version performs better
Test
Goal
Problem
Opportunity
Hypothesis
Test
Result
A/B Testing
03
Test
Viewing hours or
Content consumption
↑ Customer
retention
↑
How to improve user experience
through interface design?
?
Goal
Problem
Opportunity
Hypothesis
Test
Result
A/B Testing
03
Test
01 03 04
02
How to improve user experience
through interface design?
?
Goal
Problem
Opportunity
Hypothesis
Test
Result
Viewing hours or
Content consumption
↑ Customer
retention
↑
Control
Cell 01
Control
Cell 02
Control
Cell 03
Control
Cell 04
A/B Testing
03
Test
01 03 04
02
How to improve user experience
through interface design?
?
Goal
Problem
Opportunity
Hypothesis
Test
Result
Viewing hours or
Content consumption
↑ Customer
retention
↑
Control
Cell 01
Control
Cell 02
Control
Cell 03
Control
Cell 04
User reactions → conduct analysis → decide next steps
Netflix Testing
03
Bias within the team, but who’s right?
Designers
Most robust design
Most scalable
Best addressed majority of
user complaints
Product Managers
and Engineers
Use video to evaluate content instead
of reading a long paragraph
Some development pride in quick
video load and playback
Polarising feedback when user tested
01 02
vs…
Test
03 04
Menu Browser
Category Preview
Netflix Testing
03
Actual A/B Testing data showed greater performance of 02
01 02
Neither!
Test
03 04
Menu Browser
Category Preview
Considerations
Data
Low quality, unrepresentative or
poor analysis
→ Misleading results
A/B Testing
Helps with “what” but not “why”
→ Follow-up interviews may help
04
Understand the practical limitations
Considerations
ü Avoid reducing the users to
numbers
→ Ethics/moral implications
ü Iterate… But not to no end!
ü Avoid analysing in isolation
→ Cross reference data
(triangulation)
04
Understand the practical limitations
q What would you like to learn about your users?
q What data do you have for identifying goals,
problems or opportunities, and hypotheses?
q How can you evaluate the performance of your
design prototypes? Takeaway
Questions
Dr. Michele Nguyen
Email michele.nguyen@ntu.edu.sg
Website https://drmichelenguyen.com/
The Value of
Data in Design
Further
Resources
Dr. Michele Nguyen
Email michele.nguyen@ntu.edu.sg
Website https://drmichelenguyen.com/
● King, R., Churchill, E. F., & Tan, C. (2017). Designing with data: Improving the
user experience with A/B testing. O'Reilly Media, Inc.*
● Stanford D school Design Thinking Bootleg.*
● Thomke, S. (2020). Building a Culture of Experimentation. Harvard Business
Review.
● Higham, R. & McFarland, C. (2022). The Hypothesis Kit. Experimentation Hub.
http://www.experimentationhub.com/hypothesis-kit.html
● KU Leuven Marketing department. R for marketing students.
https://bookdown.org/content/6ef13ea6-4e86-4566-b665-ebcd19d45029
*materials adapted for today’s session
The Value of
Data in Design
Questions
& Answers
Dr. Michele Nguyen
Email michele.nguyen@ntu.edu.sg
Website https://drmichelenguyen.com/
The Value of
Data in Design

The Value of Data in Design

  • 1.
    The Value of Data inDesign Dr. Michele Nguyen Research Fellow & Co-Instructor of the Data Science class Asian School of the Environment, Nanyang Technological University
  • 2.
  • 3.
    Data and Design 01 Aredata science and design practice incompatible?
  • 4.
    Data and Design 01 Aredata science and design practice incompatible? Data Critics Data Proponents Data dehumanizes the design process, reducing human experience and design evaluation to “just numbers” Data science reveals the truth - it is a proceduralised, scientific endeavour where rigor leads to irrefutable results and therefore certainty Data undermines and undervalues designer’s intuition and experience Data stifles creativity and removes the “art” from the design process “Let the crowd speak with their clicks and what emerges will necessarily be the best design”
  • 5.
    Same Goal Understanding users andcrafting elegant experiences for them Data and Design 01 Are data science and design practice incompatible? Data Design à
  • 6.
    Data and Design 01 Whatdo we mean by data? Same Goal Understanding users and crafting elegant experiences for them Data Design à
  • 7.
    Data and Design 01 Gatherable, measurable, andanalysable information ● Craft knowledge ● Lab-based studies ● Surveys ● Field observations ● Large-scale user data ● Online experiments What do we mean by data? What
  • 8.
    Data and Design 01 Gatherable, measurable, andanalysable information What’s the purpose of data? What à To learn about user behaviours and needs Understand the effectiveness of products and innovations Why
  • 9.
    Data and Design Behaviour, Attitudes, Expectations Self-reported, observedor from experiment Longitudinal or snapshot Qualitative or quantitative Collect contextually or in isolation Moderated or unmoderated 01 What kinds of data? How to collect?
  • 10.
    Data and Design Behaviour, Attitudes, Expectations Questionsto ask & potential biased or default responses Self-reported, observed or from experiment Risk of bias vs unable to measure e.g. emotions and attitudes Longitudinal or snapshot Qualitative or quantitative Collect contextually or in isolation Mimic real-life or control for external factors Moderated or unmoderated 01 What kinds of data? How to collect?
  • 11.
    Data and Design Collect contextuallyor in isolation Mimic real-life or control for external factors 01 What kinds of data? How to collect?
  • 12.
    Data and Design 01 Howdoes this fit into Design Thinking? Empathise Ideate Prototype Test Define 5 “modes” of Design Thinking
  • 13.
    Data and Design 01 Howdoes this fit into Design Thinking? Empathise ● Identify the user’s needs that they may or may not be aware of themselves ● Identify the right users to design for Empathise Ideate Prototype Test Define
  • 14.
    Data and Design 01 Howdoes this fit into Design Thinking? Define, Ideate, Prototype ● Come up with an actionable problem statement ● Explore a wide solution space (numerically and in diversity) ● From this repository of ideas, build prototypes that users can interact with Empathise Ideate Prototype Test Define
  • 15.
    Data and Design 01 Howdoes this fit into Design Thinking? Test e.g. usage metrics, quotes and reactions ● Encourage buy-in from key stakeholders ● Choose between different prototypes ● Inform next iterations of prototypes ● Signal need to get back to drawing board or reframe the problem Empathise Ideate Prototype Test Define
  • 16.
    Many companies withand without digital roots, have used data to empower their designs 02 The Value of Data in Design
  • 17.
    02 *Thomke, S. (2020).Building a Culture of Experimentation. Harvard Business Review. The Value of Data in Design Many companies with and without digital roots, have used data to empower their designs e.g. online experiments have collectively boosted revenue per search by 10% to 25% a year.*
  • 18.
    Netflix Case Study 02 Transitioningfrom a Browser-based service to Television
  • 19.
    Netflix Case Study 02 Transitioningfrom a Browser-based service to Television Customer retention Key metric Subscription based business model
  • 20.
    High Correlation Netflix Case Study 02 Transitioningfrom a Browser-based service to Television Customer retention Key metric Viewing hours or Content consumption Subscription based business model
  • 21.
    High Correlation Netflix Case Study 02 Transitioningfrom a Browser-based service to Television Customer retention Key metric Proxy metric Viewing hours or Content consumption Subscription based business model Easy to measure quickly over time
  • 22.
    Netflix Case Study 02 Transitioningfrom a Browser-based service to Television Early 2000s: Original user interface on the Sony PlayStation 3 Empathise
  • 23.
    Netflix Case Study 02 Transitioningfrom a Browser-based service to Television Problem ● Users clicked through one title at a time → tedious! ● Experience didn’t scale well to a growing content catalogue Empathise
  • 24.
    Netflix Case Study 02 Transitioningfrom a Browser-based service to Television How to improve user experience through interface design? Empathise Ideate Prototype Test Define Define Empathise
  • 25.
    Netflix Case Study 02 Howto improve user experience through interface design? Hypotheses The Netflix team brainstormed different hypotheses for what was most important to address Empathise Ideate Prototype Test Define Ideate
  • 26.
    Netflix Case Study 02 Howto improve user experience through interface design? Hypothesis 01 Easier access to the entire catalogue Hypothesis 03 Separate navigation from browsing Hypothesis 04 Discovery based on video streaming Replicate website experience Hypothesis 02 Ideate
  • 27.
    Netflix Case Study 02 Howto improve user experience through interface design? Hypothesis 01 Easier access to the entire catalogue Provide a menu to show full access to catalogue Prototype Menu
  • 28.
    Netflix Case Study 02 Howto improve user experience through interface design? Replicate website experience Hypothesis 02 Mimic successful website interface, which was simple and flat Prototype Browser
  • 29.
    Netflix Case Study 02 Howto improve user experience through interface design? Hypothesis 03 Separate navigation from content Prototype Category
  • 30.
    Netflix Case Study 02 Howto improve user experience through interface design? Discovery based on video streaming Hypothesis 04 As you clicked through each box shot, video would start playing Prototype Preview
  • 31.
    Netflix Case Study 02 Whichdesign do you think the users liked? 01 02 03 04 Prototype Menu Browser Preview Category
  • 32.
    A/B Testing 03 User experienceresearch methodology to compare which version performs better Test Goal Problem Opportunity Hypothesis Test Result
  • 33.
    A/B Testing 03 Test Viewing hoursor Content consumption ↑ Customer retention ↑ How to improve user experience through interface design? ? Goal Problem Opportunity Hypothesis Test Result
  • 34.
    A/B Testing 03 Test 01 0304 02 How to improve user experience through interface design? ? Goal Problem Opportunity Hypothesis Test Result Viewing hours or Content consumption ↑ Customer retention ↑ Control Cell 01 Control Cell 02 Control Cell 03 Control Cell 04
  • 35.
    A/B Testing 03 Test 01 0304 02 How to improve user experience through interface design? ? Goal Problem Opportunity Hypothesis Test Result Viewing hours or Content consumption ↑ Customer retention ↑ Control Cell 01 Control Cell 02 Control Cell 03 Control Cell 04 User reactions → conduct analysis → decide next steps
  • 36.
    Netflix Testing 03 Bias withinthe team, but who’s right? Designers Most robust design Most scalable Best addressed majority of user complaints Product Managers and Engineers Use video to evaluate content instead of reading a long paragraph Some development pride in quick video load and playback Polarising feedback when user tested 01 02 vs… Test 03 04 Menu Browser Category Preview
  • 37.
    Netflix Testing 03 Actual A/BTesting data showed greater performance of 02 01 02 Neither! Test 03 04 Menu Browser Category Preview
  • 38.
    Considerations Data Low quality, unrepresentativeor poor analysis → Misleading results A/B Testing Helps with “what” but not “why” → Follow-up interviews may help 04 Understand the practical limitations
  • 39.
    Considerations ü Avoid reducingthe users to numbers → Ethics/moral implications ü Iterate… But not to no end! ü Avoid analysing in isolation → Cross reference data (triangulation) 04 Understand the practical limitations
  • 40.
    q What wouldyou like to learn about your users? q What data do you have for identifying goals, problems or opportunities, and hypotheses? q How can you evaluate the performance of your design prototypes? Takeaway Questions Dr. Michele Nguyen Email michele.nguyen@ntu.edu.sg Website https://drmichelenguyen.com/ The Value of Data in Design
  • 41.
    Further Resources Dr. Michele Nguyen Emailmichele.nguyen@ntu.edu.sg Website https://drmichelenguyen.com/ ● King, R., Churchill, E. F., & Tan, C. (2017). Designing with data: Improving the user experience with A/B testing. O'Reilly Media, Inc.* ● Stanford D school Design Thinking Bootleg.* ● Thomke, S. (2020). Building a Culture of Experimentation. Harvard Business Review. ● Higham, R. & McFarland, C. (2022). The Hypothesis Kit. Experimentation Hub. http://www.experimentationhub.com/hypothesis-kit.html ● KU Leuven Marketing department. R for marketing students. https://bookdown.org/content/6ef13ea6-4e86-4566-b665-ebcd19d45029 *materials adapted for today’s session The Value of Data in Design
  • 42.
    Questions & Answers Dr. MicheleNguyen Email michele.nguyen@ntu.edu.sg Website https://drmichelenguyen.com/ The Value of Data in Design