The Power of Data Driven Decisions in K12
•
0 likes•197 views

Acting On Student Data With School Operation Systems. Understanding the whole K-12 data picture. 1) Integration: Integrating your SIS with a school operation system can help increase school security, save clerical time, save money and support teachers. 2) Analyzing Data: Administrators using an operations system can collect, automate, centralize and analyze their data. Improving student performance and increasing operational efficiencies. 3) Data Reports: Administrators can analyze this data using powerful, actionable reports, and make data-driven decisions that are quantifiable and justifiable.

Recommended
More Related Content
Viewers also liked
Viewers also liked (16)
Similar to The Power of Data Driven Decisions in K12
Similar to The Power of Data Driven Decisions in K12 (20)
More from ScholarChip ☁ Tools for Smarter Schools
More from ScholarChip ☁ Tools for Smarter Schools (18)
Recently uploaded
Recently uploaded (20)
The Power of Data Driven Decisions in K12
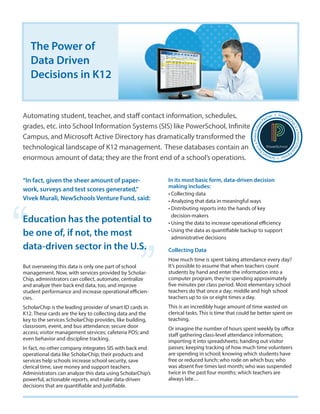
- 1. “In fact, given the sheer amount of paper- work, surveys and test scores generated,” Vivek Murali, NewSchools Venture Fund, said: Education has the potential to be one of, if not, the most data-driven sector in the U.S. But overseeing this data is only one part of school management. Now, with services provided by Scholar- Chip, administrators can collect, automate, centralize and analyze their back end data, too, and improve student performance and increase operational efficien- cies. ScholarChip is the leading provider of smart ID cards in K12. These cards are the key to collecting data and the key to the services ScholarChip provides, like building, classroom, event, and bus attendance; secure door access; visitor management services; cafeteria POS; and even behavior and discipline tracking. In fact, no other company integrates SIS with back end operational data like ScholarChip; their products and services help schools increase school security, save clerical time, save money and support teachers. Administrators can analyze this data using ScholarChip’s powerful, actionable reports, and make data-driven decisions that are quantifiable and justifiable. In its most basic form, data-driven decision making includes: • Collecting data • Analyzing that data in meaningful ways • Distributing reports into the hands of key • decision-makers • Using the data to increase operational efficiency • Using the data as quantifiable backup to support • administrative decisions Collecting Data How much time is spent taking attendance every day? It’s possible to assume that when teachers count students by hand and enter the information into a computer program, they’re spending approximately five minutes per class period. Most elementary school teachers do that once a day; middle and high school teachers up to six or eight times a day. This is an incredibly huge amount of time wasted on clerical tasks. This is time that could be better spent on teaching. Or imagine the number of hours spent weekly by office staff gathering class-level attendance information; importing it into spreadsheets; handing out visitor passes; keeping tracking of how much time volunteers are spending in school; knowing which students have free or reduced lunch; who rode on which bus; who was absent five times last month; who was suspended twice in the past four months; which teachers are always late… The Power of Data Driven Decisions in K12 Automating student, teacher, and staff contact information, schedules, grades, etc. into School Information Systems (SIS) like PowerSchool, Infinite Campus, and Microsoft Active Directory has dramatically transformed the technological landscape of K12 management. These databases contain an enormous amount of data; they are the front end of a school’s operations. ScholarC hipisaPowerSchool PartnerScholarC hipisaPowerSchool Partner • •
- 2. There are school districts that have recaptured that important teaching and office time by implementing an automated system like ScholarChip’s. The responsibility for attendance is on the student, teacher or staff member – he or she simply taps in when they enter the building or classroom, which adds no appreciable time to collecting this data, and administrators can find detailed information in minutes. Classroom attendance is just one area of data that is collected. Imagine all the time spent on a field trip, where teachers count students on the bus, off the bus, at an event, etc., all by call-out and using paper check- marks. How can a district keep track of a student who goes to the bathroom seven times a day? Or how much time is spent trying to find out which volunteer spent time in each of three classrooms? These tasks can be quickly and easily accomplished by using smart ID cards and ScholarChip’s services. Teachers get more instruction time, students get more seat time, office staff gets more time for other tasks—the informa- tion is more accurate, and it’s reported to administration instantly. Automation creates a safer school environment that is run more efficiently and more cost effectively. Other segments of school operations include building and bus attendance, teacher and staff timecards, secure door access, cafeteria POS, visitor management, hallway monitoring, and behavior incidents and referrals. Analyzing Data ScholarChip’s Management Portal provides access to over 100 reports when a school has full program imple- mentation. Many of these reports can be calculated by student, teacher, school, time frame (daily, weekly, monthly, annually), etc., in configurations that provide information that is most important in any situation. When added together, the number of reports that show identifiable, actionable information can go into the thousands. Attendance reports provide real-time data; administra- tors know who is in school or not, or who is in a particu- lar classroom or not, at any given moment. But the detail captured provides a host of information that can be analyzed and used to improve student performance as well as administrative effectiveness. Below are sample report titles that show how powerful ScholarChip’s data analysis can be: For School Safety - Attendance In the event of an emergency or school lockdown, it is imperative for administrators to know who is in their buildings (students, teachers, visitors), who is marked “skipped”and who is absent. With an automated system by ScholarChip, this information is accurate and immedi- ate, and can be provided to law enforcement within minutes, which might mean the difference between protection or disaster, between life or death: • Open Campus Report: provides a list of entry/exit data • for students in a particular school • Absent, Late, Suspended, Early Dismissal Reports • Cardless Entry: shows students in a building that do • not have their smart ID cards • Re-entry Log: shows students who have attempted • to re-enter the building • Present/Absent/Late Staff, including time of arrival For School Safety – Visitor Management Creating a safe environment for learning is paramount for any school district, and one of the most vital aspects of safety is knowing who is in your school at any given time. These reports also make it easy to analyze volun- teer time spent, or prepare for future scheduling: • Visitors by Date/Reason/Location/Time Clock • Visitors by Entry/Exit Door • Visitors by Person/Office Visited
- 3. • •students are actually spending in class, in minutes • Present/Absent/Late Staff and Staff Arrival • Time Reports For Discipline Tracking student disciplinary incidents is another important way to see trends for early intervention and to provide hard evidence when parents have questions about their children or teachers’and administrators’ decisions: • Suspension History • Discipline and Suspension Report: available in • detail and in summary • Discipline Events by Infraction Starting in late 2016, ScholarChip will integrate with ABE Systems, its software-based behavior management system, that focuses on each part of the corrective process as well as integrates with the whole, over a student’s entire school career. These reports will be particularly vital to demonstrating when students need extra help like psychiatric support, or when discussing and/or implementing an IEP (Individualized Education Plan). Student Accounts and ID Cards Keeping track of students’ID cards and parking permits can be a frustrating, time consuming clerical task for office staff. ScholarChip’s reports make it easy, which saves time and money: • Cards Issued: shows all students and staff who • have a card • Frequently Cardless: shows which students routinely • come to school without their cards, which may • require intervention • Parking Data: shows which students have permits, • car license plates, parking spots, etc. For Cafeteria Point-of-Sale School operations include managing the cafeteria. From ordering food, trays and paper supplies to keeping track of who gets free or reduced meals, administrators are responsible for an area of the schoolday they may not have learned about in college. However, ScholarChip’s smart ID card makes it easy to gather detailed information on a host of activities to make cafeteria management and menu planning easier and more cost-effective: • Items Sold: displays all menu items sold within a • particular date range • Free/Reduced Eligible Students • Missing Free/Reduced Applications: shows which • students haven’t processed their paperwork • Student and Staff POS Account Summary and Detail • Prepayments by Students and Staff • Daily Register and Cash Reconciliation • Daily Transaction Summary For Early Intervention The only way to see if a student is at-risk for attendance issues, including class cuts, is by seeing their record over time. Often, it takes weeks—sometimes months—to gather classroom-level data, create reports, and analyze them to see who needs extra support. By then, it might already be too late. ScholarChip’s reports provide vital information on a daily basis—data that could be used for early intervention or for identifying at-risk students more quickly. Notifica- tions can also be set up so that teachers, administrators, school psychologists, and/or parents can be alerted when a student reaches a particular threshold, which also helps for early intervention: • Detailed Top Absent/Tardy Student: provides in • descending order the list of students and • detailed attendance for a selected number of • absences or tardies • Attendance Level: displays all students with more than • a certain number of absences • Class Cuts: shows which student is skipping • which classes Attendance data can also be used to determine which teachers or other staff members may need extra support: • Teacher Attendance Book: provides building • attendance as well as class present, tardy and • cut data for a specific teacher • Full Year Attendance: shows students’class attendance • and class cuts by teacher • Unmarked Class Attendance: shows all periods and • teachers that did not process class attendance. • Class Time by Student: shows the amount of time
- 4. Certainly, student-level information can be used to help at-risk students reach their attendance goals, however, other school analyses can improve operational goals and increase overall district success: • Administrators can discover if a particular teacher’s • class is consistently cut, which could prompt • investigation. • Human resources can determine which staff member • comes to work late or leaves early. • Cafeteria personnel can more easily discover which • foods are consumed more or less often, which makes • menu planning easier and more efficient. Using the Data as Quantifiable Backup and to Support Administrative Decisions Sometimes parents make accusations against teachers, other students and administrators, and it’s important to have quantifiable data available to show why decisions are made about a particular student or teacher. This hard data can also be used for state auditing support or in legal actions. Here are a few scenarios where data can help foster a conversation: • A school psychologist can show parents a list of • disciplinary actions given to a particular student over • time, sometimes years of data, which may prompt • additional psychiatric help or IEP support. • A teacher can show how many times a student cut his • or her class and discuss patterns. • An administrator can show how many days a student • cut school. Big Data, Powerful Data, Actionable Data Automated data gathered from ScholarChip’s smart ID cards can help K12 school districts target areas of improvement and increase efficiency by using the data gathered and analyzed to make decisions. The process starts with each student and staff member using their smart ID card for attendance, door access, timeclocks, cafeteria POS, etc., and then it resides in the power of ScholarChip’s plethora of reports. Nurse’s Office, Clubs, After School Events ScholarChip’s SALA (Student Ad-Hoc Location App) is a tablet-based tracking service that allows any staff member to track student ID cards and indicate they are in non-classroom locations like the hallway, nurse’s office, guidance office, or in special interest clubs. Reports generated can show trends of which students go where and for what reason; who is reporting to which club, etc. which helps administrators keep track of out-of-classroom activities. Distributing Reports Administrators routinely submit attendance information to state and federal education offices; with ScholarChip’s automated system, the process is quick, timely, and accurate. When taking attendance by hand, creating reports can be cumbersome and time consuming to run, so it can be very difficult to notice trends over time. Often, school districts look at data in three-month windows, and by that time, a student can already be at risk for losing even more school or dropping out completely. With ScholarChip, one of the most powerful results of automated attendance is early intervention. Because the process is computerized, notifications can be set up so that administrators, guidance counselors, school psychologists and parents can be alerted spontaneously when a student reaches a particular threshold. The data is reported in real time, so trends are reported earlier, action can be taken, and students can be helped more effectively. Automated reporting also makes it easy to distribute information to any decision-maker. For example: • The director of school security could receive door • access information every week, and he can determine • if an entrance should be more closely monitored. • The cafeteria manager can receive inventory reports • to make reordering easier and more efficient. • The nurse can keep track of how often a particular • student comes to her office and can spot trends that • can help discover issues. • The Superintendent of Schools could receive a daily • report on the number of students who are in school, • absent, tardy, or excused so that she can budget state • monies appropriately. Using Data to Increase Operational Efficiencies It can be difficult for administrators to see problematic operational issues, but when quantifiable data is analyzed from different perspectives, it may emphasize root problems that wouldn’t otherwise have been noticed. With ScholarChip’s wide range of real-time reports available at a few clicks of a button, results can help administrators run schools more efficiently and show areas that need improvement. And when new decisions are put into place, the data helps to track success or failure quickly. More importantly, data-driven back end operations can help improve student achievement, increase efficiencies, save time and save money, which benefits district-wide constituents and the community at large. Questions: info@scholarchip.com