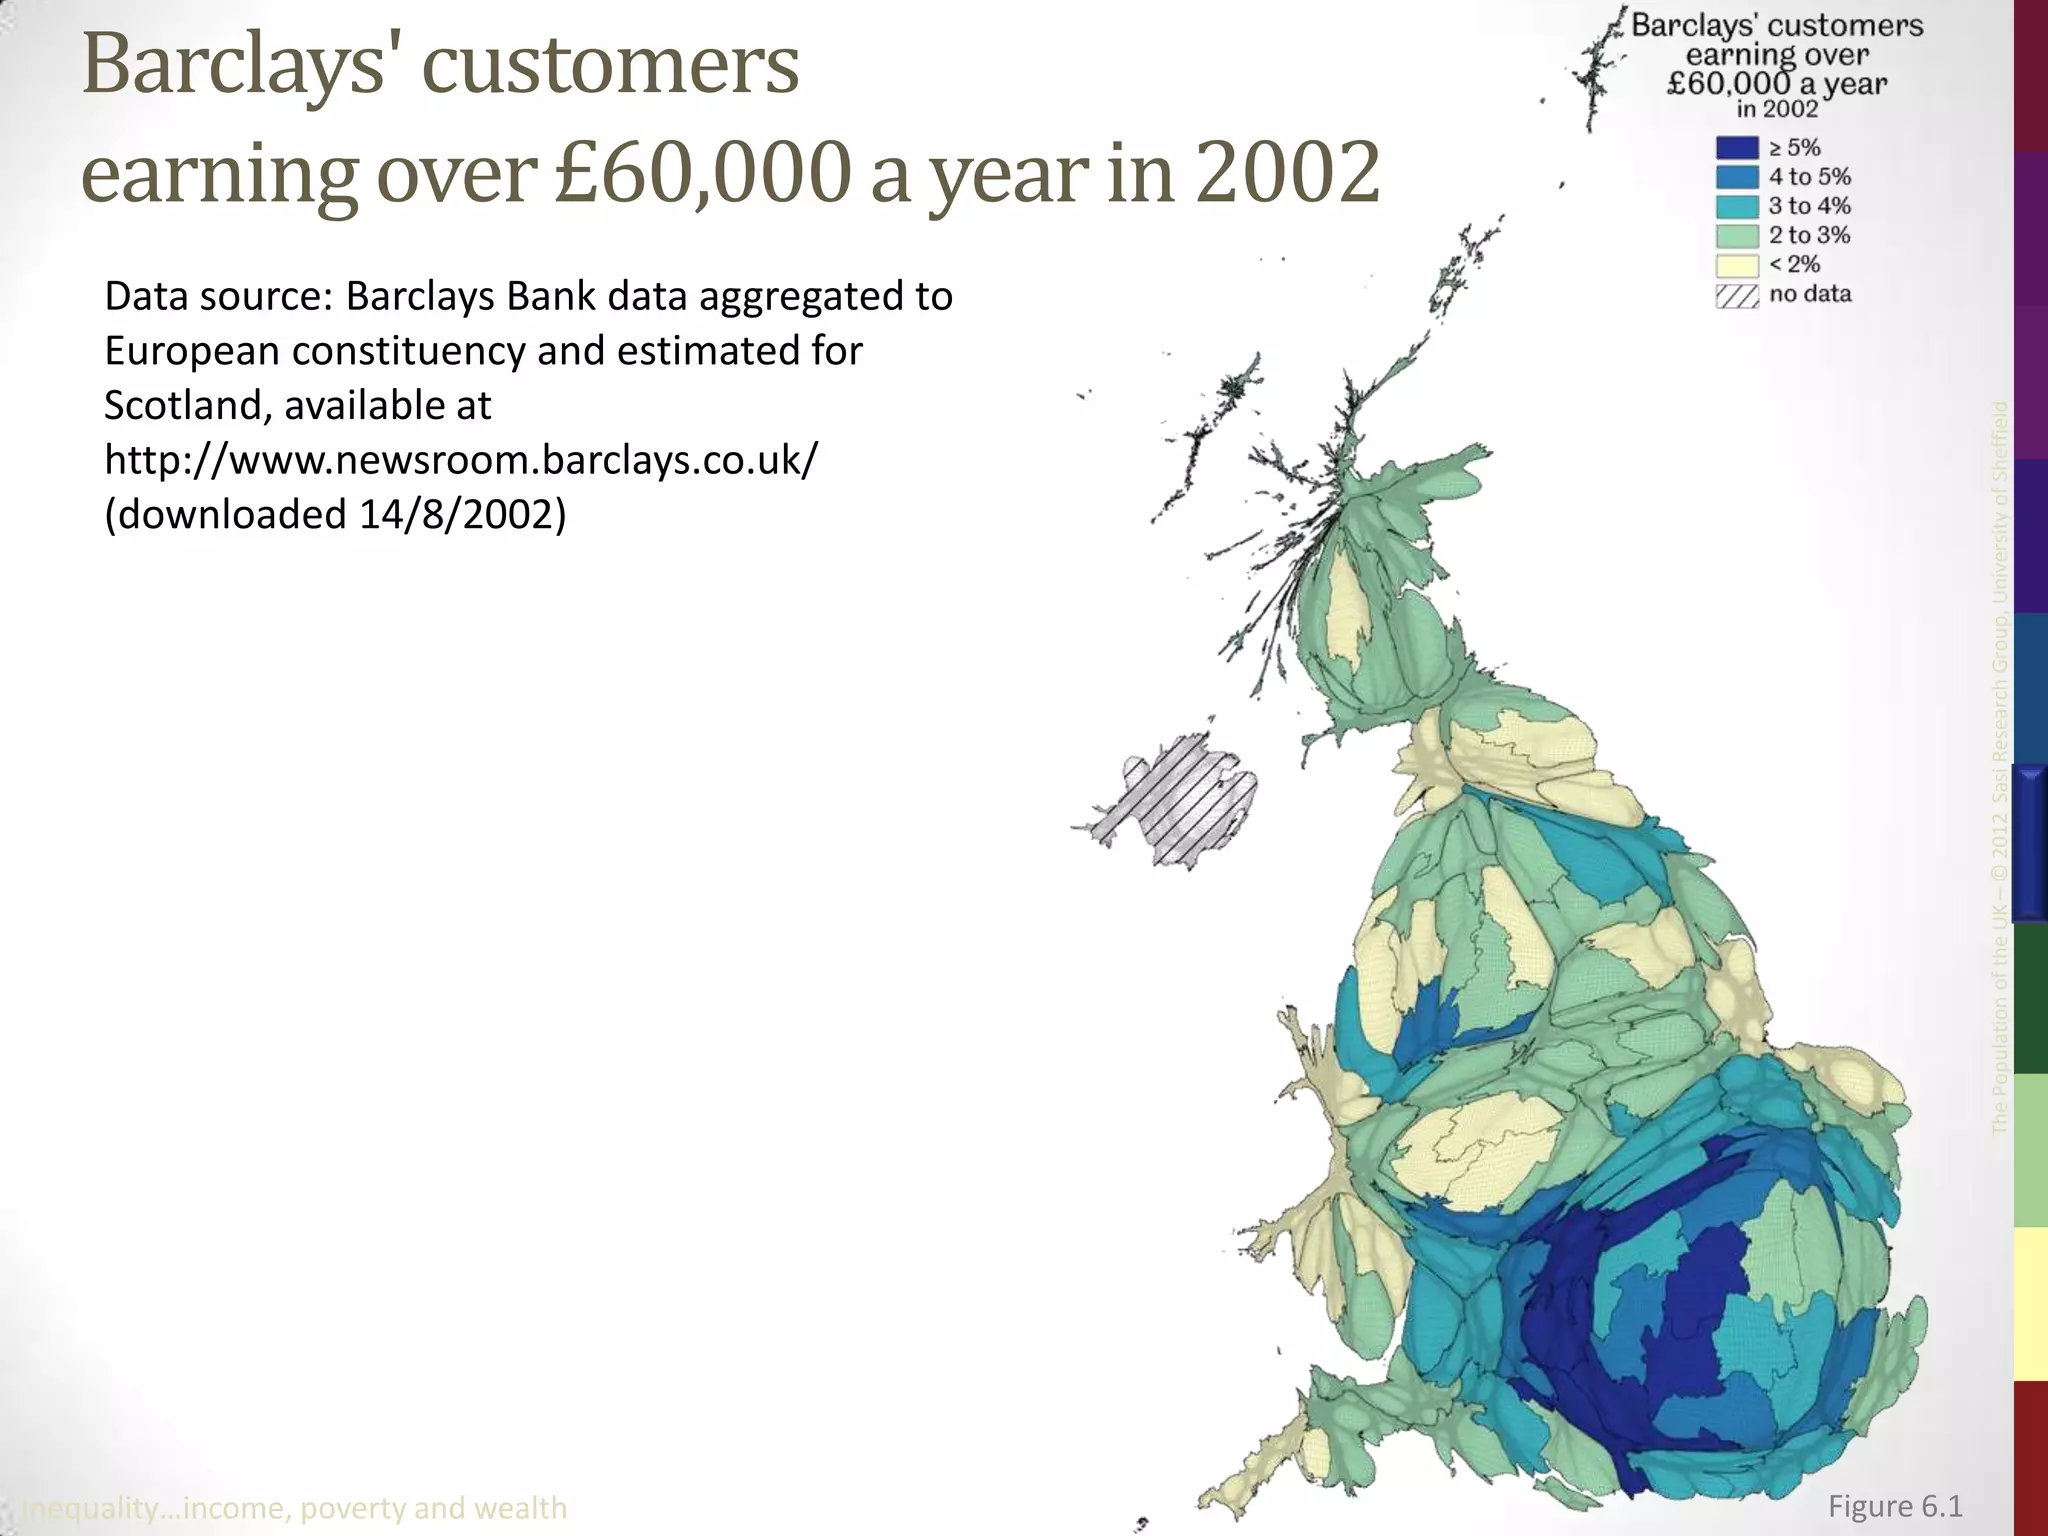
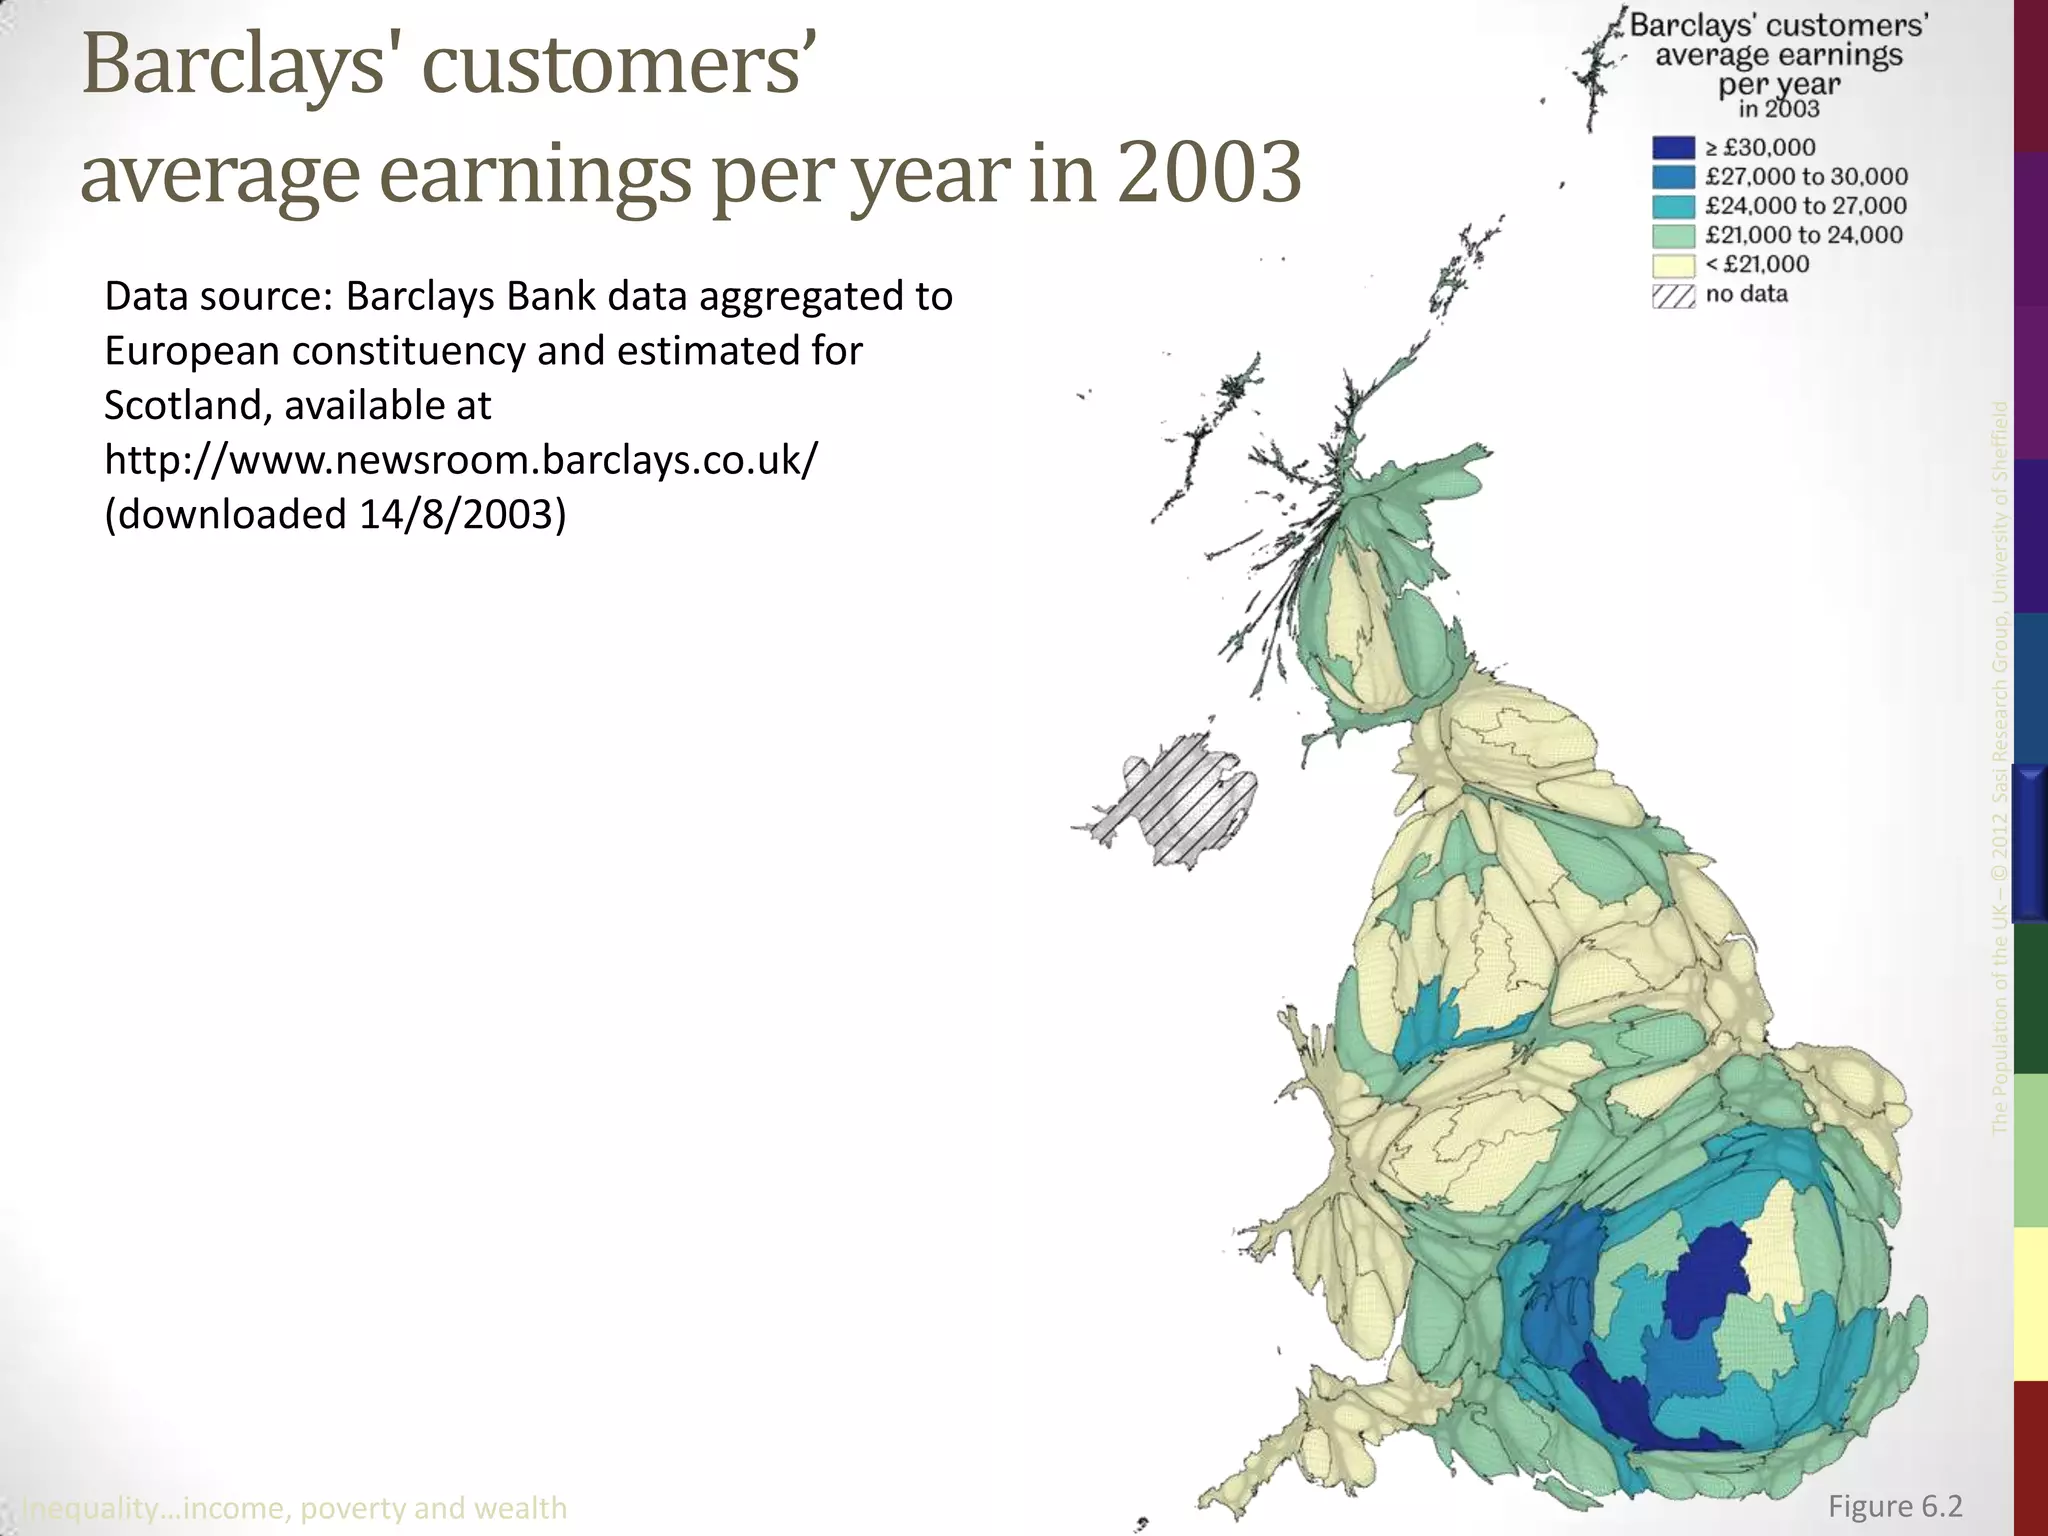
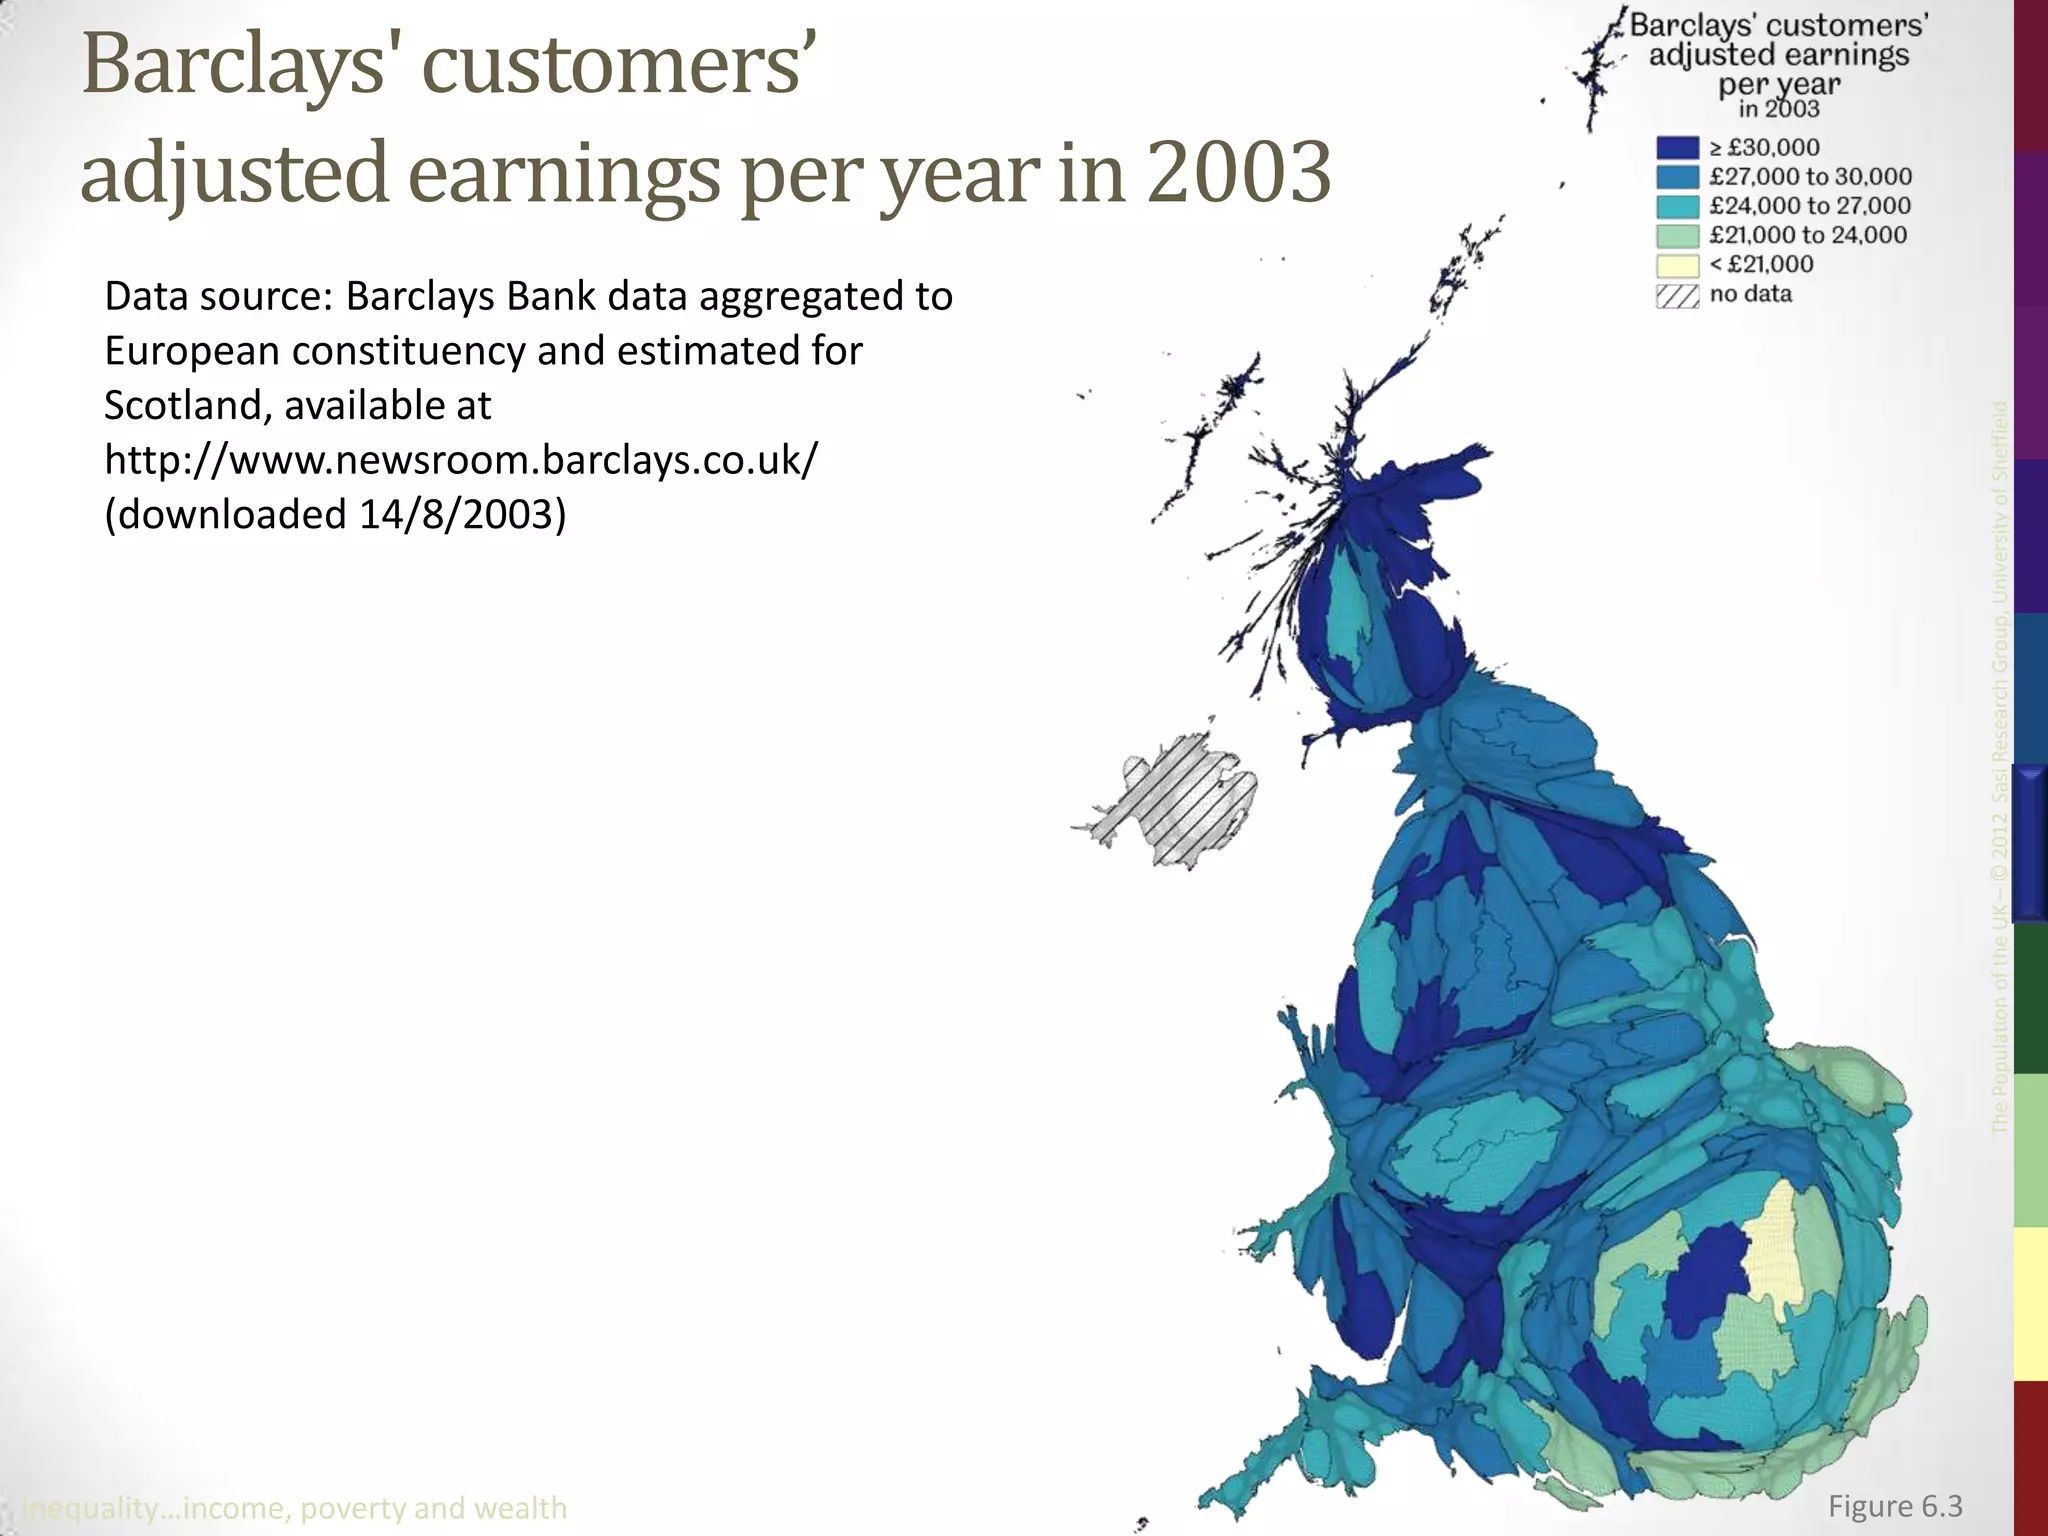
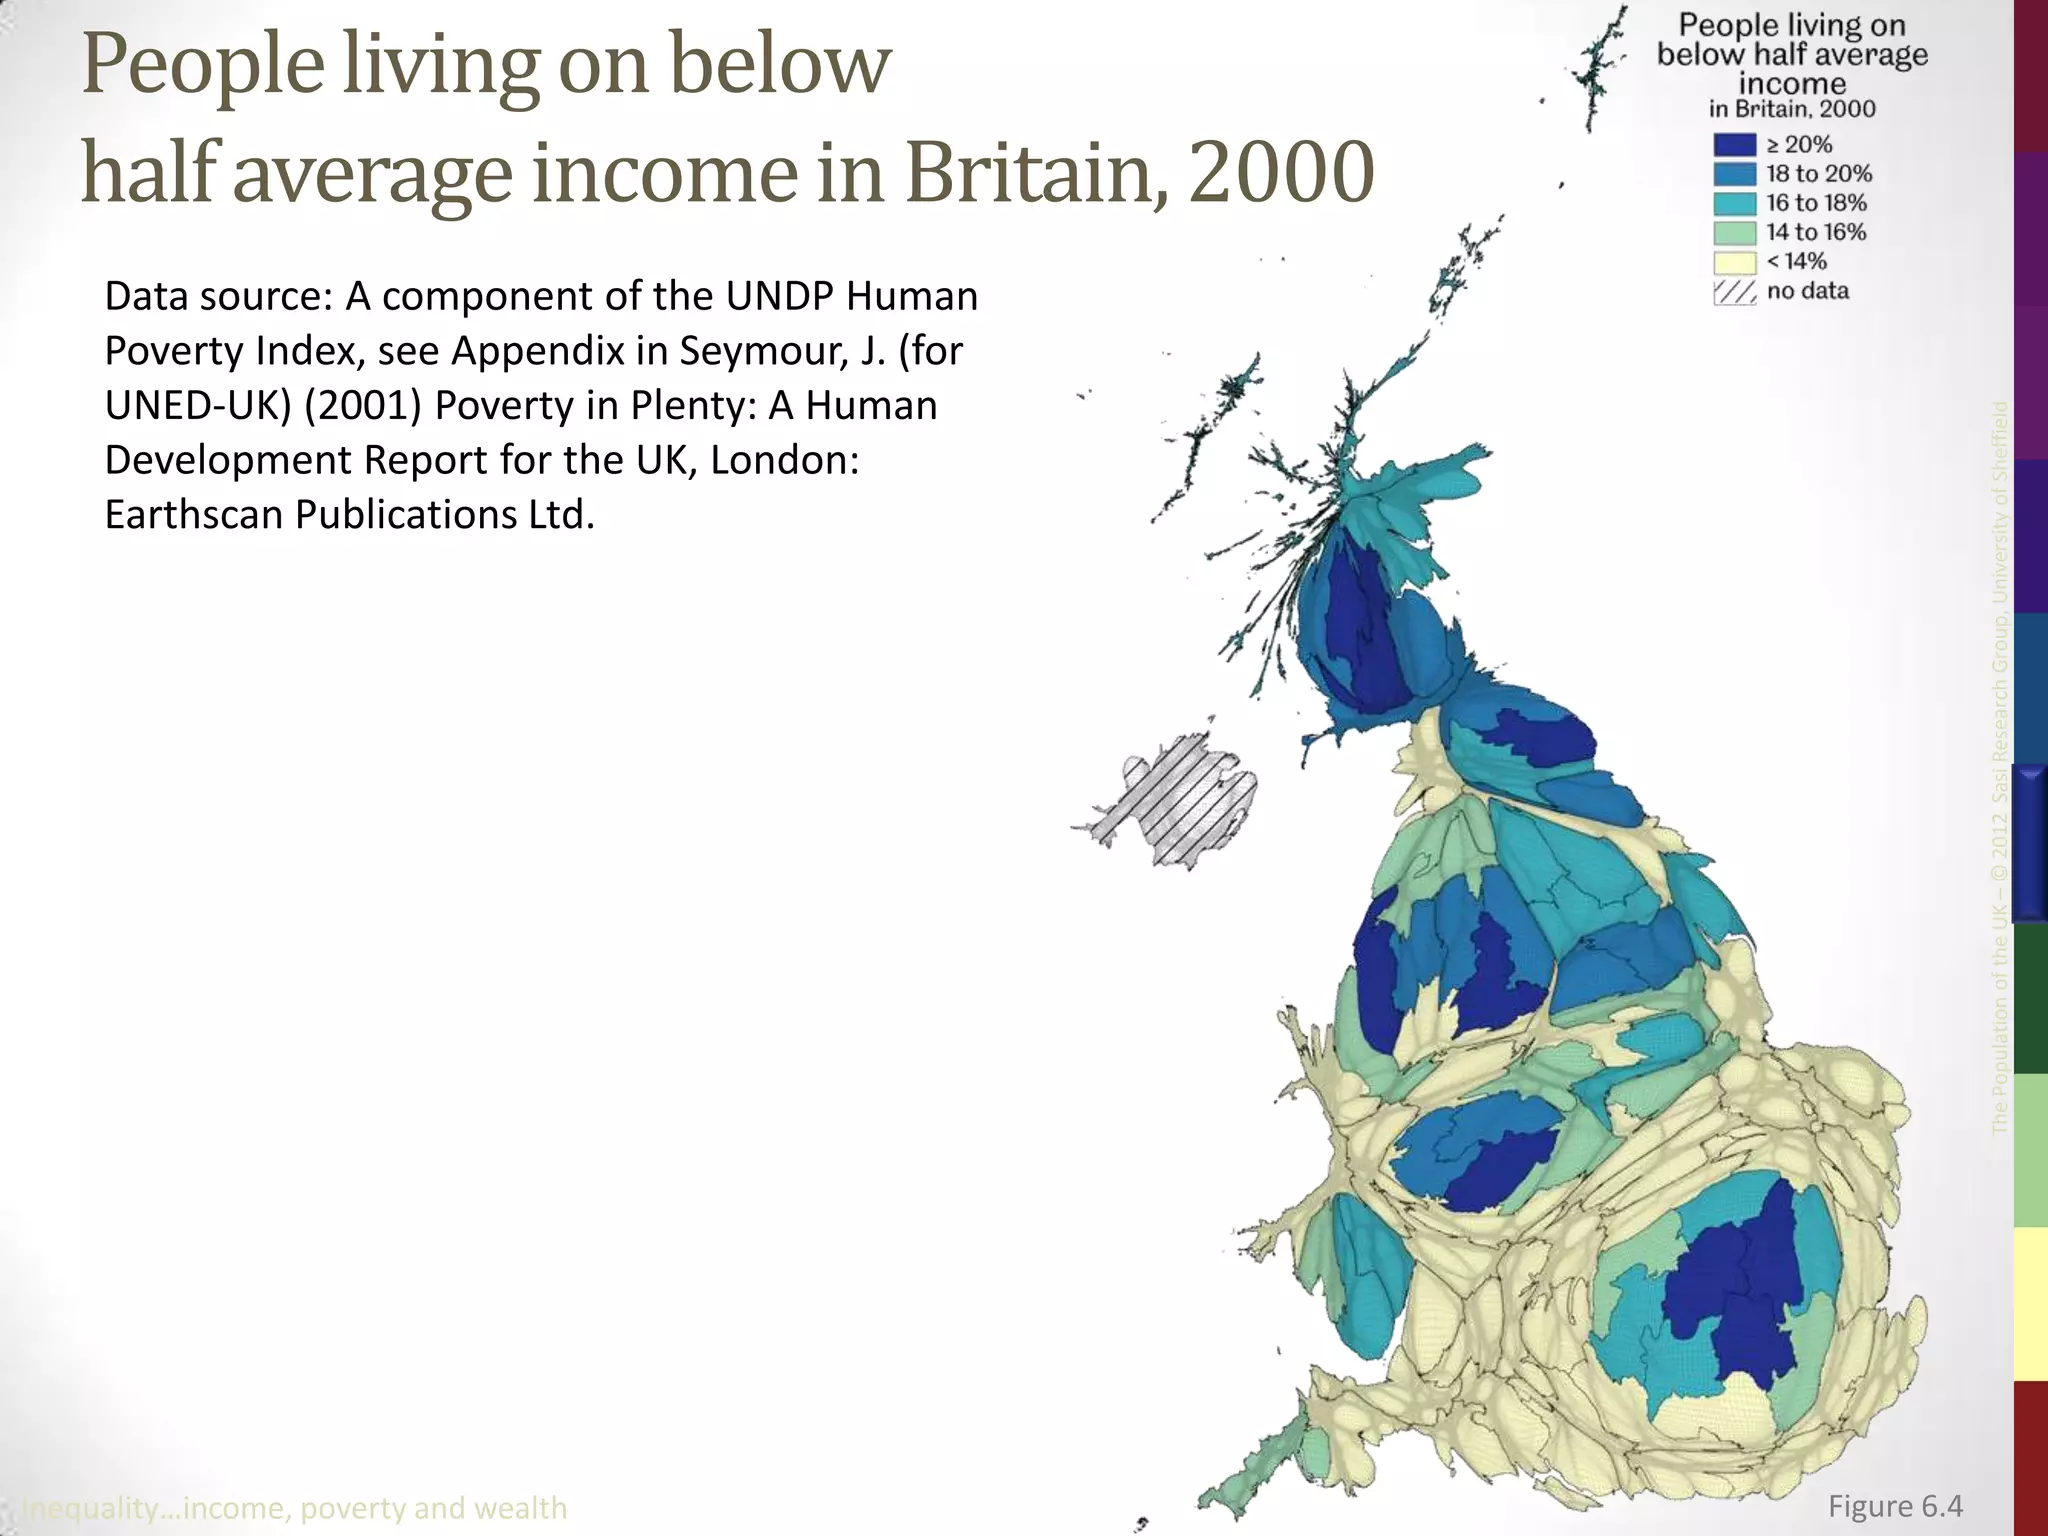
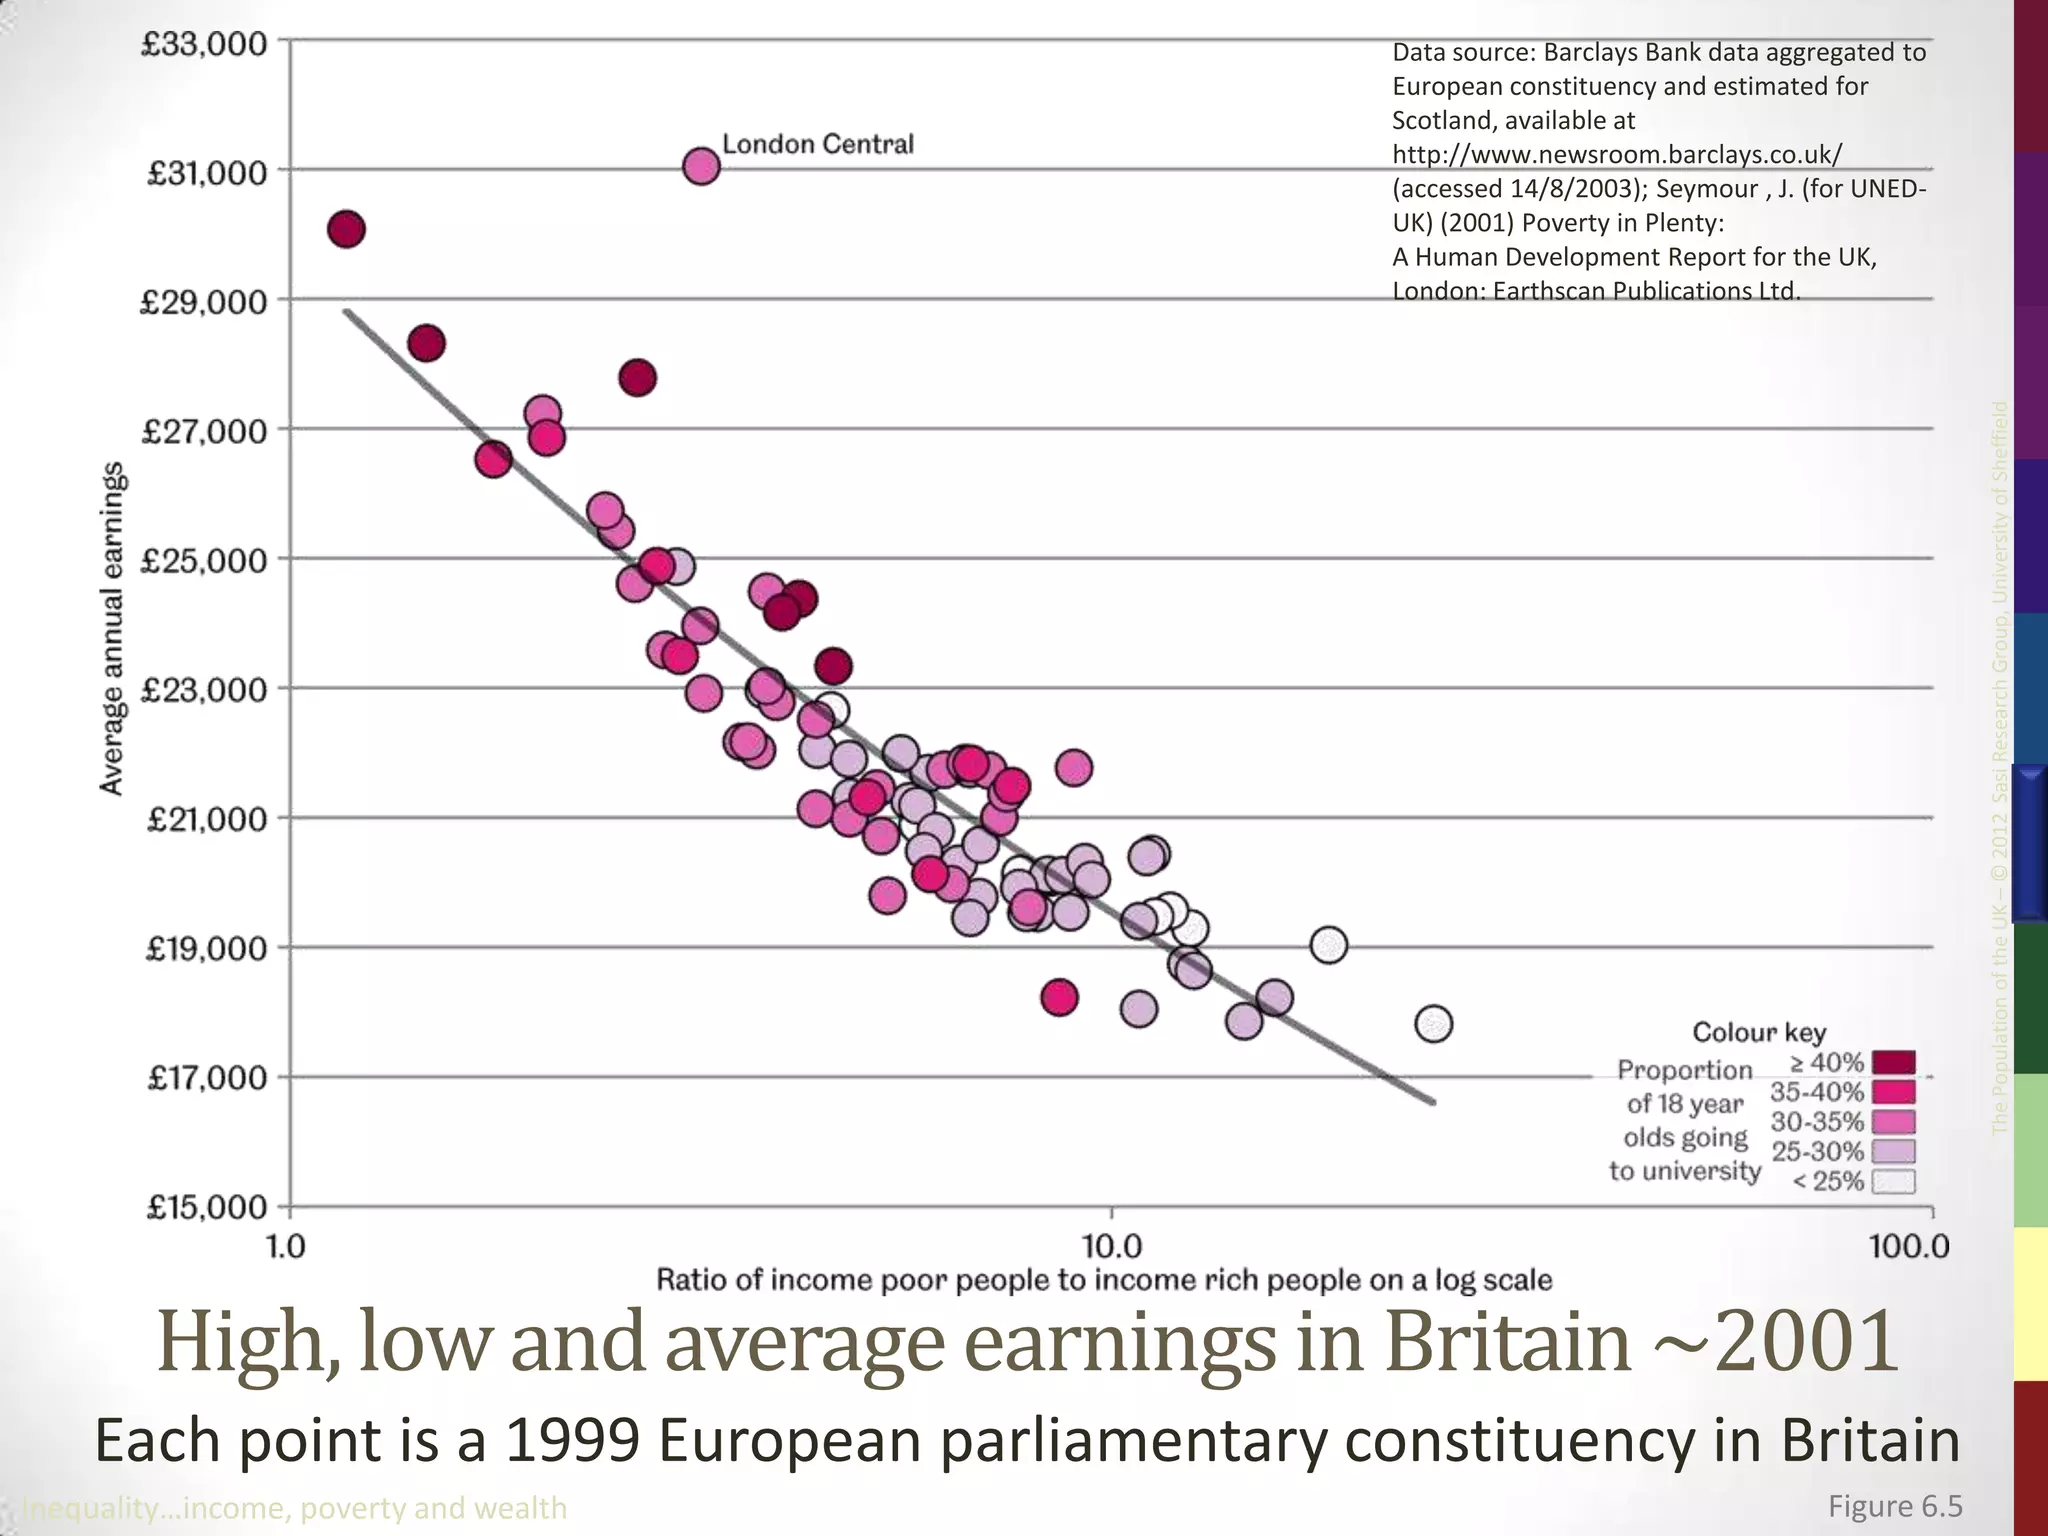
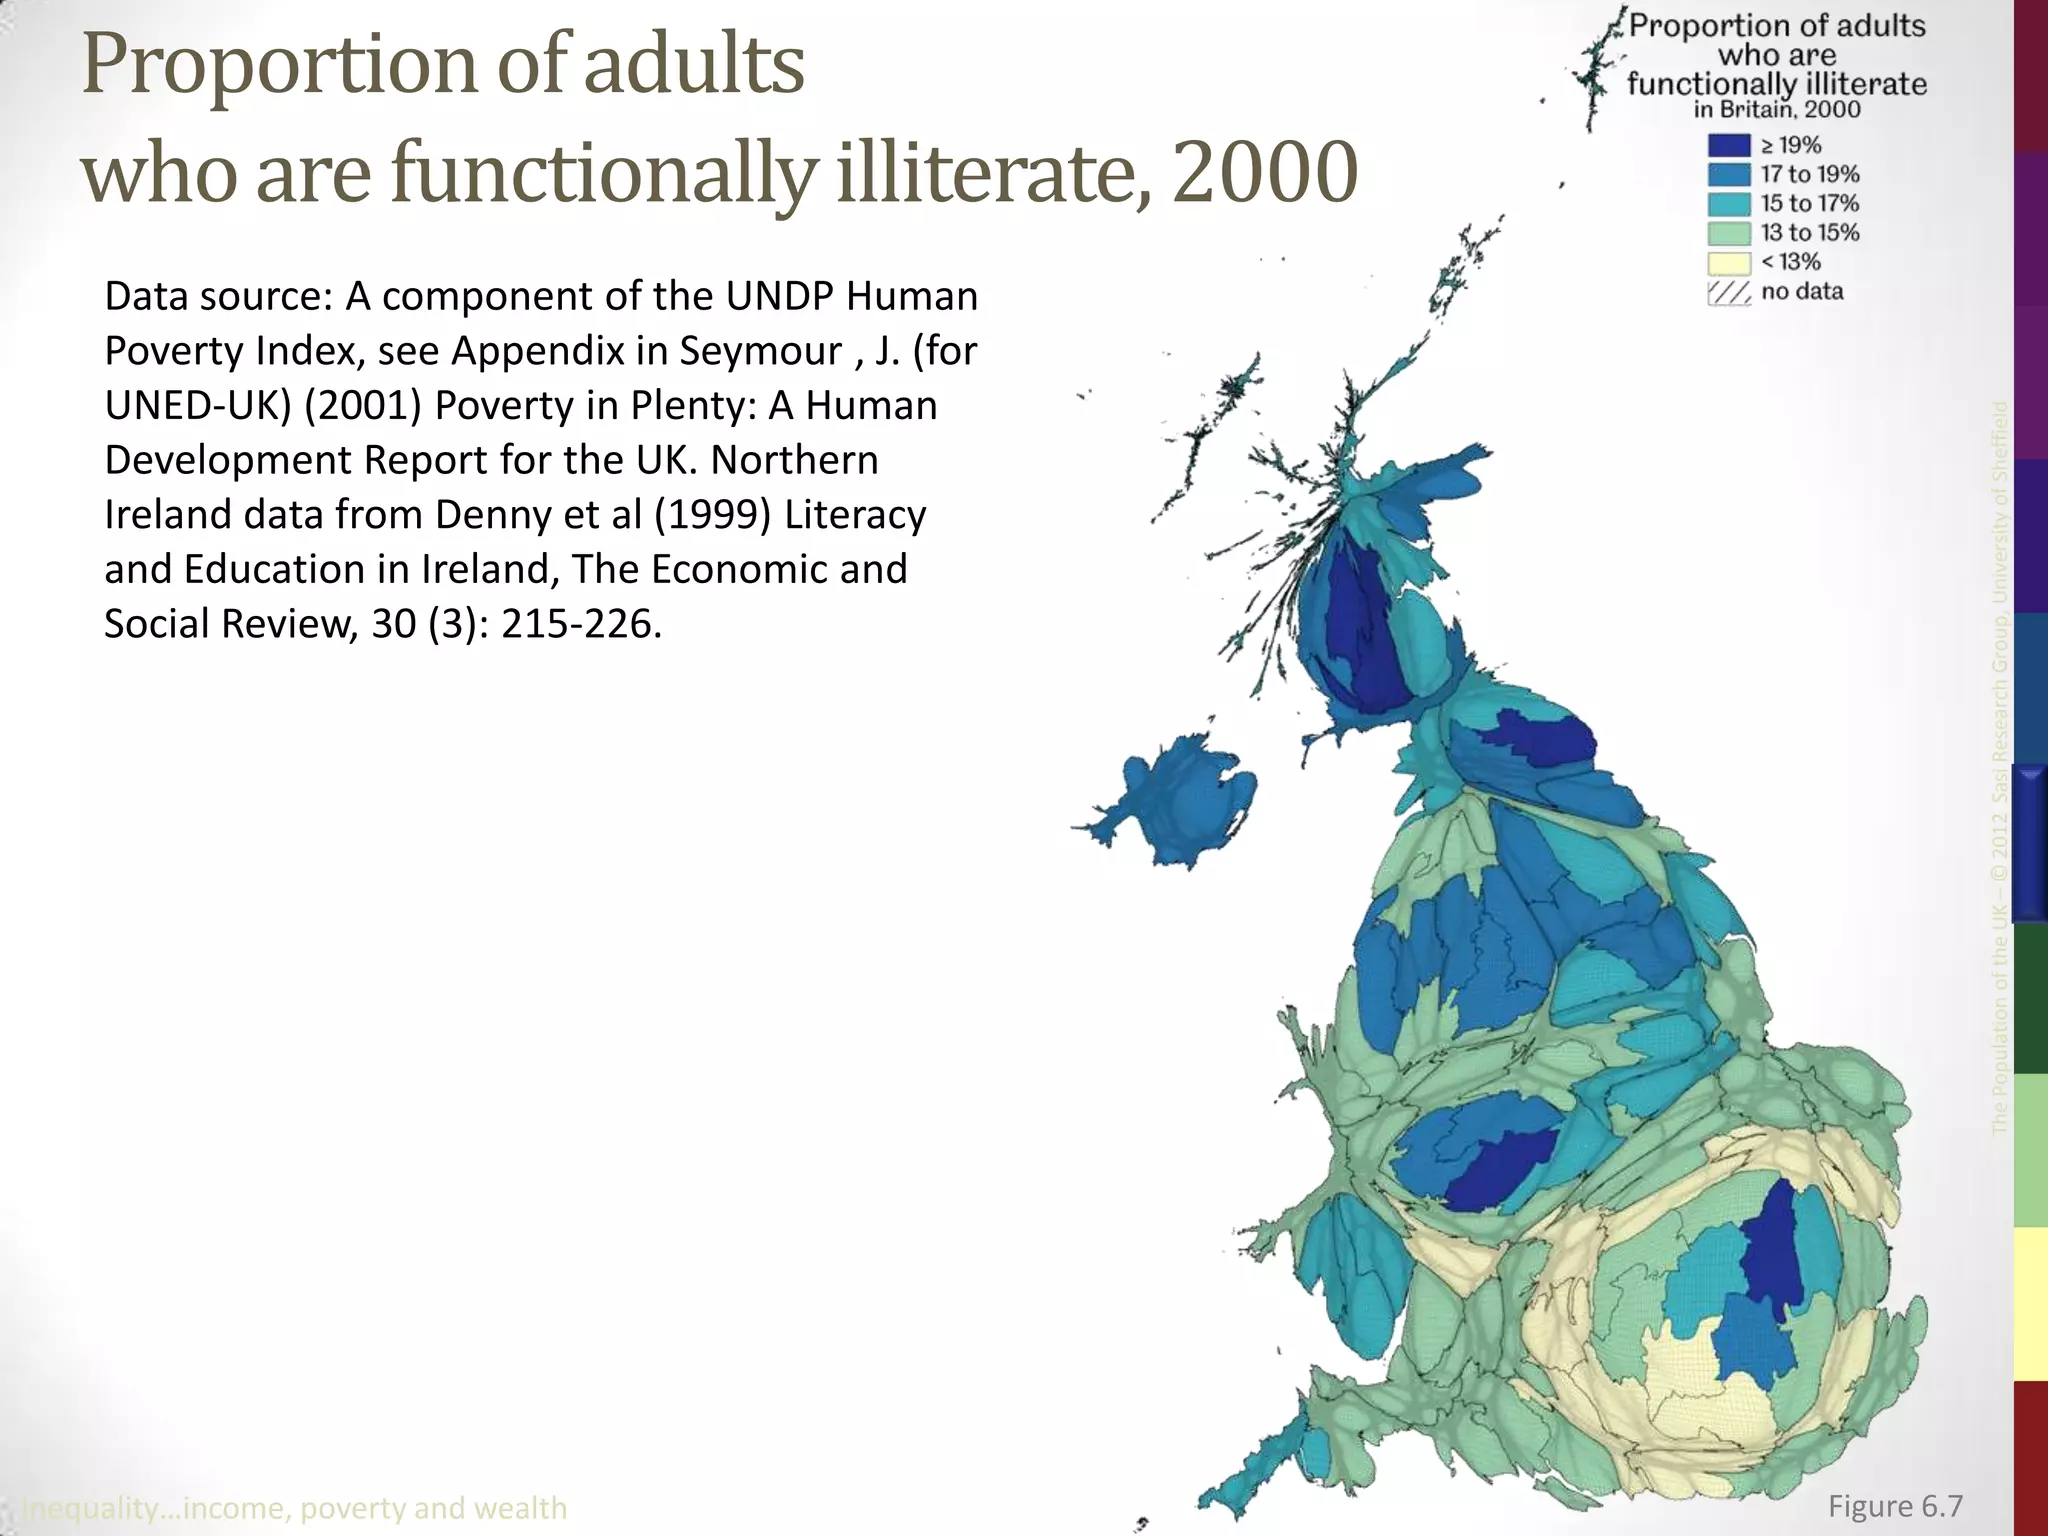
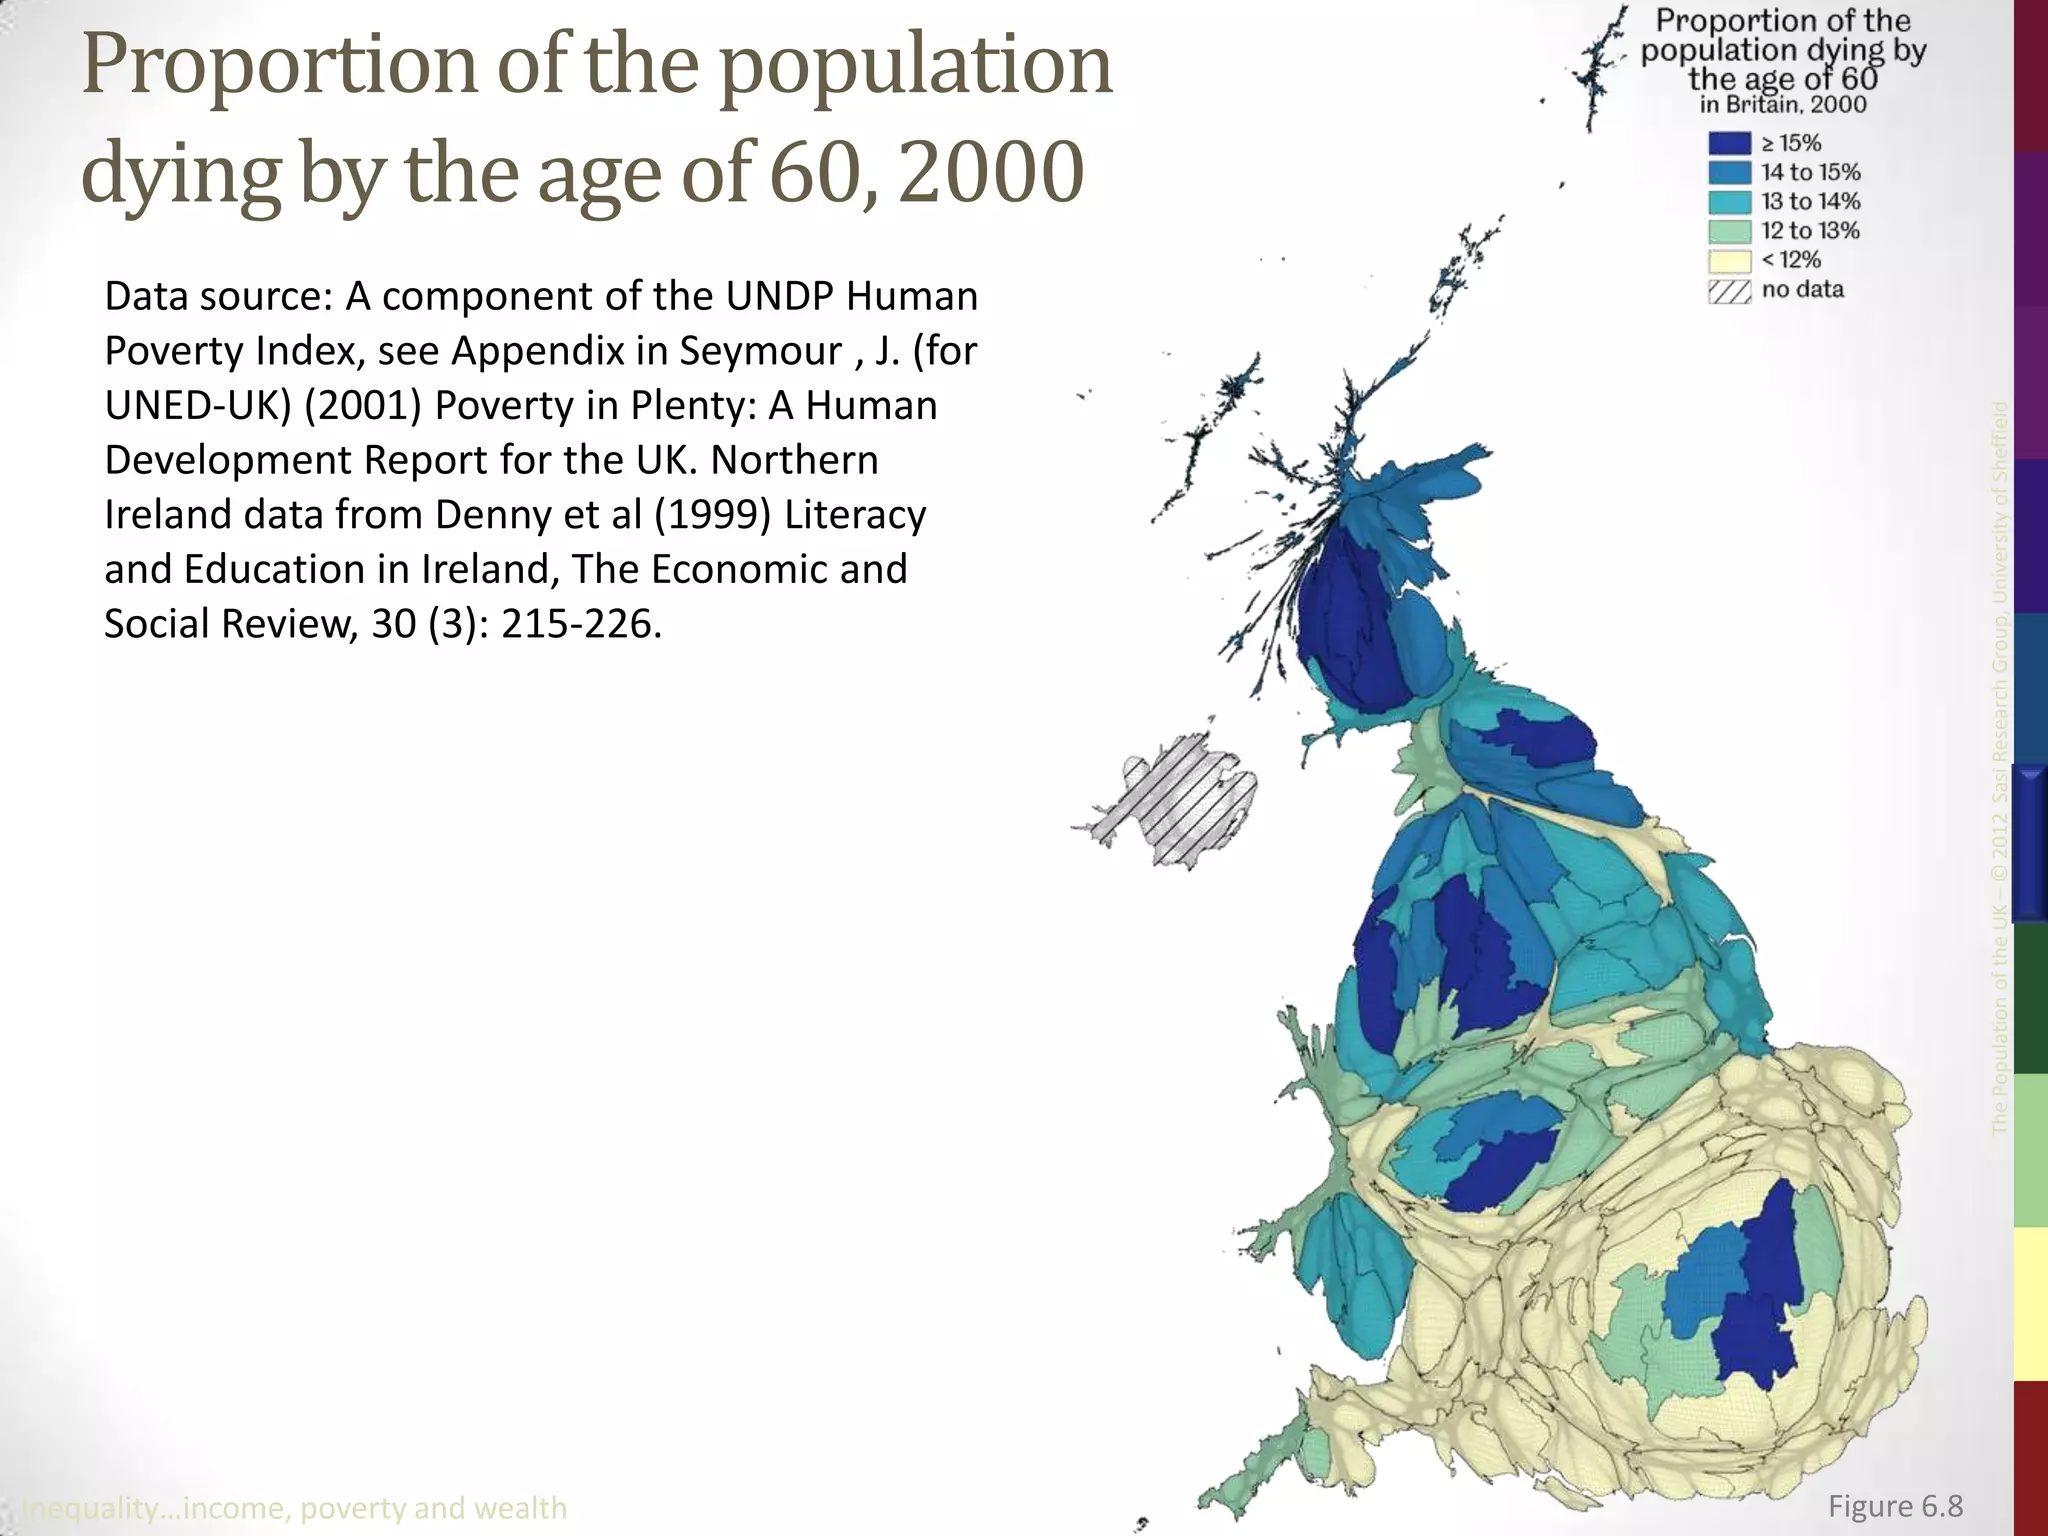
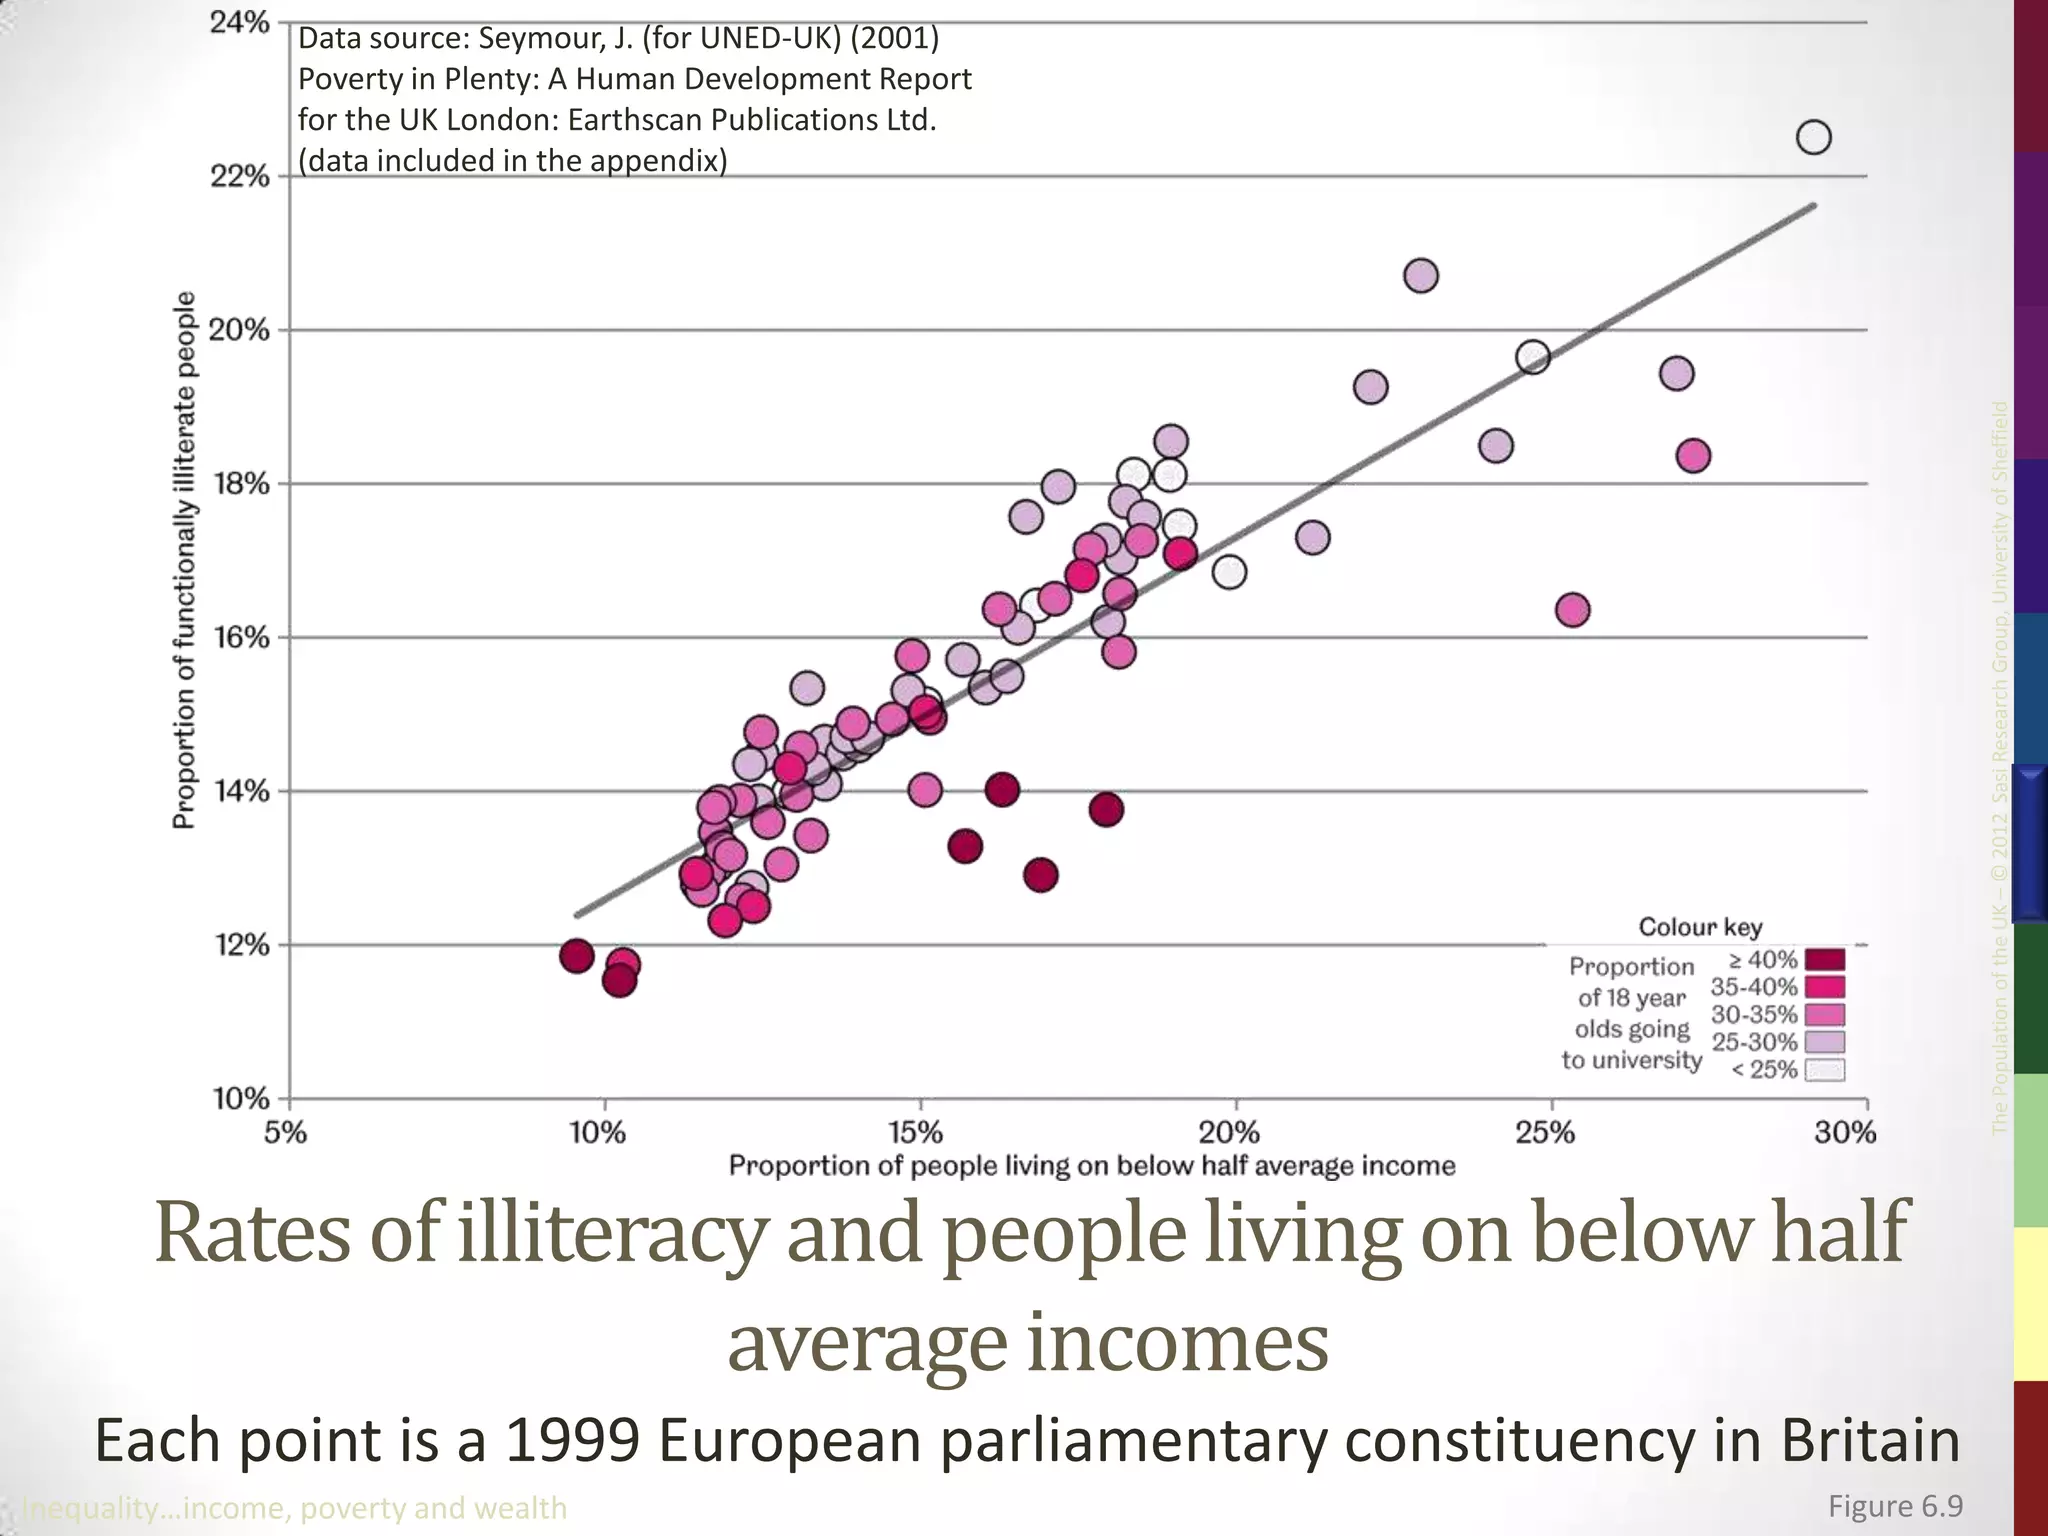
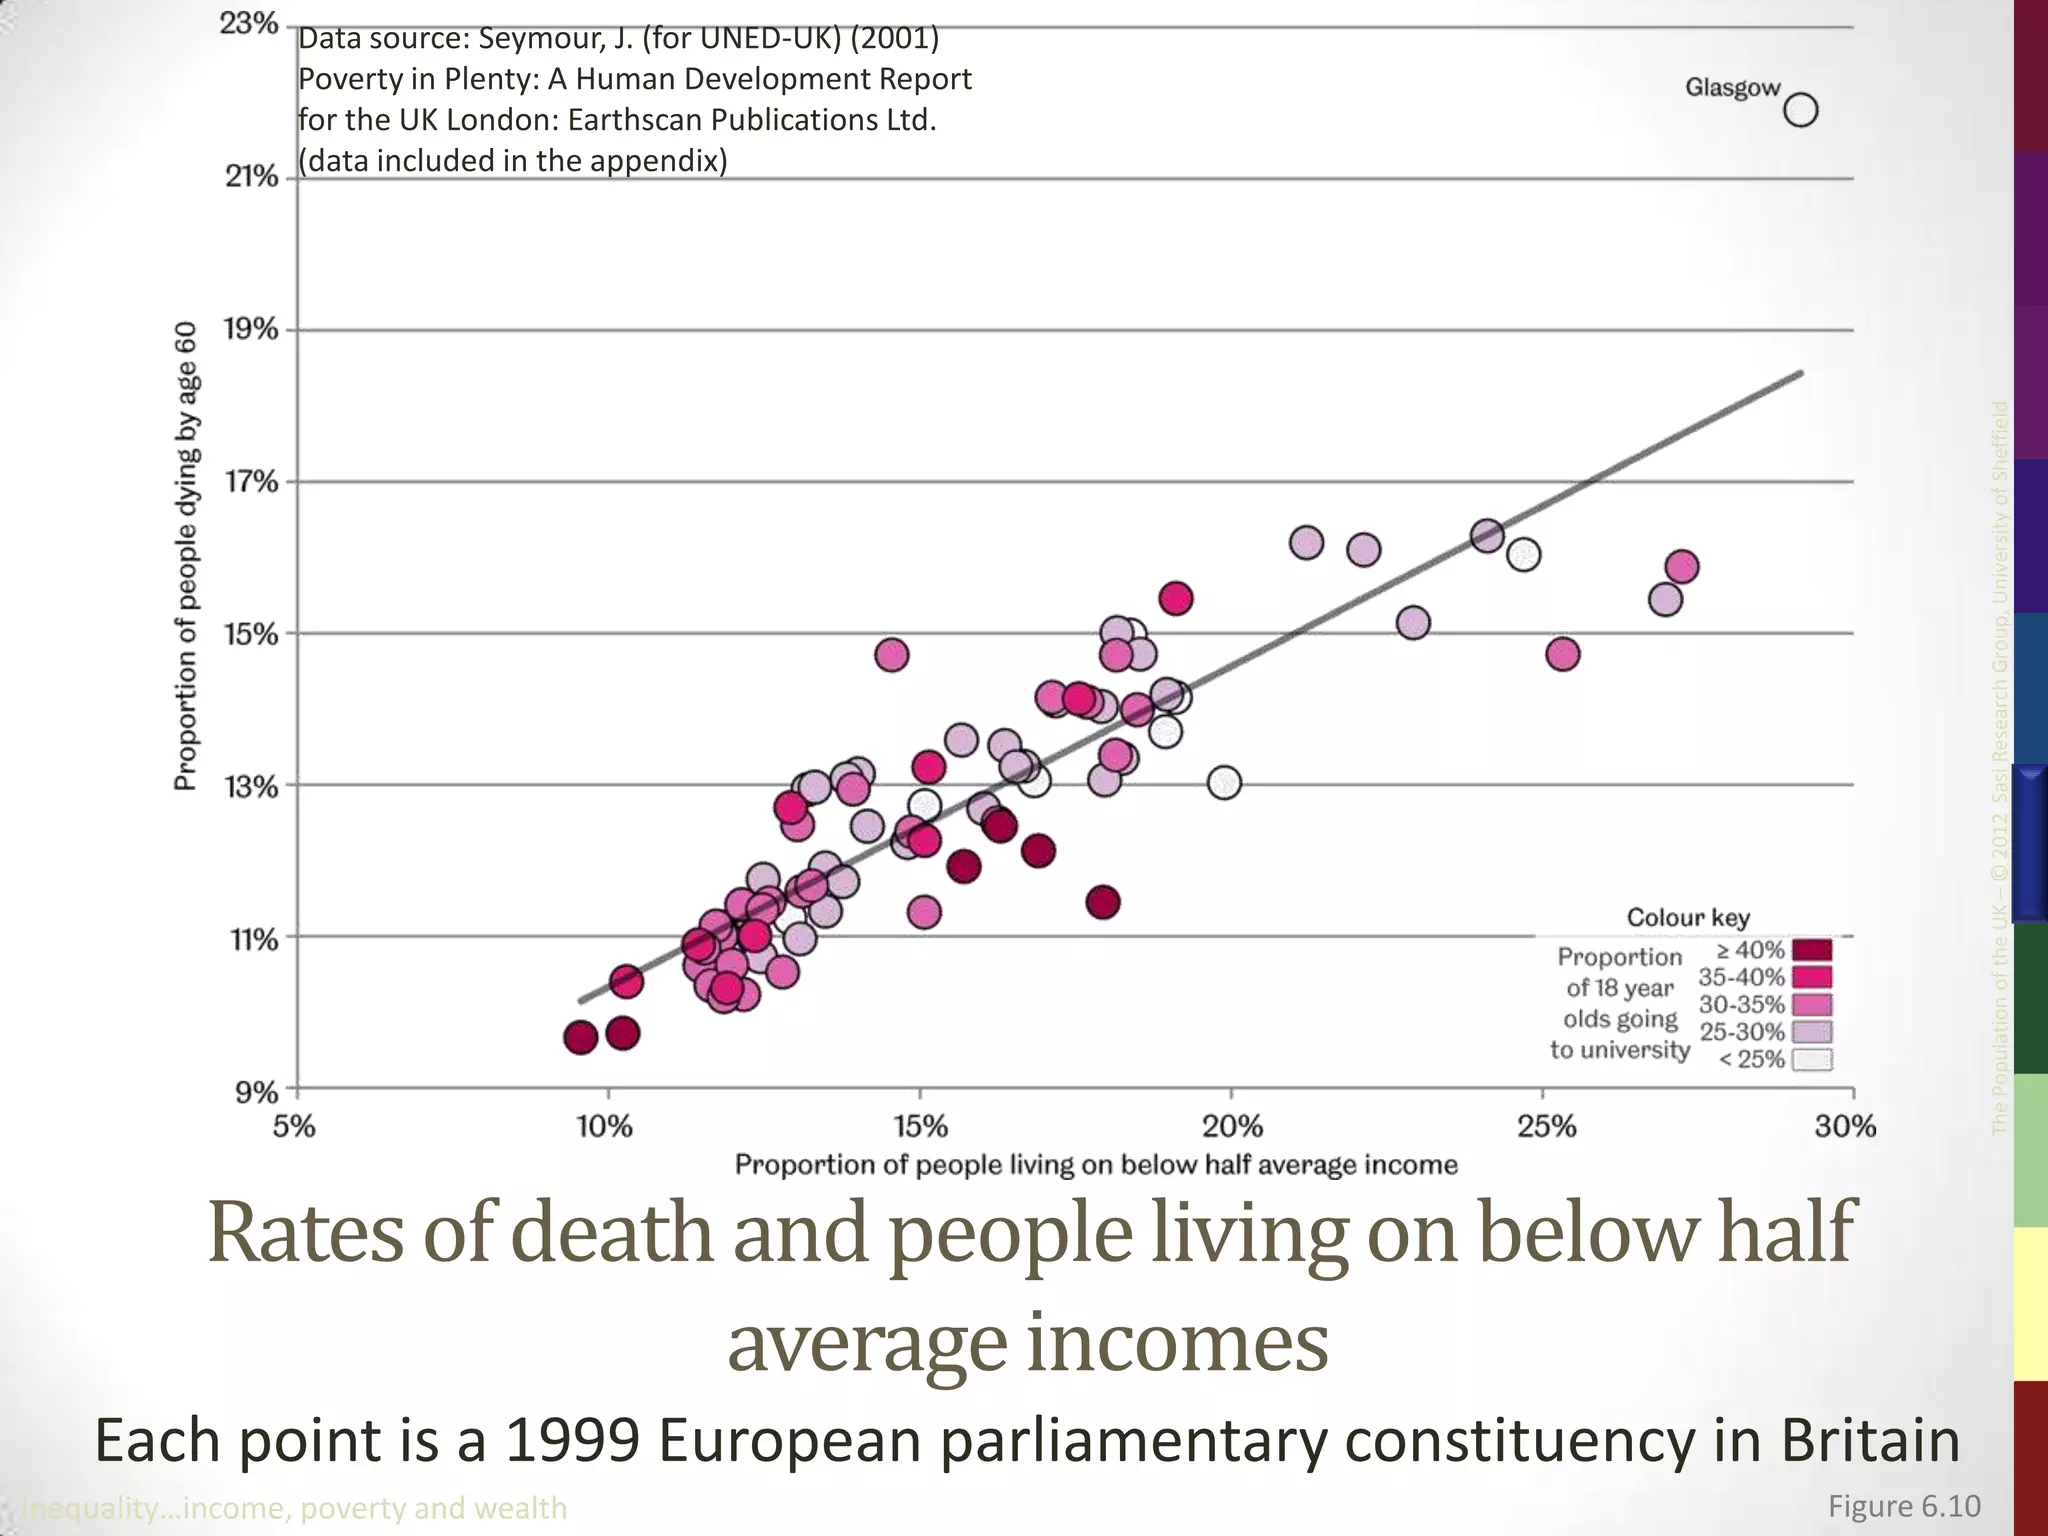
http://www.dannydorling.org/books/ukpopulation


          THE POPULATION


                                                           The Population of the UK – © 2012 Sasi Research Group, University of Sheffield
          OF THE UK
          A different view of life in the United Kingdom
          by Danny Dorling and Benjamin D. Hennig


          Chapter 6

          INEQUALITY
          …INCOME, POVERTY AND WEALTH
Barclays' customers
   earning over £60,000 a year in 2002
     Data source: Barclays Bank data aggregated to
     European constituency and estimated for
     Scotland, available at


                                                                  The Population of the UK – © 2012 Sasi Research Group, University of Sheffield
     http://www.newsroom.barclays.co.uk/
     (downloaded 14/8/2002)


Inequality…income, poverty and wealth                Figure 6.1
Barclays' customers’
   average earnings per year in 2003
     Data source: Barclays Bank data aggregated to
     European constituency and estimated for
     Scotland, available at


                                                                  The Population of the UK – © 2012 Sasi Research Group, University of Sheffield
     http://www.newsroom.barclays.co.uk/
     (downloaded 14/8/2003)


Inequality…income, poverty and wealth                Figure 6.2
Barclays' customers’
   adjusted earnings per year in 2003
     Data source: Barclays Bank data aggregated to
     European constituency and estimated for
     Scotland, available at


                                                                  The Population of the UK – © 2012 Sasi Research Group, University of Sheffield
     http://www.newsroom.barclays.co.uk/
     (downloaded 14/8/2003)


Inequality…income, poverty and wealth                Figure 6.3
People living on below
   half average income in Britain, 2000
     Data source: A component of the UNDP Human
     Poverty Index, see Appendix in Seymour, J. (for
     UNED-UK) (2001) Poverty in Plenty: A Human


                                                                    The Population of the UK – © 2012 Sasi Research Group, University of Sheffield
     Development Report for the UK, London:
     Earthscan Publications Ltd.


Inequality…income, poverty and wealth                  Figure 6.4
Data source: Barclays Bank data aggregated to
                                                  European constituency and estimated for
                                                  Scotland, available at
                                                  http://www.newsroom.barclays.co.uk/
                                                  (accessed 14/8/2003); Seymour , J. (for UNED-
                                                  UK) (2001) Poverty in Plenty:
                                                  A Human Development Report for the UK,
                                                  London: Earthscan Publications Ltd.


                                                                                                   The Population of the UK – © 2012 Sasi Research Group, University of Sheffield
        High, low and average earnings in Britain ~2001
    Each point is a 1999 European parliamentary constituency in Britain
Inequality…income, poverty and wealth                                                 Figure 6.5
Levels of poverty by UN definitions, 2000
     Data source: A component of the UNDP Human
     Poverty Index, see Appendix in Seymour , J. (for
     UNED-UK) (2001) Poverty in Plenty: A Human
     Development Report for the UK, London:
     Earthscan Publications Ltd., Northern Ireland


                                                                     The Population of the UK – © 2012 Sasi Research Group, University of Sheffield
     data from Democratic Dialogue Report 16
     (2003)


Inequality…income, poverty and wealth                   Figure 6.6
Proportion of adults
   who are functionally illiterate, 2000
     Data source: A component of the UNDP Human
     Poverty Index, see Appendix in Seymour , J. (for
     UNED-UK) (2001) Poverty in Plenty: A Human


                                                                     The Population of the UK – © 2012 Sasi Research Group, University of Sheffield
     Development Report for the UK. Northern
     Ireland data from Denny et al (1999) Literacy
     and Education in Ireland, The Economic and
     Social Review, 30 (3): 215-226.


Inequality…income, poverty and wealth                   Figure 6.7
Proportion of the population
   dying by the age of 60, 2000
     Data source: A component of the UNDP Human
     Poverty Index, see Appendix in Seymour , J. (for
     UNED-UK) (2001) Poverty in Plenty: A Human


                                                                     The Population of the UK – © 2012 Sasi Research Group, University of Sheffield
     Development Report for the UK. Northern
     Ireland data from Denny et al (1999) Literacy
     and Education in Ireland, The Economic and
     Social Review, 30 (3): 215-226.


Inequality…income, poverty and wealth                   Figure 6.8
Data source: Seymour, J. (for UNED-UK) (2001)
                  Poverty in Plenty: A Human Development Report
                  for the UK London: Earthscan Publications Ltd.
                  (data included in the appendix)


                                                                                The Population of the UK – © 2012 Sasi Research Group, University of Sheffield
        Rates of illiteracy and people living on below half
                          average incomes
    Each point is a 1999 European parliamentary constituency in Britain
Inequality…income, poverty and wealth                              Figure 6.9
Data source: Seymour, J. (for UNED-UK) (2001)
                  Poverty in Plenty: A Human Development Report
                  for the UK London: Earthscan Publications Ltd.
                  (data included in the appendix)


                                                                                 The Population of the UK – © 2012 Sasi Research Group, University of Sheffield
            Rates of death and people living on below half
                           average incomes
    Each point is a 1999 European parliamentary constituency in Britain
Inequality…income, poverty and wealth                              Figure 6.10
Key Point Summary
     •           Measured in large areas the share of high earners varies
                 seven-fold, between 8.2% and 1.2%


                                                                              The Population of the UK – © 2012 Sasi Research Group, University of Sheffield
     •           The proportion in poverty is as high as 42%, and as low as
                 18%, between the same areas

     •           Literacy, numeracy and mortality distributions all closely
                 follow these distributions


Inequality…income, poverty and wealth

The Population of the UK, Chapter 6

  • 1.
    http://www.dannydorling.org/books/ukpopulation THE POPULATION The Population of the UK – © 2012 Sasi Research Group, University of Sheffield OF THE UK A different view of life in the United Kingdom by Danny Dorling and Benjamin D. Hennig Chapter 6 INEQUALITY …INCOME, POVERTY AND WEALTH
  • 2.
    Barclays' customers earning over £60,000 a year in 2002 Data source: Barclays Bank data aggregated to European constituency and estimated for Scotland, available at The Population of the UK – © 2012 Sasi Research Group, University of Sheffield http://www.newsroom.barclays.co.uk/ (downloaded 14/8/2002) Inequality…income, poverty and wealth Figure 6.1
  • 3.
    Barclays' customers’ average earnings per year in 2003 Data source: Barclays Bank data aggregated to European constituency and estimated for Scotland, available at The Population of the UK – © 2012 Sasi Research Group, University of Sheffield http://www.newsroom.barclays.co.uk/ (downloaded 14/8/2003) Inequality…income, poverty and wealth Figure 6.2
  • 4.
    Barclays' customers’ adjusted earnings per year in 2003 Data source: Barclays Bank data aggregated to European constituency and estimated for Scotland, available at The Population of the UK – © 2012 Sasi Research Group, University of Sheffield http://www.newsroom.barclays.co.uk/ (downloaded 14/8/2003) Inequality…income, poverty and wealth Figure 6.3
  • 5.
    People living onbelow half average income in Britain, 2000 Data source: A component of the UNDP Human Poverty Index, see Appendix in Seymour, J. (for UNED-UK) (2001) Poverty in Plenty: A Human The Population of the UK – © 2012 Sasi Research Group, University of Sheffield Development Report for the UK, London: Earthscan Publications Ltd. Inequality…income, poverty and wealth Figure 6.4
  • 6.
    Data source: BarclaysBank data aggregated to European constituency and estimated for Scotland, available at http://www.newsroom.barclays.co.uk/ (accessed 14/8/2003); Seymour , J. (for UNED- UK) (2001) Poverty in Plenty: A Human Development Report for the UK, London: Earthscan Publications Ltd. The Population of the UK – © 2012 Sasi Research Group, University of Sheffield High, low and average earnings in Britain ~2001 Each point is a 1999 European parliamentary constituency in Britain Inequality…income, poverty and wealth Figure 6.5
  • 7.
    Levels of povertyby UN definitions, 2000 Data source: A component of the UNDP Human Poverty Index, see Appendix in Seymour , J. (for UNED-UK) (2001) Poverty in Plenty: A Human Development Report for the UK, London: Earthscan Publications Ltd., Northern Ireland The Population of the UK – © 2012 Sasi Research Group, University of Sheffield data from Democratic Dialogue Report 16 (2003) Inequality…income, poverty and wealth Figure 6.6
  • 8.
    Proportion of adults who are functionally illiterate, 2000 Data source: A component of the UNDP Human Poverty Index, see Appendix in Seymour , J. (for UNED-UK) (2001) Poverty in Plenty: A Human The Population of the UK – © 2012 Sasi Research Group, University of Sheffield Development Report for the UK. Northern Ireland data from Denny et al (1999) Literacy and Education in Ireland, The Economic and Social Review, 30 (3): 215-226. Inequality…income, poverty and wealth Figure 6.7
  • 9.
    Proportion of thepopulation dying by the age of 60, 2000 Data source: A component of the UNDP Human Poverty Index, see Appendix in Seymour , J. (for UNED-UK) (2001) Poverty in Plenty: A Human The Population of the UK – © 2012 Sasi Research Group, University of Sheffield Development Report for the UK. Northern Ireland data from Denny et al (1999) Literacy and Education in Ireland, The Economic and Social Review, 30 (3): 215-226. Inequality…income, poverty and wealth Figure 6.8
  • 10.
    Data source: Seymour,J. (for UNED-UK) (2001) Poverty in Plenty: A Human Development Report for the UK London: Earthscan Publications Ltd. (data included in the appendix) The Population of the UK – © 2012 Sasi Research Group, University of Sheffield Rates of illiteracy and people living on below half average incomes Each point is a 1999 European parliamentary constituency in Britain Inequality…income, poverty and wealth Figure 6.9
  • 11.
    Data source: Seymour,J. (for UNED-UK) (2001) Poverty in Plenty: A Human Development Report for the UK London: Earthscan Publications Ltd. (data included in the appendix) The Population of the UK – © 2012 Sasi Research Group, University of Sheffield Rates of death and people living on below half average incomes Each point is a 1999 European parliamentary constituency in Britain Inequality…income, poverty and wealth Figure 6.10
  • 12.
    Key Point Summary • Measured in large areas the share of high earners varies seven-fold, between 8.2% and 1.2% The Population of the UK – © 2012 Sasi Research Group, University of Sheffield • The proportion in poverty is as high as 42%, and as low as 18%, between the same areas • Literacy, numeracy and mortality distributions all closely follow these distributions Inequality…income, poverty and wealth