Download to read offline


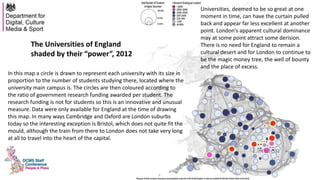
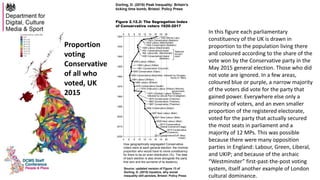
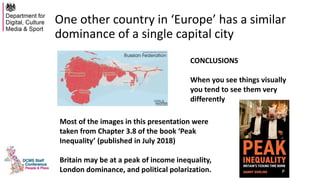

The keynote by Danny Dorling at the 2018 annual awayday discusses the changing landscape of cultural geography in the UK, highlighting the disparities in arts funding and the concentration of wealth in London. It emphasizes how visual representations, such as maps, can reveal hidden patterns of inequality and cultural dominance in society. The document also critiques the historical and current political landscape, particularly focusing on the dominance of the Conservative Party and the geographical segregation of its voters.


