1) The document describes the design, assembly, and commissioning of a muon telescope for imaging large structures using cosmic muons.
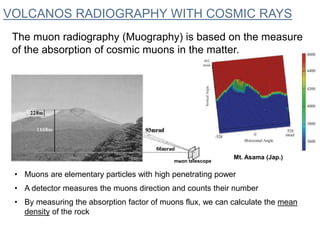
2) Key requirements for muonography include a rugged modular design, large detection area, high angular resolution, fast electronics, and high background rejection.
3) The MU-Ray telescope meets these requirements with 3 planes of plastic scintillator strips read out by silicon photomultipliers, achieving ~8 mrad angular resolution and 1 ns time resolution.
4) Commissioning tests validated the telescope's performance, and campaigns imaged Vesuvius volcano and Puy de Dome.
Tra Trieste e Nova Gorica per lo studio dei fenomeni ultraveloci / Between Trieste and Nova Gorica for the study of ultra-fast phenomena - by Cesare Grazioli
First results from the full-scale prototype for the Fluorescence detector Arr...Toshihiro FUJII
The Fluorescence detector Array of Single-pixel Telescopes (FAST) is a design concept for the next generation of ultrahigh-energy cosmic ray (UHECR) observatories, addressing the requirements for a large-area, low-cost detector suitable for measuring the properties of the highest energy cosmic rays. In the FAST design, a large field of view is covered by a few pixels at the focal plane of a mirror or Fresnel lens. Motivated by the successful detection of UHECRs using a prototype comprised of a single 200 mm photomultiplier-tube and a 1 m2 Fresnel lens system [Astropart.Phys. 74 (2016) 64-72], we have developed a new full-scale prototype consisting of four 200 mm photomultiplier-tubes at the focus of a segmented mirror of 1.6 m in diameter. In October 2016 we installed the full-scale prototype at the Telescope Array site in central Utah, USA, and began steady data taking. We report on first results of the full-scale FAST prototype, including measurements of artificial light sources, distant ultraviolet lasers, and UHECRs.
35th International Cosmic Ray Conference — ICRC2017 18th July, 2017
Bexco, Busan, Korea
This article is based on the IEEE standards and is a basic research oriented article. It describes the basic working principle of the Sun photometer and the measurement of Solar Radiation with a very high precision rate. It is specially used by scientists to analyze the irradiance of Photons from a light source.
El objetivo es lograr una mayor libertad y rapidez en el trabajo y en el hogar, adaptando la telemática a una de las mas arraigadas características del ser humano: el dinamismo.
Scanning Tunneling Microscopy and UHV Scanning Tunneling MicroscopyRamkumar Niluroutu
This presentation gives the details of STM's history, working process, modes of operations and explanation of various components. UHV STM details also included in this presentation of its working process.
OES is the reference analysis technique for elemental analysis of solid metallic samples . that uses the light emitted of an excited element and (PMT) convert the light in an electrical signal. that can be read by the instrument computer and the software
1. INNER IMAGING OF LARGE STRUCTURES
USING COSMIC MUONS:
Design, Assembly and Commissioning of a Muon Telescope
Novel Technologies for Materials, Sensors and Imaging
XXVI Cycle
UNIVERSITA’ DEGLI STUDI DI NAPOLI
FEDERICO II
Ph. D. Candidate :
Luigi Cimmino
Tutors :
Dr. Giulio Saracino
Dr. Giuseppe Osteria
May 6th, 2014 - Napoli
2. VOLCANOS RADIOGRAPHY WITH COSMIC RAYS
muon telescope
Mt. Asama (Jap.)
The muon radiography (Muography) is based on the measure
of the absorption of cosmic muons in the matter.
• Muons are elementary particles with high penetrating power
• A detector measures the muons direction and counts their number
• By measuring the absorption factor of muons flux, we can calculate the mean
density of the rock
3. Eruption dynamics mostly depend on
• the gas content
• the composition of the magma
• the conduit dimensions and shape.
Seismic,
gravimetric,
electromag.
methods:
Several km
Muon radiography:
few hundreds m
Traditional measurement methods :
• gravimetric,
• seismological and
• electromagnetic
resolutions of the order of several hundred
meters.
Muon radiography can improve resolutions
by one order of magnitude.
MOTIVATIONS
4. STATE OF ART IN MUOGRAPHY
• The first application was realized in 1971 by Alvarez and collaborators for the
search of unknown burial chambers in the Chephren pyramid.
• Since year 2000 Japanese researchers have applied the methodology to
radiograph the mount l’Asama, the Satsuma Iwo-jima and the lava dome of
mount Usu. They used both electronic detectors and nuclear emulsions.
• Emulsions allow for best resolution and don’t need power supply, but they are
very sensitive to environment and can be used for short period of time.
Moreover, the data reconstruction is very hard and it can not furnish real-time
information
Mt.Asama-2003(Jap.)
Mt.Asama-2007(Jap.)
5. REQUIREMENTS FOR MUOGRAPHY
• Rugged and modular structure designed for easy installation
and use in volcanic environment
• Large area assembly capability
• Tracking of muon trajectory
• High angular resolution
• Fast electronics
• High background rejection
• Muon’s Time of Flight (TOF)
• Third plane
• High planes segmentation
m
X1
Y1
X2
Y2
Third Plane
6. fake m from ‘albedo’
m
The measure of the Time of
Flight of the muons let us able
to reject tracks coming from
albedo mimicking good trakcs
BACKGROUND REJECTION
7. fake m from ‘shower’
m
The third plane is used
to reject events that
are not aligned
BACKGROUND REJECTION
8. JapanesedetectoratVesuvius(2010)
• In Europe, the TOMUVOL collaboration
and the DIAPHANE experiment are
currently working, respectively, on muon
radiography of the Puy de Dome near
Clermont Ferrand and of the Grande
Soufrière in Guadaloupe.
STATE OF ART IN DETECTOR FOR MUOGRAPHY
o Japanese : Scintillator bars + Photomultiplier Tubes (PMT)
(6 planes, 168 channels)
o DIAPHANE : Scintillator bars with WLS Fibers + Multianode PMTs
(3 planes, 96 channels, TOF capability, descend from OPERA experiment)
o TOMUVOL : Resistive Plate Chamber, gas detector
(4 planes, 10k channels, descend from ATLAS experiment)
o MURAY : Scintillator bars with WLS Fibers + Silicon Photomultipliers (SiPM)
(3 planes, 384 channels, TOF implemented, brand new detector)
9. THE MU-RAY TELESCOPE
• Formed by 3 planes
• 1 m2 sensitive area
• ≈ 8 mrad angular resolution
• 1 ns time resolution
• Few tens of Watts power consumption
Performance
• Plastic scintillator with triangular shape
• WLS Fibers
• Silicon Photomultipliers
• Fast Front-end Electronics
Features
10. SCINTILLATORS FEATURES
Triangular plastic scintillator bars (D0-Minerva)
• Robust
• Fast
• Cheap
• Allow for spatial resolution
• When an ionizing particle hits the bar, a
certain amount of light is released and
must be transmitted to the photon
detectors.
• WLS Fibers collect and transmit the light
to the Silicon photomultipliers
• To optimize the light collection an optical
glue can be used to couple the fiber with
the scintillator.
11. Different type of
transparent epoxy
glues tested.
Several problems
encounterd and
solved:
- Cracks
- Bubbles
- Shrinking
FIBER - SCINTILLATOR COUPLING
• Optimization of the optical
coupling
• Definition of a procedure to
prepare glue
Goals:
12. In order to thermostat photon detectors, we
decided to arrange 32 Silicon
photomultipliers on a single board.
We choose to design an optical connector to
put forward photon detectors against fibers,
so that it collects 32 fibers
OPTICAL COUPLING REQUIREMENTS
• Fiber Internal total reflection
angle: 21.4°
• output angle: 35.7°
• max displacement: 220mm
1,4 mm
13. 1. Setup the Test Facility
2. Organizing photo for image analysis
CONNECTOR QUALITY CHECK3.Imageanalysis
With the software Gwyddion we measured:
• Holes diameter
• Alignment
• Fibers placement
We have found :
• All holes are aligned with statistical error
of order 0.5%
• All holes are spaced within statistical
error of order 2%
Digital microscope
16. SIPM TEMPERATURE DEPENDENCE
Silicon photomultipliers are sensitive to single photon,
based on avalanche silicon photodiodes that works in
Geiger mode and arranged in arrays of them.
The gain, and the photon detection efficiency (PDE) in
single photon counting regime, is proportional to the
overvoltage.
Dark counts have rates from 100 kHz up to several
MHz per mm2 at 25 °C.
VBD = f(T)
G (VBias – VBD)
VBD / T ≈ 50mV/°C
28.50
29.00
29.50
30.00
30.50
31.00
31.50
32.00
0 5 10 15 20 25 30 35
T (°C)
Vbd (V)
Voltage (V)
Current (A)
18. Copper vias improve thermal conductivity between cold plate and inner plate
below SiPM
SiPM pads
HYBRID DESIGN FOR THERMAL CONDUCTIVITY
Thermal plate
Hybrid back view
19. 19
20
21
22
23
24
25
26
0.2 0.3 0.4 0.5 0.6 0.7 0.8 0.9 1
T_dx
T_sx
T_cntr
TA
Room Temperature
T (°C)
Current (A)
18
19
20
21
22
23
24
25
11:38 11:45 11:52 12:00 12:07 12:14 12:21 12:28 12:36 12:43 12:50
T_dx
T_sx
T_cntr
TA
Room Temperature
Time (hh:mm)
T (°C)
UNIFORMITY IN SIPM CONDITIONING
20. Probe arrangement on the Hybrid board (bottom
view) and is disposition inside the polystyrene’s
brick insulator (top view hidden).
The top is coupled with the aluminium passive
cooling system through a wafer made of
conductive gum and a copper’s buffer .
Three Peltier Cells was emploied
during the experiment each one
located respectively at
¼, ½ and ¾ of the lenght L of the
cooper buffer. We arranged a serie
circuit with the cells.
T_sx
•
•
T_cntr T_dx
T_ms T_md
H
TEST TO CHECK HYBRID TEMPERATURE UNIFORMITY
21. 0.0
1.0
2.0
3.0
4.0
5.0
6.0
7.0
8.0
9.0
0.0 0.5 1.0 1.5 2.0 2.5
TENVIRONMENT - TEXP (°C)
Electric power (W)
PELTIER BASED CONDITIONING SYSTEM
• Based on Peltier cells
• Reduction of power consumption
• Designed to minimize internal
temperature variations due to external
changes
• Dedicated control for each PCB
• Sets temperature condition for all
housed SiPMs at the same time
• Works with passive cooling
• Could be supplied by solar cells system
22. FRONT-END ELECTRONICS
Low power consumption
Application-Specific Integrated
Circuit SPIROC
Each slave board is programmed
and read by the FPGA controller
assembled on the master board
12 slave boards are controlled
by a single master board
Data flows are managed by a PIC
micro controller that links the
telescope electronics to the PC
through an USB connection
A monitoring board reads each
couple of PT1000 thermosensors
mounted on the SiPMs board
Room conditions are constantly
monitored with a thermo-
hygrometer connected to the PC
PC
Slow
Control
Master
Board
Slave
Board
32 x
SiPMs
Slave
Board
32 x
SiPMs
Slave
Board
32 x
SiPMs
…
…
23. Raspberry Pi
Data Base
(MySQL)
Sensors
Raw data
storage
Data
Power Supplies
Environment
DATA ACQUISITION AND REMOTE CONTROL
Master Board
Read
Voltages
Setup
Voltages Applying
Settings
24. Data Analysis
Remote Alarm Website
USE OF THE DATABASE AND RAW DATA
computer
Linux OS
DB
Data Quality
ONLINE OFFLINE
25. COMMISSIONING OF THE TELESCOPE
• Study of accidental coincidences
• 95% trigger efficiency per plane including acceptance
• Good correspondence between the angular distibution of muons (black in the chart)
and the expected one (red)
• Precise calibration and working point determination
Zenit angle (rad)
27. MURAY AUTOMATIC REMOTE SYSTEM
• Improvement of remote control software (automatic mail delivery service in case
of warnings and errors)
• Realization of an automated system for the telescope operations
• Test of Voltage Follower Data Acquisition without the chiller
1. The PC is a Raspberry
Pi minicomputer
(few watts consumption)
2. SiPMs temperature is
controlled using Arduino
boards
(10 bits DAC – 0.15°C
sensibility)
3. Power supplies are
controlled remotely
(no handling required)
28. ELECTRONICS UPGRADE • PIC Board has been replaced by a pin-to-
pin connection with the Raspberry Pi
GPIO
• Allow for an interrupt based protocol
• Low level management of the
communication
• Increase of the data transmission
bandwidth
• Reduction of the dead times
• Each slave board has a Switching
Power Supply
BEFORE
AFTER
PC
PIC
Micro
controller
MASTER Board
Raspberry PI
29. Mu-Ray from June to
December 2013
in collaboration with
TOMUVOL to compare
techniques.
CAMPAIGN AT THE PUY DE DOME (FR)
31. HOW TO MEASURE THE TOF?
m
tX1
tY1
tX2
tY2
• Muons cross the detector
• A certain trigger logic is satisfied
• Relative time are recorded
TOP Plane
DOWN Plane
32. TIME EXPANSION
• A local trigger is produce on the slave board and
transmitted to the master when a particle hits the relative
plane
• Master board receives all local triggers and if they fulfill the
trigger logic, it sends to all slaves a global trigger (stop)
• We want to measure the time between every single local
trigger and the stop signal
• From the production of the local trigger to the stop signal a
capacitor is charged on each slave boards
Local trigger Local trigger
Enable window
Stop Stop
33. EXPERIMENTAL MEASURE OF THE TOF
Measured TDC spread
1.6 counts
320 ps
• Linear response
• RMS indipendent from the delay
delay (ns)
counts (a.u.)
counts(a.u.)
35. CONCLUSIONS
• The construction of the MU-Ray detector started in the spring of 2011
• Tests and experiments to find best materials, sensors, computing and
monitoring solutions lead to the development of a remotely controlled muon
detector
• Its precise calibration and characterization allowed to set for best
performance
• In April 2013 we “see” the Vesuvius, in the first outdoor employment
• From June 2013 to December 2013 the telescope has operated at the Puy
de Dome
• Data analysis is in progress
• Improvements and new features are in progress
38. The special tool in the picture was designed by technical support
to fix fibers to the connector. In such way, side by side, fibers
lower profiles fits naturally under effect of gravity, so once all fibers
are inserted in the relative guides to the connector, they are glued
to it with high precision.
Arbitrary Unit
On the right, we can see a well positioned fiber that comes outside
the hole. Thank to such analysis we were able to improve the fiber
positioning tool, to dispose all 32 fiber inside the connector using a
precision mechanics that softly align the fibers at same level
outside the holes.
FIBERS PLACEMENT
Arbitrary Unit
39. TRIGGER EFFICIENCY IN 6 PLANES CONFIGURATION
• The trigger efficiency has been measured setting up six different 5 planes trigger configuration
• With a counter we measure the number of coincidences in a fixed time window
• The trigger efficiency for each configuration is the ratio between the rate measured in 6 planes
configuration and the rate of a given 5 planes configuration
41. Only PdD track
All golden tracks:
Calibration + PdD
PdD tracks
contribution.
Calibration
Calibration
Total number: 11.4 Milion
42. <Golden track rate * dead time> = 2.0 Hz
∑ Ntkxy
T DAQ
× DTF Corrected for the deadtime
43. Number of days pointing the PdD = 92.
Due to pedestals and counting measures made between to different
runs the effective DAQ duration is : 6.89*106
s ≈ 79.74 days
<Golden track rate * dead time> = 2.0 Hz
<Golden track rate > = 1.6 Hz
Effective time = 6.89*106
s
Number of expected tracks = 1.6 * 6.89*106
= 11.02
Milion
Number of integrated golden tracks = 11.4 Milion
44. MUON RADIOGRAPHY SCHEMA
• We generate in projective geometry a map of the absorption of the flux of muons through
the edifice
• The comparison between the experimental absorption and theoretical data allows to
estimate the mean density of the rock
• Theoretical data are rappresented by the expected muon fluxes function of the rock
thickness (in km water equivalent), at different zenith angles.
45. G-APD
• Sono matrici di APD collegati in parallelo
• Per la rivelazione di luce verde si preferisce
usare n su p-substrate
-
• In regime di Single-photon counting si ha che
il guadagno è proporzionale al numero di fotoni
incidenti
46. LA MODALITA’ GEIGER
• La moltiplicazione di portatori liberi
avviene sia coinvolgendo le lacune, che
con un aumento esponenziale dei portatori
di carica
• Il funzionamento di
ogni singola cella è
ripristinato mediante il
meccanismo di
quenching
APD Modes
(lineare)
G-APD Mode
(esponenziale)
47. IL DARK NOISE
• L’overvoltage, la differenza tra la
tensione di bias e quella di breakdown,
ha effetto sui conteggi di buio,
attraverso la tensione di breakdown. Il
guadagno A, e di conseguenza
l’efficienza di fotorivelazione (PDE), è
proporzionale all’overvoltage e siccome
una variaizone in temperatura produce
cambiamenti nella tensione di
breakdown di circa 50 mV/°C, la PDE
varia di qualche punto percentuale a
grado Celsius. I conteggi di buio (dark
counts) sono prodotti a partire da
cariche libere generate per aggitazione
termica con una frequenza compresa tra
100 kHz e 10 MHz per mm2 at 25 °C.
• Si noti che variazioni di 8°C producono
un aumento o una diminuzione, a
seconda che si tratti di un incremento
in temperatura o meno, di un fattore 2
dei dark counts.
48. The Peltier Cell
We have dealt with Peltier cells
manifactured by Global Component
Sourcing with specifications, as it
follows from the related datasheet
49. Ora, rispetto alla capacità del calore flussare lungo le le tre direzioni di un solido, se si considerano due parallelepipedi di
rame di uguale lunghezza e larghezza ma con spessori differenti, il flusso calorifico risulta avvantaggiato quando attraversa
ortogonsaalmente lo spessore minore, ma di converso è sfavorito il passaggio lungo il piano che presenta una superfice
ridotta rispetto a quella di spessore maggiore.
𝑙 = 200 × 10−3
m
𝑤 = 18 × 10−3
m
𝑡1 = 10 × 10−6
m
𝑙 = 200 × 10−3
m
𝑤 = 18 × 10−3
m
𝑡2 = 3 × 10⁻³
m
𝜑 𝑜𝑟𝑡
𝜑 𝑝𝑙𝑎𝑛
1
2
𝜑 𝑝𝑙𝑎𝑛1
= −
18 × 10 × 10−9
200 × 10−3
𝑘 𝑐𝑜𝑝𝑝𝑒𝑟 ∆𝑇 𝜑 𝑝𝑙𝑎𝑛2
= −
18 × 3 × 10−6
200 × 10−3
𝑘 𝑐𝑜𝑝𝑝𝑒𝑟 ∆𝑇 𝜑 𝑝𝑙𝑎𝑛2
= 300 𝜑 𝑝𝑙𝑎𝑛1
Thermal conductance Peltier Cell
50. DIRECT GPIO CONNECTION
Protocol main features:
• RPi set in RUN mode the master so that acquisition starts
• In the case of a trigger, the RPi stops data acquisition and sets the master in DIAG mode. The
master reads every slave and sends the FIFO_READY to RPi.
• The trigger and the FIFO_READY signals are managed by the RPi as hardware interrupts
• The RPi reads master memory sending 32 clock pulse per time and receiving 32 bits of data.
Once the FIFO is empty the master reset FIFO_READY and waits for RUN mode
• At the end of every operation the receiver responds with the acknowledgement signal
51. HOW TO MEASURE TOF?
m
tX1
tY1
tX2
tY2
• Muons cross the detector
• A certain trigger logic is satisfied
• Relative time are recorder
TOP Plane
(A)
DOWN Plane
(B)
Toy Montecarlo Spreads generation
o Physics : 700 ps
o TDC : 600 ps
Problem
No information about who triggers
52. MODEL OF TIME OF FLIGHT
• We use a trigger logic that takes into
account only the X-view (2 boards)
• In the Toy Montecarlo we will consider
all expansion factors having the same
value E
Expected Distribution
53. DISTRIBUTIONS SHAPE CHECK
4PTL
2PTL
• Due to the variability of the trigger board in 4PTL configuration, distributions
present different behaviors which are not easy to be separated
• In each distribution, the first peak is about trigger events
(mean value off = 400, standard deviation = 3.4)
58. CONCLUSIONS
• We shown how to calculate the time of flight of muons when the flux
is bidirectional and only relative time information are available
• A toy montecarlo has been developed to recreate a simplified
muons detector
• We develop a model to analyze data distributions and calculate the
time of flight of muons
• Comparing two different trigger configuration we have verified the 2
plane trigger model
59. • Design of the Telescope
• Optimization of the light efficiency fiber - scintillator coupling
• Fibers connector
• Construction of the Telescope
• Assembly supervisor
• Tools realization
• Study on thermal stabilization of the Telescope
• Design of an hydraulic circuit to use with industrial water chiller
• Realization of a Peltier cells based cooling prototype
• Detector Commissioning
• Trigger Efficiency
• Realization of an automated remote control system for slow control and data
taking
• Measurement Campaigns at Vesuvius and Puy de Dome
• Improvement and characterization of a second generation electronic system
• Study of the TOF problem and Realization of a model suitable for the Mu-
Ray detector
SUMMARY OF MY MAIN CONTRIBUTIONS