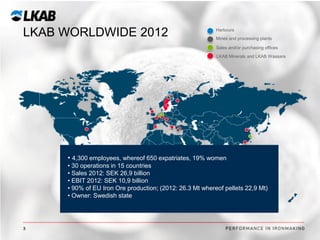
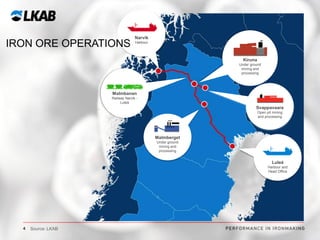
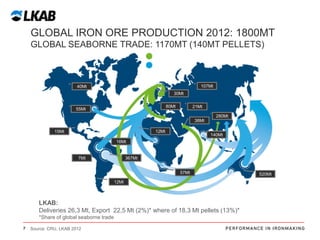
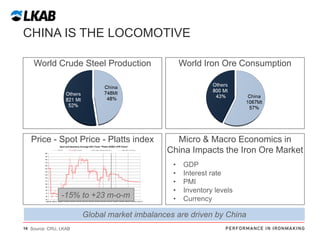
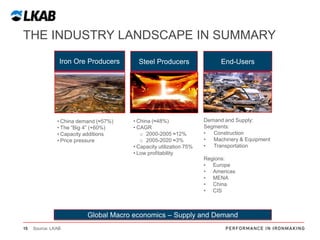
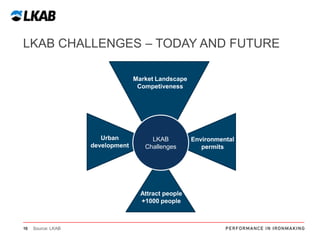
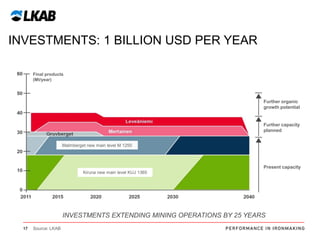
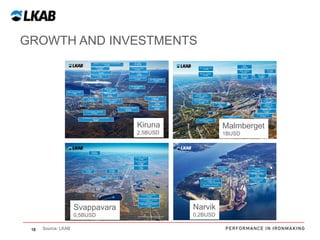
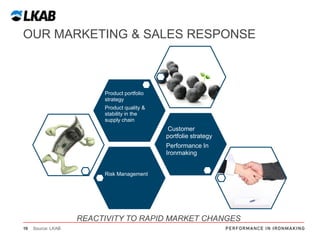
MINING ON TOP – STOCKHOLM
NOV 26-27, 2013
The Industry Landscape –
How does it affect LKAB in the future
Peter Schmid, Marketing & Sales Director
• Introduction about LKAB - Update
• The Industry Landscape
• …and How does it affect LKAB in the future

Iron Ore Producer

Steel Producers

End-Users

THE INDUSTRY VALUE CHAIN – FROM MINE TO END-USER

LKAB - MORE THAN 120 YEARS OF SERVING THE STEEL INDUSTRY
2
LKAB WORLDWIDE 2012

Harbours
Mines and processing plants

Sales and/or purchasing offices
LKAB Minerals and LKAB Wassara

• 4,300 employees, whereof 650 expatriates, 19% women
• 30 operations in 15 countries
• Sales 2012: SEK 26,9 billion
• EBIT 2012: SEK 10,9 billion
• 90% of EU Iron Ore production; (2012: 26.3 Mt whereof pellets 22,9 Mt)
• Owner: Swedish state

3
IRON ORE OPERATIONS

Narvik
Harbour

Kiruna
Under ground
mining and
processing

Malmbanan
Railway Narvik Luleå

Svappavaara
Open pit mining
and processing

Malmberget
Under ground
mining and
processing

Luleå
Harbour and
Head Office

4

Source: LKAB
PRODUCTION STRUCTURE
Mines

Sorting

Processing

Pelletizing

Products

Harbours

NARVIK

Kiruna
Kiruna

Pellets
40 km

Gruvberget

Svappavaara

Svappavaara

Mertainen
Leveäniemi

LULEÅ

Malmberget
Malmberget

Pellets

Fines
5

Source: LKAB
LKAB PRODUCTION AND SALES 2012
Market (Revenues)

Products
Special 4%

Others 1%

Fines 12%

Pellets BF
62%

Middle
East &
Asia 32%

Pellets DR
21%

Blast furnace pellets (BF) for coal-based steel production
Direct reduction pellets (DR) for natural gas-based steel production
6

Source: LKAB

Europe
67%
GLOBAL IRON ORE PRODUCTION 2012: 1800MT
GLOBAL SEABORNE TRADE: 1170MT (140MT PELLETS)

107Mt

40Mt
30Mt
80Mt

55Mt

21Mt
280Mt
38Mt

12Mt

15Mt

140Mt

16Mt

7Mt

367Mt
57Mt
12Mt

LKAB:
Deliveries 26,3 Mt, Export 22,5 Mt (2%)* where of 18,3 Mt pellets (13%)*
*Share of global seaborne trade
7

Source: CRU, LKAB 2012

520Mt
IRON ORE EXPORT & IMPORT BY REGION 2012
Export

South Am: Brazil 350 Mt, Chile 13 Mt

8

Source: CRU, LKAB

Import

Asia: China 739 Mt, Japan 130 Mt,
S Korea 64 Mt & ME 34 Mt
IRON ORE MARKET CONTINENTAL DRIFT
2000-2012 (IMPORTS)
Year 2000

Year 2012
126 Mt
13%

68 Mt
20%

124 Mt
12%

152 Mt
44%

739 Mt
75%

124 Mt
36%

Total 344 Mt

Total 989 Mt
China

9

Source: CRU, LKAB

Japan

EU27
GLOBAL IRON ORE CONSUMPTION BY
PRODUCTS 2012 – 2017F
+ 20%

2012:
appr. 1800 Mt
2017F: appr. 2200 Mt

+ 23%
+ 23%
+ 51%

2012
10 Source: CRU, LKAB

2017F
NEW IRON ORE PROSPECTS

11 Source: Raw Material Group
FINISHED STEEL PRODUCTS 2000 VS 2020 (MT)
167 154 186
141

98

CIS

132

585

Europe

North America
28
41

814

73
28 45

65

63

131
132

131

India
China

South America
•
•
•

CAGR 2005-2020: ≈3%
Low price level
Overcapacity

12 Source: World Steel Association (WSA); McKinsey Steel Demand Model

Demand Steel
2000

2010

2020
CONSUMPTION OF STEEL (KG/CAPITA)

Canada
Mexico
United States
NAFTA

France
Germany
Belgium-Luxembourg
Italy
European Union (27)
Russia

416,4
158,1
284,5
263,0

Middle East

Africa

Central & South America

208,5
479,6
422,5
459,5
310,0
292,2

233,9

China
India
Japan
South Korea
Taiwan
Asia

459,8
57,0
506,7
1156,6
784,4
238,8

34,8

98,6

Australia and New Zealand

World: 215 kg/capita
13

Source: World Steel

261,6
CHINA IS THE LOCOMOTIVE
World Crude Steel Production

World Iron Ore Consumption

Price - Spot Price - Platts index

Micro & Macro Economics in
China Impacts the Iron Ore Market

-15% to +23 m-o-m

•
•
•
•
•

GDP
Interest rate
PMI
Inventory levels
Currency

Global market imbalances are driven by China
14 Source: CRU, LKAB
THE INDUSTRY LANDSCAPE IN SUMMARY
Iron Ore Producers

• China demand (≈57%)
• The “Big 4” (+60%)
• Capacity additions
• Price pressure

Steel Producers

End-Users

• China (≈48%)
• CAGR
o 2000-2005 ≈12%
o 2005-2020 ≈3%
• Capacity utilization 75%
• Low profitability

Demand and Supply:
Segments:
•
Construction
•
Machinery & Equipment
•
Transportation
Regions:
• Europe
• Americas
• MENA
• China
• CIS

Global Macro economics – Supply and Demand
15

Source: LKAB
LKAB CHALLENGES – TODAY AND FUTURE
Market Landscape
Competiveness

Urban
development

LKAB
Challenges

Attract people
+1000 people

16

Source: LKAB

Environmental
permits
INVESTMENTS: 1 BILLION USD PER YEAR
Final products
(Mt/year)

Further organic
growth potential

Further capacity
planned
Malmberget new main level M 1250

Present capacity
Kiruna new main level KUJ 1365

INVESTMENTS EXTENDING MINING OPERATIONS BY 25 YEARS
17

Source: LKAB
GROWTH AND INVESTMENTS

Kiruna

Malmberget

2,5BUSD

1BUSD

Svappavara
0,5BUSD
18

Source: LKAB

Narvik
0,2BUSD
OUR MARKETING & SALES RESPONSE

Product portfolio
strategy
Product quality &
stability in the
supply chain

Customer
portfolie strategy

Performance In
Ironmaking

Risk Management

REACTIVITY TO RAPID MARKET CHANGES
19

Source: LKAB
20

The Industry Landscape - How does it affect LKAB in the future

  • 1.
    MINING ON TOP– STOCKHOLM NOV 26-27, 2013 The Industry Landscape – How does it affect LKAB in the future Peter Schmid, Marketing & Sales Director
  • 2.
    • Introduction aboutLKAB - Update • The Industry Landscape • …and How does it affect LKAB in the future Iron Ore Producer Steel Producers End-Users THE INDUSTRY VALUE CHAIN – FROM MINE TO END-USER LKAB - MORE THAN 120 YEARS OF SERVING THE STEEL INDUSTRY 2
  • 3.
    LKAB WORLDWIDE 2012 Harbours Minesand processing plants Sales and/or purchasing offices LKAB Minerals and LKAB Wassara • 4,300 employees, whereof 650 expatriates, 19% women • 30 operations in 15 countries • Sales 2012: SEK 26,9 billion • EBIT 2012: SEK 10,9 billion • 90% of EU Iron Ore production; (2012: 26.3 Mt whereof pellets 22,9 Mt) • Owner: Swedish state 3
  • 4.
    IRON ORE OPERATIONS Narvik Harbour Kiruna Underground mining and processing Malmbanan Railway Narvik Luleå Svappavaara Open pit mining and processing Malmberget Under ground mining and processing Luleå Harbour and Head Office 4 Source: LKAB
  • 5.
  • 6.
    LKAB PRODUCTION ANDSALES 2012 Market (Revenues) Products Special 4% Others 1% Fines 12% Pellets BF 62% Middle East & Asia 32% Pellets DR 21% Blast furnace pellets (BF) for coal-based steel production Direct reduction pellets (DR) for natural gas-based steel production 6 Source: LKAB Europe 67%
  • 7.
    GLOBAL IRON OREPRODUCTION 2012: 1800MT GLOBAL SEABORNE TRADE: 1170MT (140MT PELLETS) 107Mt 40Mt 30Mt 80Mt 55Mt 21Mt 280Mt 38Mt 12Mt 15Mt 140Mt 16Mt 7Mt 367Mt 57Mt 12Mt LKAB: Deliveries 26,3 Mt, Export 22,5 Mt (2%)* where of 18,3 Mt pellets (13%)* *Share of global seaborne trade 7 Source: CRU, LKAB 2012 520Mt
  • 8.
    IRON ORE EXPORT& IMPORT BY REGION 2012 Export South Am: Brazil 350 Mt, Chile 13 Mt 8 Source: CRU, LKAB Import Asia: China 739 Mt, Japan 130 Mt, S Korea 64 Mt & ME 34 Mt
  • 9.
    IRON ORE MARKETCONTINENTAL DRIFT 2000-2012 (IMPORTS) Year 2000 Year 2012 126 Mt 13% 68 Mt 20% 124 Mt 12% 152 Mt 44% 739 Mt 75% 124 Mt 36% Total 344 Mt Total 989 Mt China 9 Source: CRU, LKAB Japan EU27
  • 10.
    GLOBAL IRON ORECONSUMPTION BY PRODUCTS 2012 – 2017F + 20% 2012: appr. 1800 Mt 2017F: appr. 2200 Mt + 23% + 23% + 51% 2012 10 Source: CRU, LKAB 2017F
  • 11.
    NEW IRON OREPROSPECTS 11 Source: Raw Material Group
  • 12.
    FINISHED STEEL PRODUCTS2000 VS 2020 (MT) 167 154 186 141 98 CIS 132 585 Europe North America 28 41 814 73 28 45 65 63 131 132 131 India China South America • • • CAGR 2005-2020: ≈3% Low price level Overcapacity 12 Source: World Steel Association (WSA); McKinsey Steel Demand Model Demand Steel 2000 2010 2020
  • 13.
    CONSUMPTION OF STEEL(KG/CAPITA) Canada Mexico United States NAFTA France Germany Belgium-Luxembourg Italy European Union (27) Russia 416,4 158,1 284,5 263,0 Middle East Africa Central & South America 208,5 479,6 422,5 459,5 310,0 292,2 233,9 China India Japan South Korea Taiwan Asia 459,8 57,0 506,7 1156,6 784,4 238,8 34,8 98,6 Australia and New Zealand World: 215 kg/capita 13 Source: World Steel 261,6
  • 14.
    CHINA IS THELOCOMOTIVE World Crude Steel Production World Iron Ore Consumption Price - Spot Price - Platts index Micro & Macro Economics in China Impacts the Iron Ore Market -15% to +23 m-o-m • • • • • GDP Interest rate PMI Inventory levels Currency Global market imbalances are driven by China 14 Source: CRU, LKAB
  • 15.
    THE INDUSTRY LANDSCAPEIN SUMMARY Iron Ore Producers • China demand (≈57%) • The “Big 4” (+60%) • Capacity additions • Price pressure Steel Producers End-Users • China (≈48%) • CAGR o 2000-2005 ≈12% o 2005-2020 ≈3% • Capacity utilization 75% • Low profitability Demand and Supply: Segments: • Construction • Machinery & Equipment • Transportation Regions: • Europe • Americas • MENA • China • CIS Global Macro economics – Supply and Demand 15 Source: LKAB
  • 16.
    LKAB CHALLENGES –TODAY AND FUTURE Market Landscape Competiveness Urban development LKAB Challenges Attract people +1000 people 16 Source: LKAB Environmental permits
  • 17.
    INVESTMENTS: 1 BILLIONUSD PER YEAR Final products (Mt/year) Further organic growth potential Further capacity planned Malmberget new main level M 1250 Present capacity Kiruna new main level KUJ 1365 INVESTMENTS EXTENDING MINING OPERATIONS BY 25 YEARS 17 Source: LKAB
  • 18.
  • 19.
    OUR MARKETING &SALES RESPONSE Product portfolio strategy Product quality & stability in the supply chain Customer portfolie strategy Performance In Ironmaking Risk Management REACTIVITY TO RAPID MARKET CHANGES 19 Source: LKAB
  • 20.