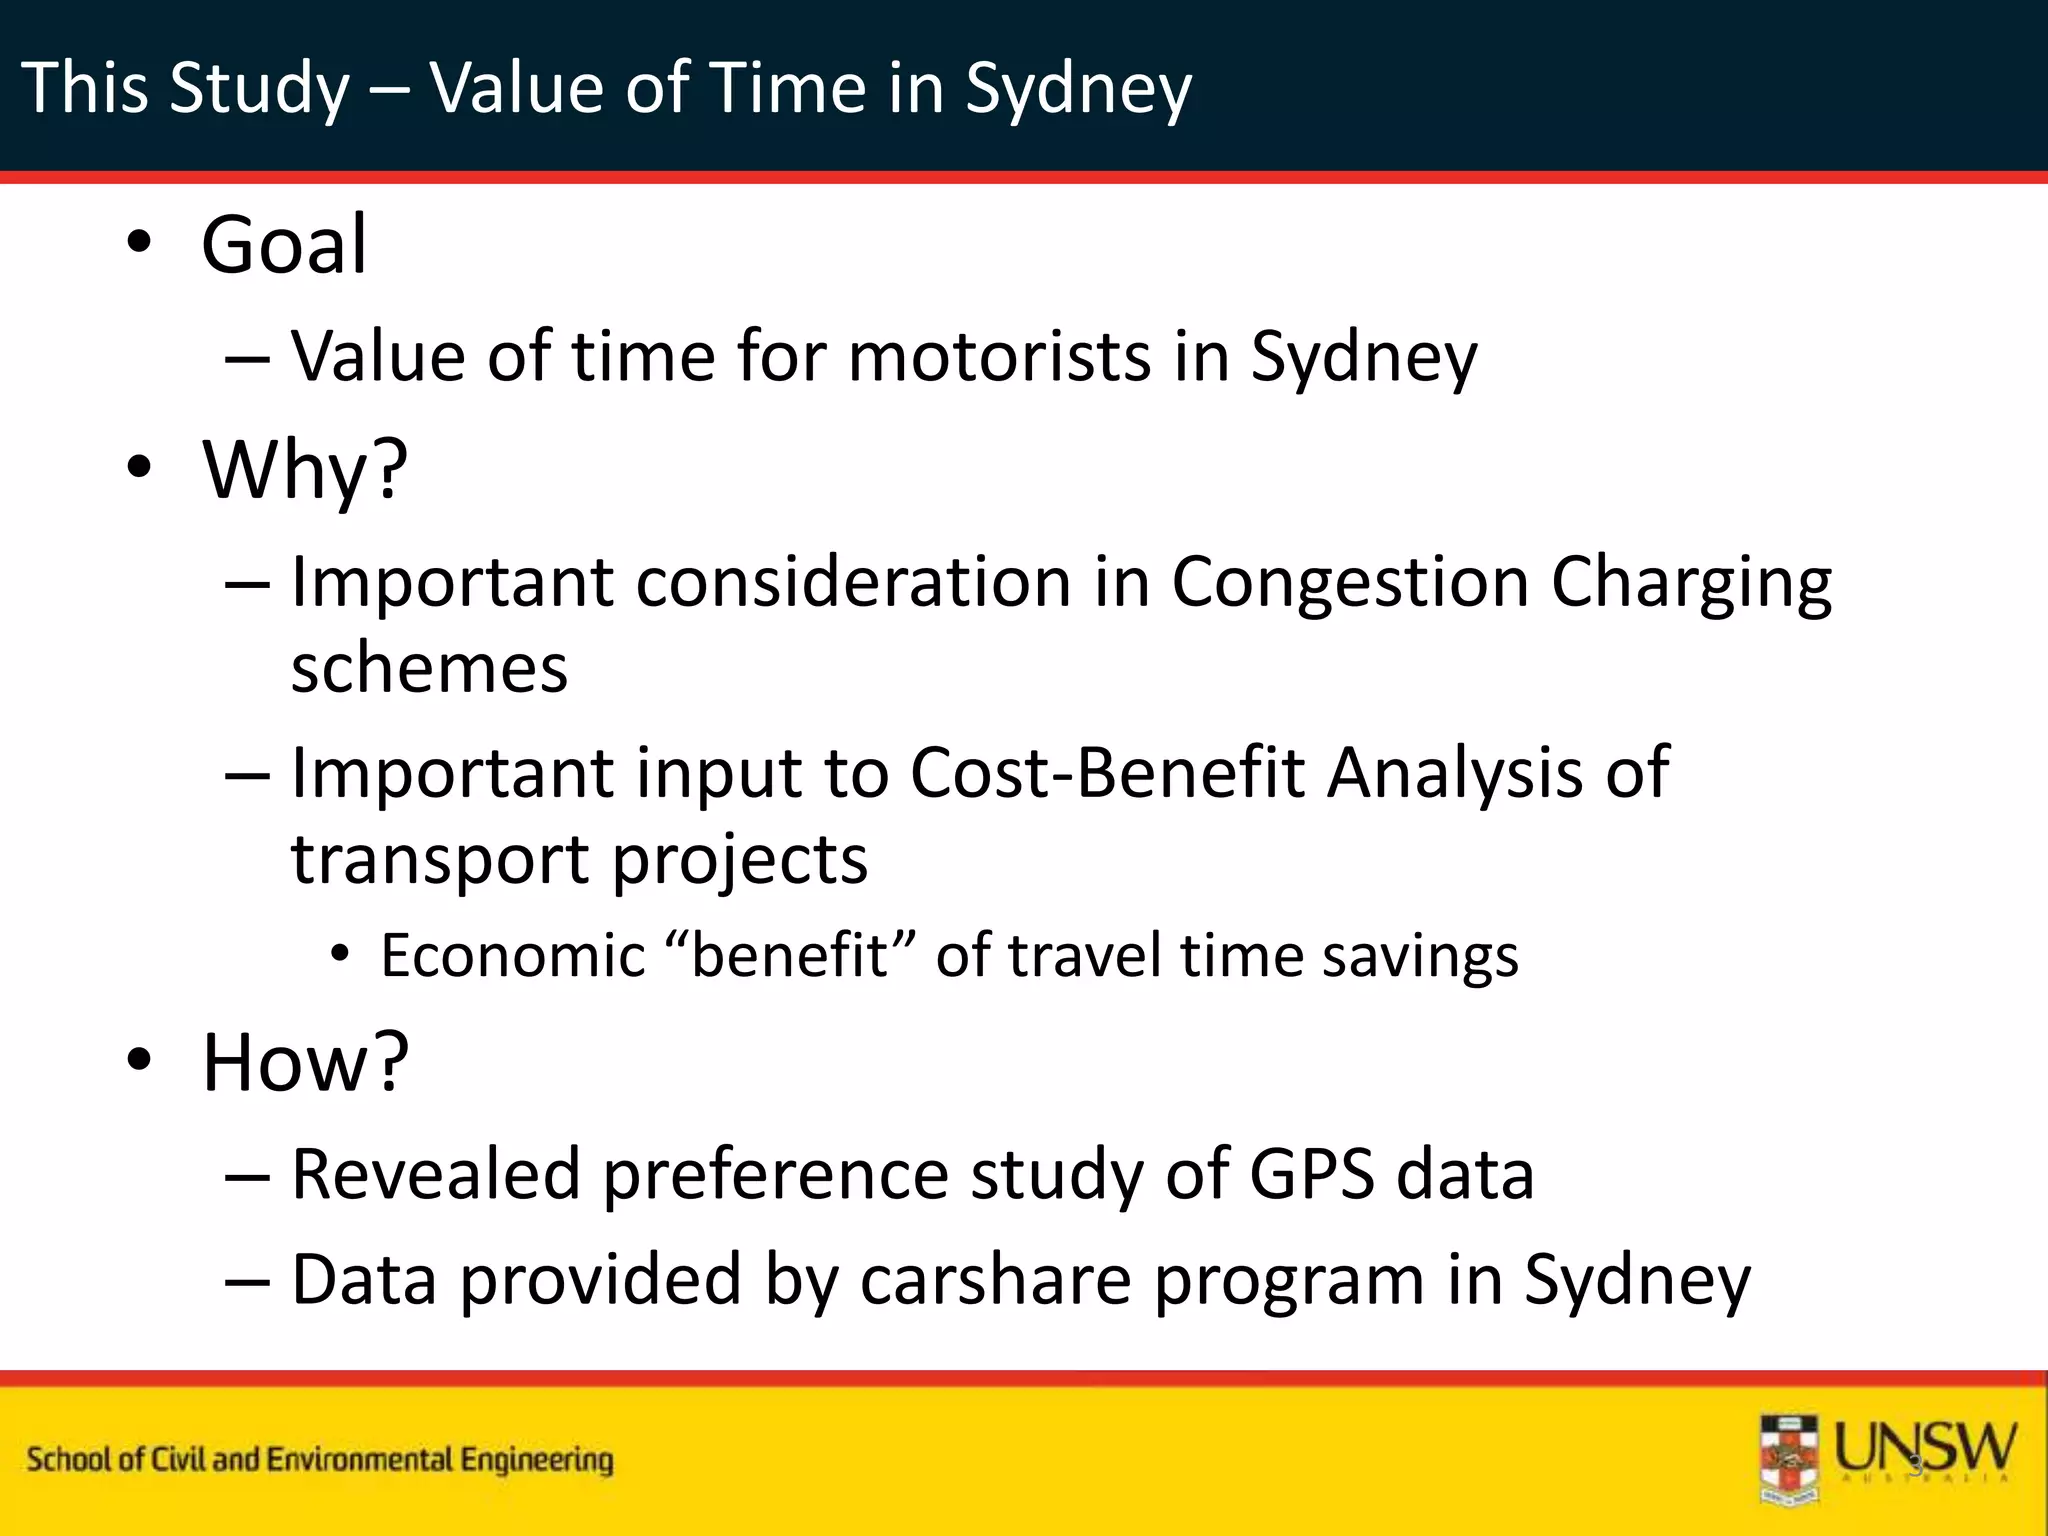
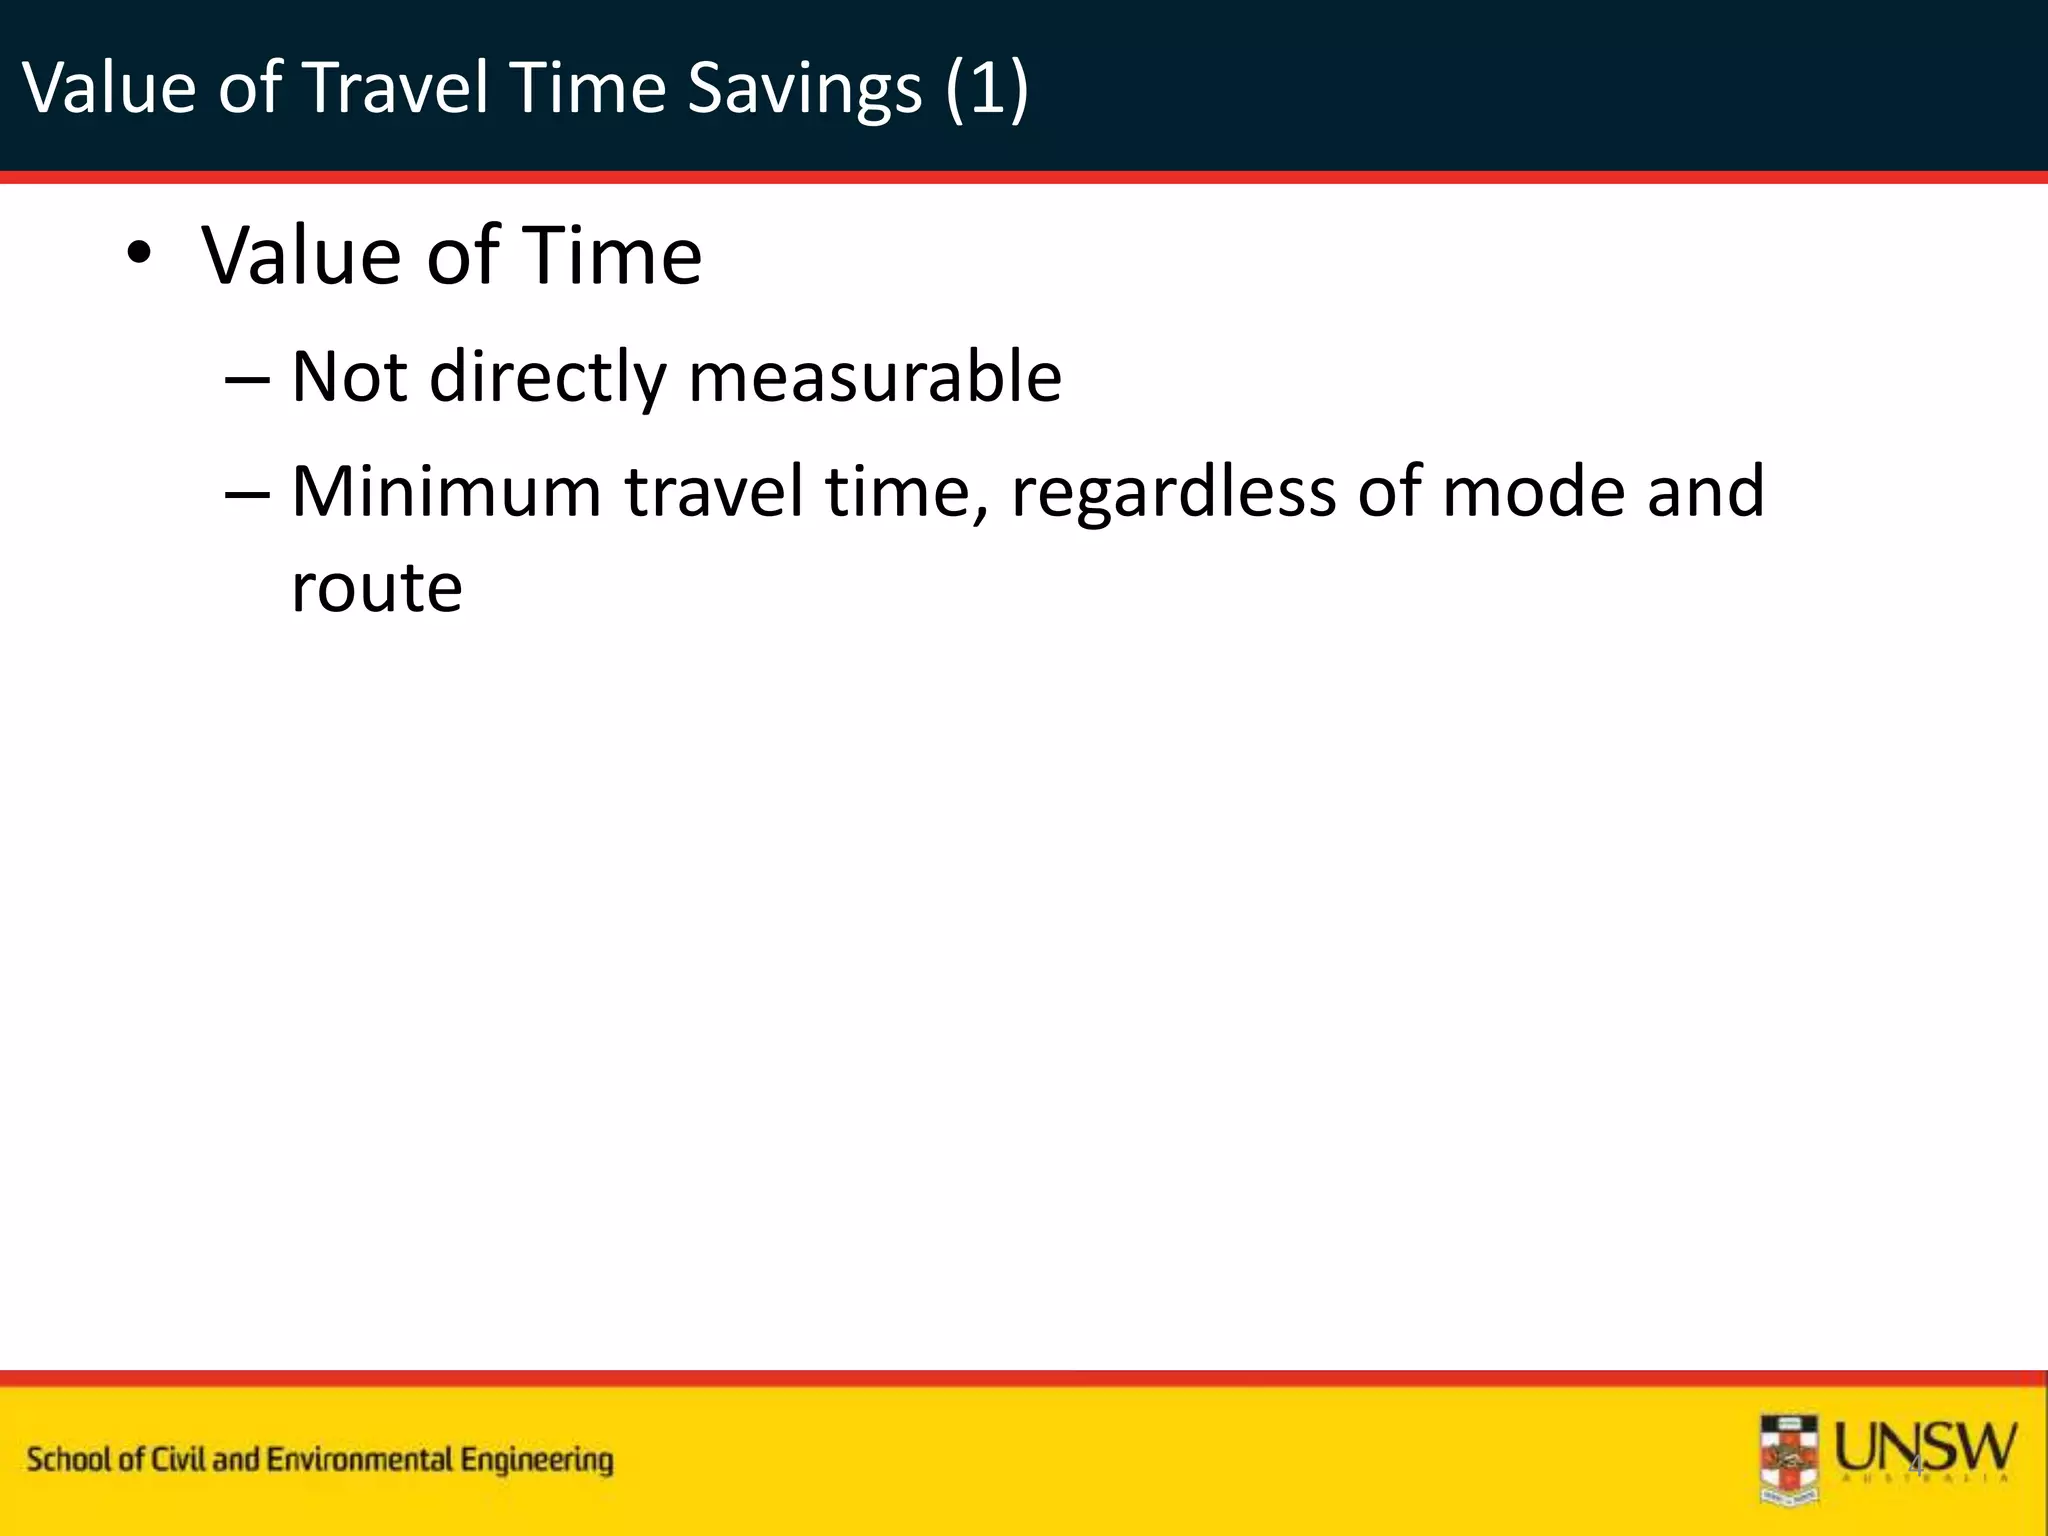
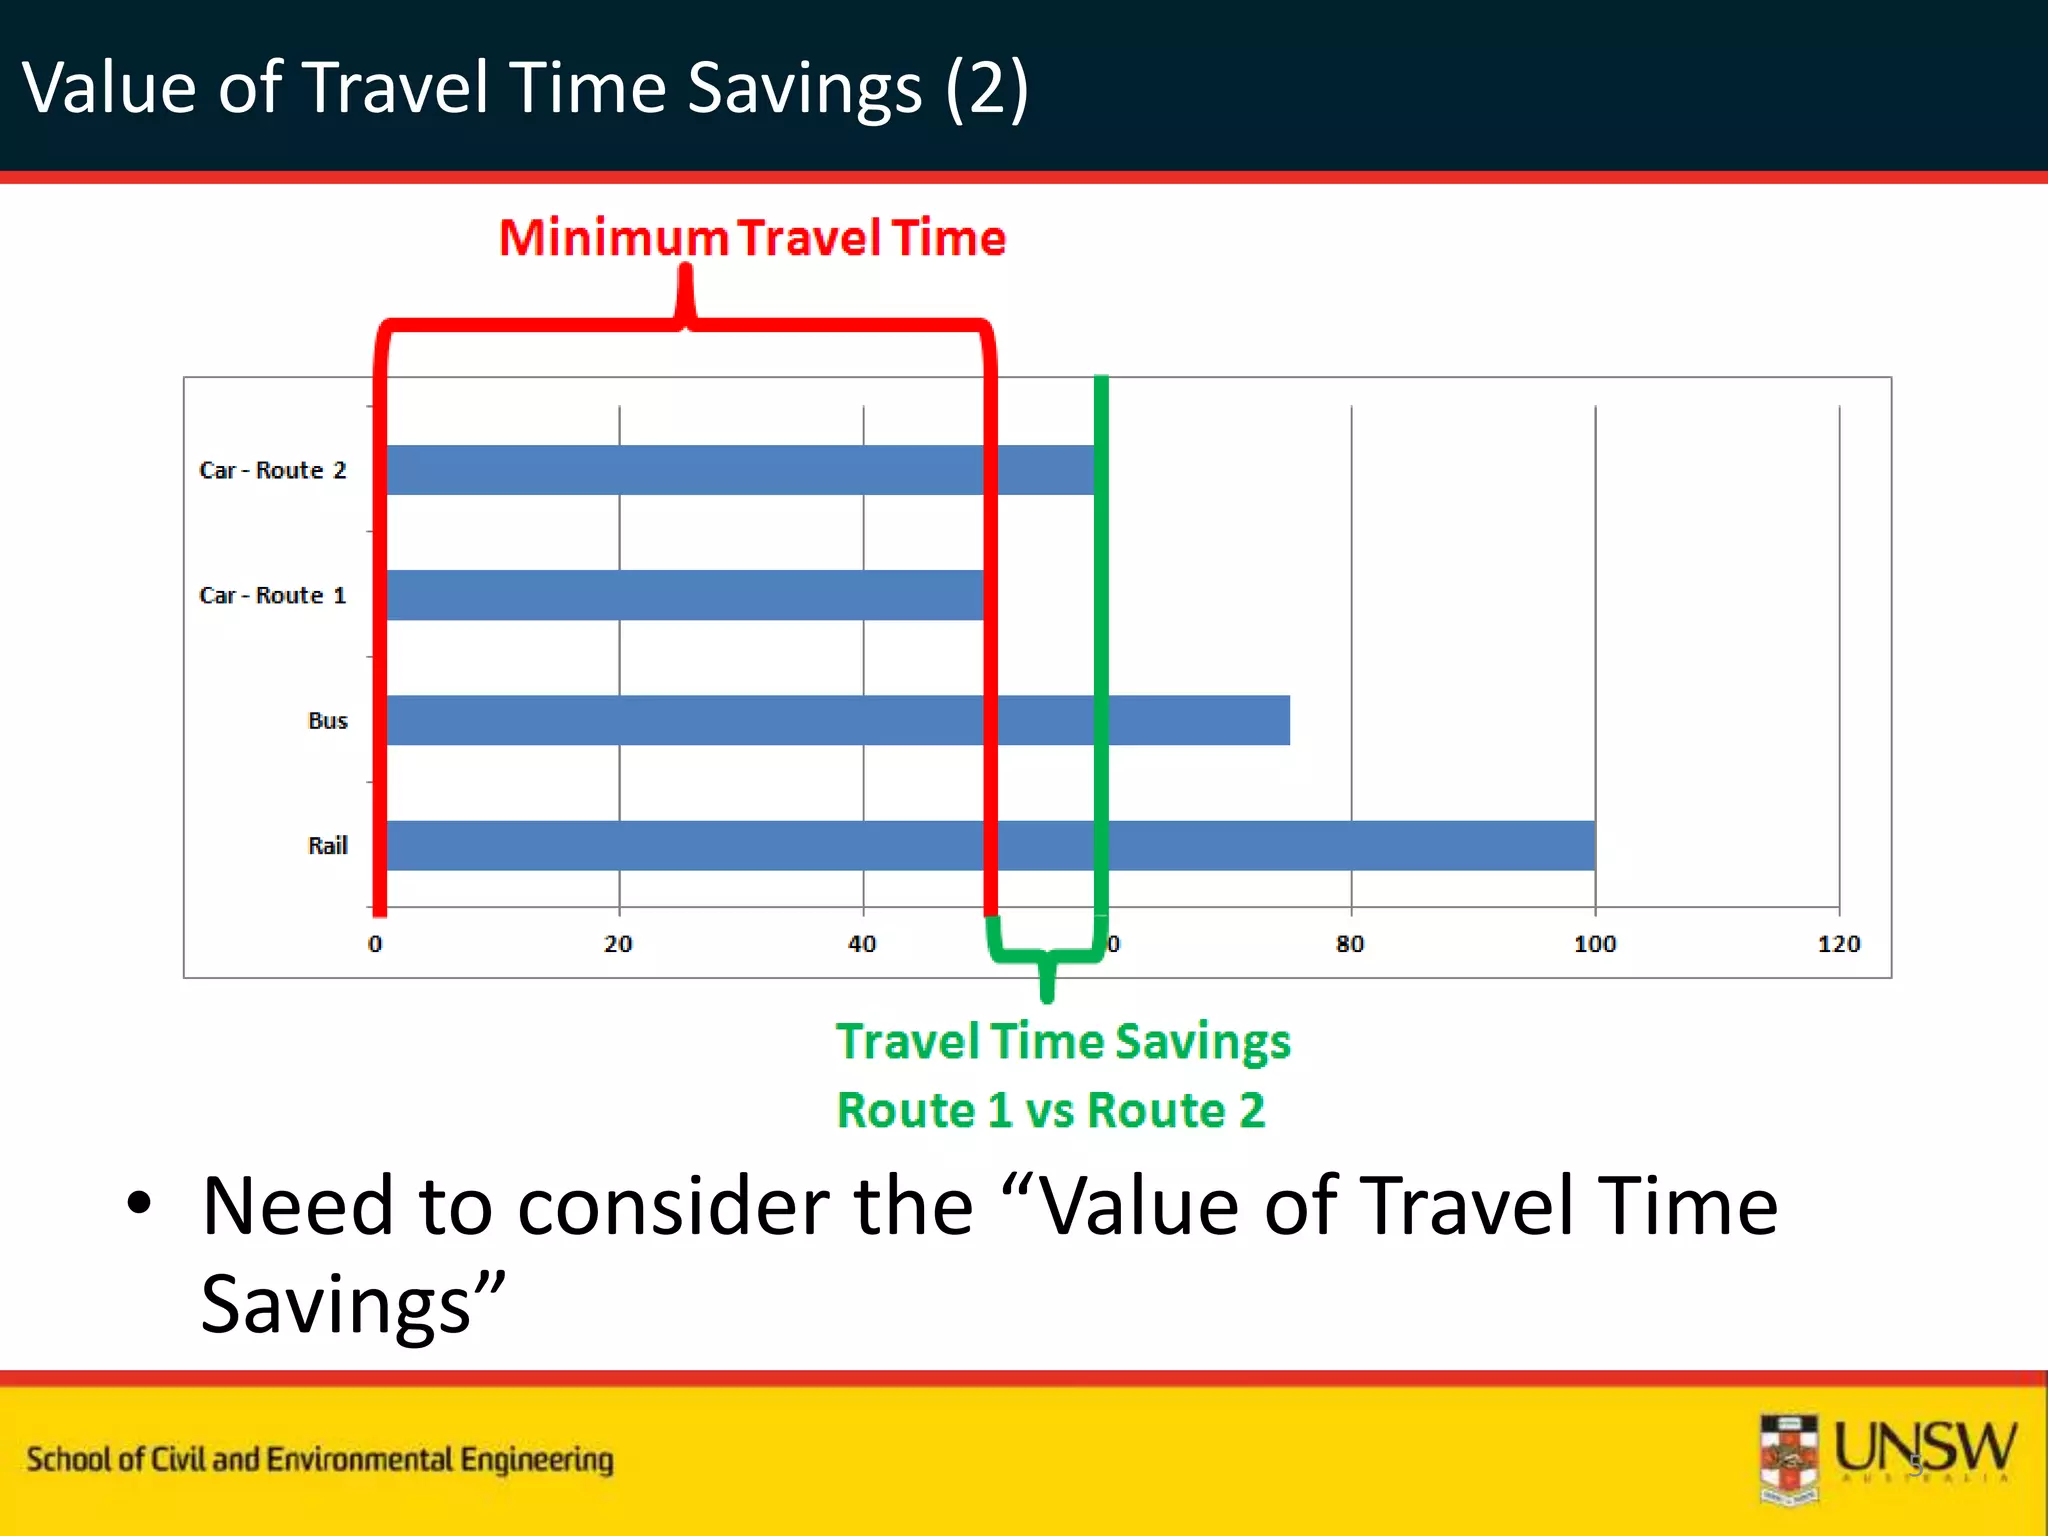
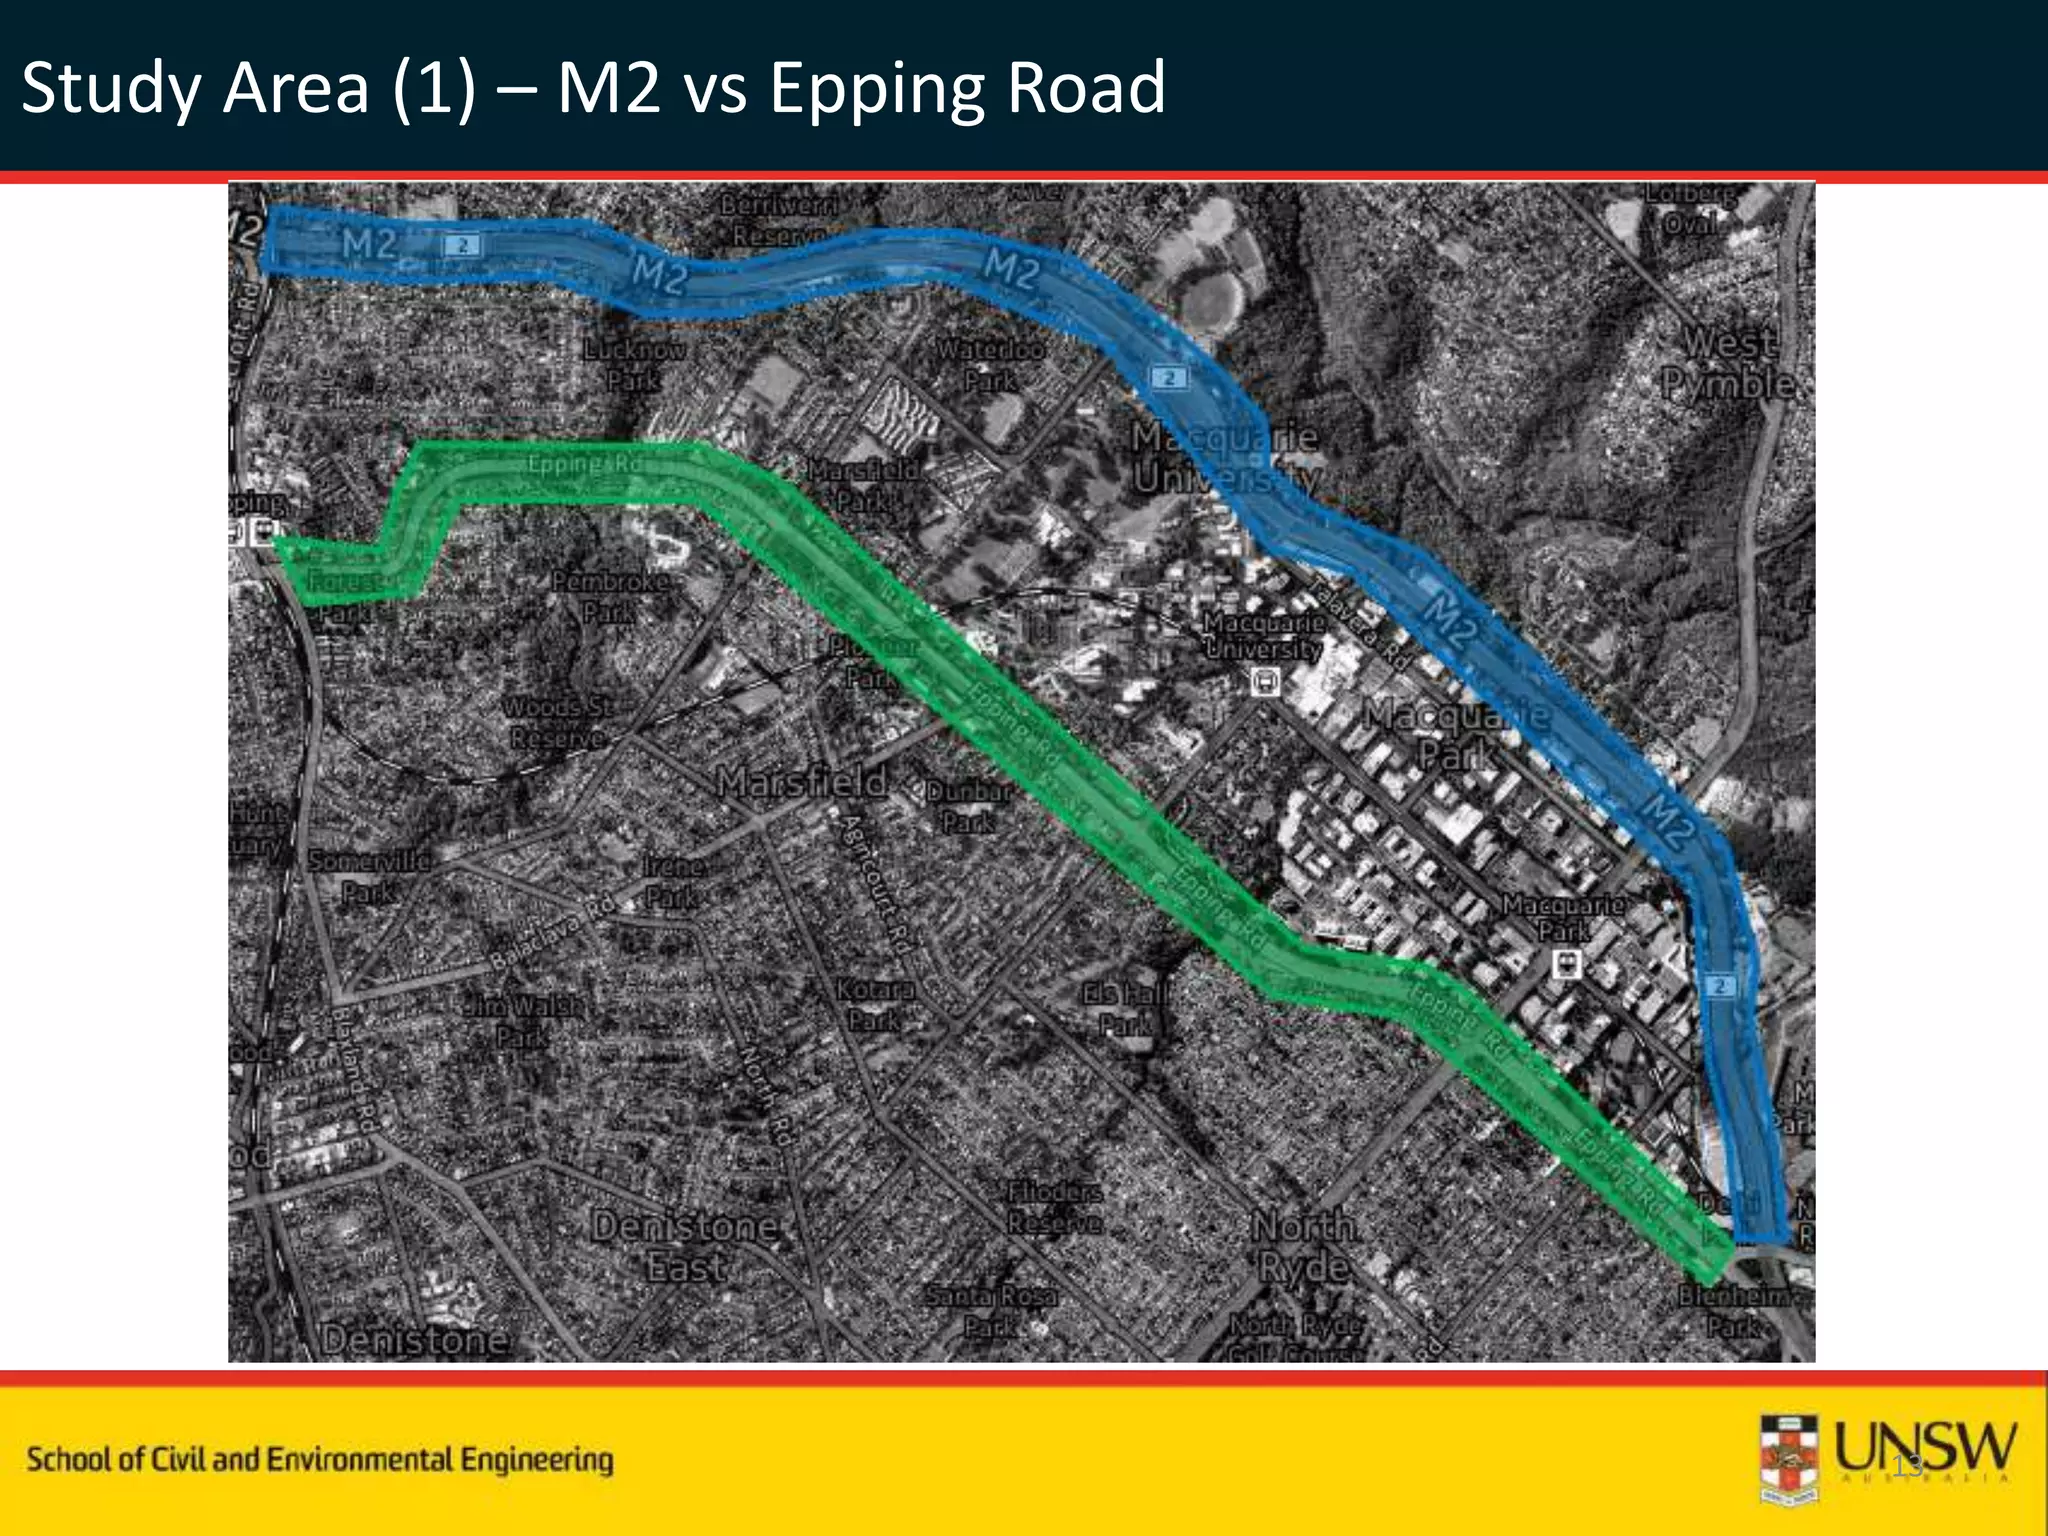
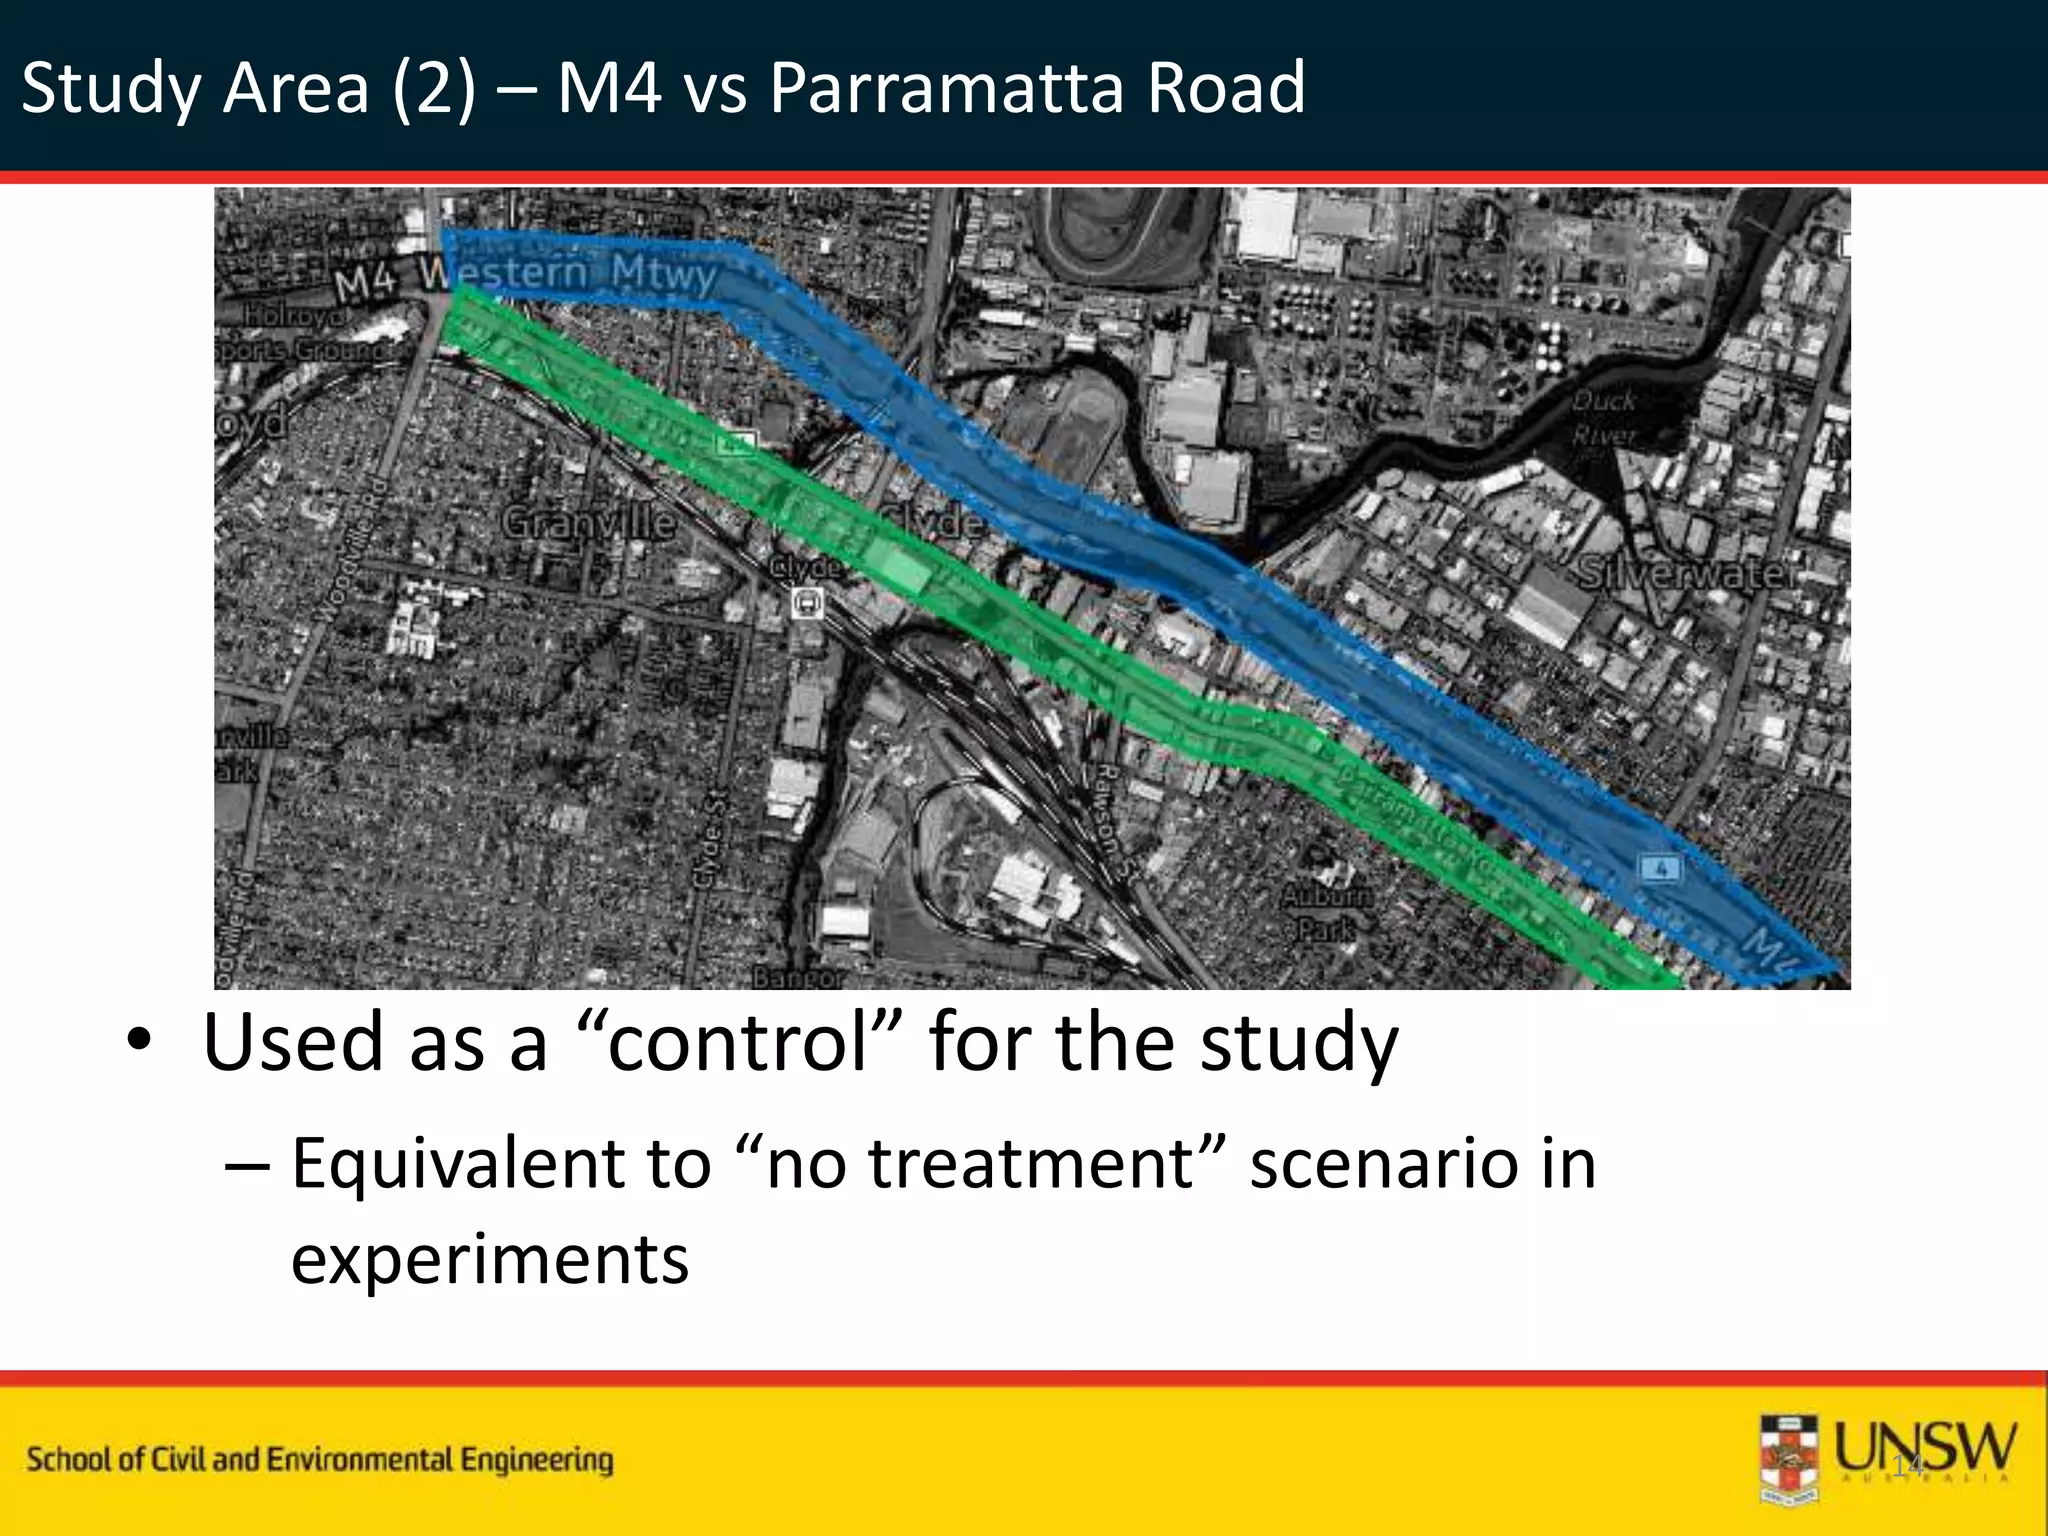
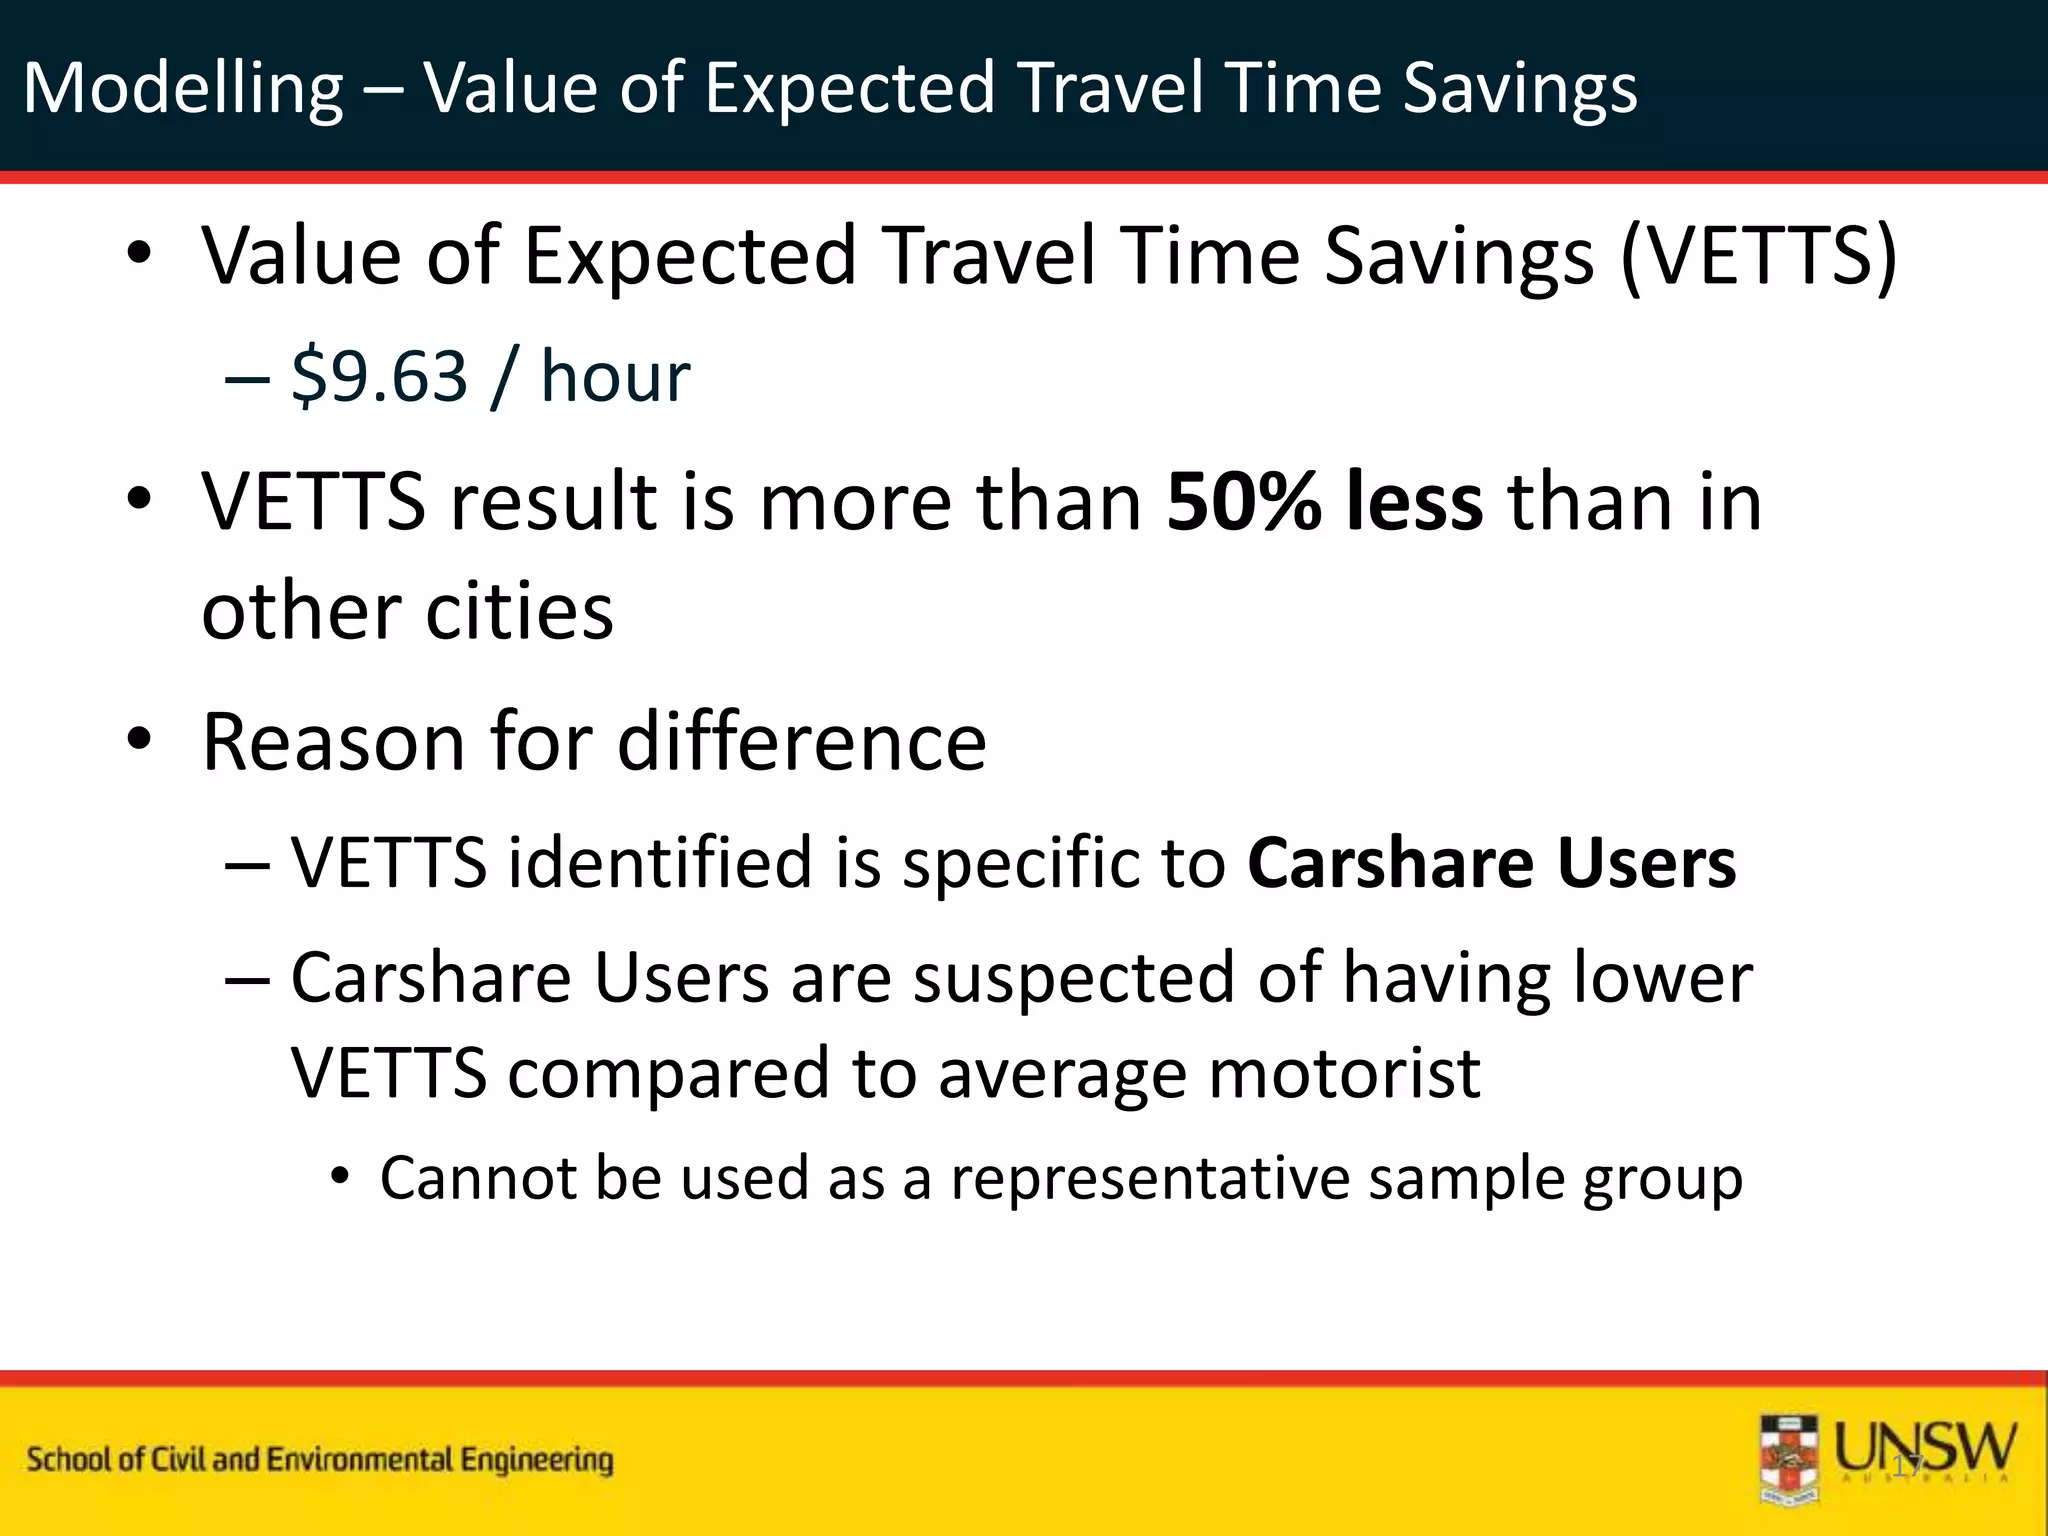
Value of Time of Carshare Users in Sydney
Revealed Preference Study of GPS Data
Dr. V.V. Dixit | John Trieu | Sisi Jian | Xun Li
Introduction – Why Study Value of Time?
• Economic cost of congestion
– $3.9 billion to Sydney in 2005
(BITRE, 2007)
2
This Study – Value of Time in Sydney
• Goal
– Value of time for motorists in Sydney
• Why?
– Important consideration in Congestion Charging
schemes
– Important input to Cost-Benefit Analysis of
transport projects
• Economic “benefit” of travel time savings
• How?
– Revealed preference study of GPS data
– Data provided by carshare program in Sydney
3
Value of Travel Time Savings (1)
• Value of Time
– Not directly measurable
– Minimum travel time, regardless of mode and
route
4
Value of Travel Time Savings (2)
• Need to consider the “Value of Travel Time
Savings”
5
What is a Revealed Preference study?
• Collection of raw data (e.g. GPS logs)
• Convert data to trips
• Determine relationships between trip
decisions and factors influencing choices
• The preferences of drivers are “Revealed”
– Preferences are not explicitly “Stated” by drivers
6
Past Studies
• Different locations = Different characteristics
– Los Angeles
– Brisbane
• Stated Preference = Controlled Experiment
(Hensher, Greene and Li, 2011)
– Artificial environment
7
Delineating Trips – Overview
• GPS Logs = Data Points
– Need trips
• Trip Identification – Trip Ends
– (1) Time between GPS data points
– (2) Time with zero movement
– (3) Significant changes in direction
8
Delineating Trips – (1) Time between GPS data points
• Large amount of time (e.g. 2 Days)
– Trip has ended
• Cut-off = 20 minutes
– Timeout of in-car GPS units
9
Delineating Trips – (2) Time with zero movement
• Based upon maximum signal cycle time in
Sydney
– 150 seconds during peak periods
10
Delineating Trips – (3) Significant changes in direction
• U-turns
• Turns greater than 90 degrees
– Sensitivity testing undertaken on the
change in heading
– No change in number of trips identified
11
This Study
• Focal Point
– Toll Road versus Untolled Alternative
– Can isolate value of time
• Explicit cost for toll road
• Stochastic travel time saving
12
Study Area (1) – M2 vs Epping Road
13
Study Area (2) – M4 vs Parramatta Road
• Used as a “control” for the study
– Equivalent to “no treatment” scenario in
experiments
14
This Study
• Other variables / covariates
– Age / Experience
– Preferred Travel Mode
– Car Ownership
15
Modelling – Value of Expected Travel Time Savings
• Regression Modelling
– Binary Logit Model
Choice of Motorway or Arterial
• Value of Expected Travel Time Savings (VETTS)
– $9.63 / hour
• Comparison VETTS
– Los Angeles, USA: $21.46 / hour
– Brisbane, Australia: $17.60 / hour
16
Modelling – Value of Expected Travel Time Savings
• Value of Expected Travel Time Savings (VETTS)
– $9.63 / hour
• VETTS result is more than 50% less than in
other cities
• Reason for difference
– VETTS identified is specific to Carshare Users
– Carshare Users are suspected of having lower
VETTS compared to average motorist
• Cannot be used as a representative sample group
17
Further Studies
• Risk aversion
– Travel times are stochastic
– Need to include risk parameter
• Model including risk parameter is ongoing
– Risk models considered:
• Constant Absolute Risk Aversion (CARA)
• Constant Relative Risk Aversion (CRRA)
• Ongoing / Not yet finalised
18
Questions?
19

Vinayak Dixit

  • 1.
    Value of Timeof Carshare Users in Sydney Revealed Preference Study of GPS Data Dr. V.V. Dixit | John Trieu | Sisi Jian | Xun Li
  • 2.
    Introduction – WhyStudy Value of Time? • Economic cost of congestion – $3.9 billion to Sydney in 2005 (BITRE, 2007) 2
  • 3.
    This Study –Value of Time in Sydney • Goal – Value of time for motorists in Sydney • Why? – Important consideration in Congestion Charging schemes – Important input to Cost-Benefit Analysis of transport projects • Economic “benefit” of travel time savings • How? – Revealed preference study of GPS data – Data provided by carshare program in Sydney 3
  • 4.
    Value of TravelTime Savings (1) • Value of Time – Not directly measurable – Minimum travel time, regardless of mode and route 4
  • 5.
    Value of TravelTime Savings (2) • Need to consider the “Value of Travel Time Savings” 5
  • 6.
    What is aRevealed Preference study? • Collection of raw data (e.g. GPS logs) • Convert data to trips • Determine relationships between trip decisions and factors influencing choices • The preferences of drivers are “Revealed” – Preferences are not explicitly “Stated” by drivers 6
  • 7.
    Past Studies • Differentlocations = Different characteristics – Los Angeles – Brisbane • Stated Preference = Controlled Experiment (Hensher, Greene and Li, 2011) – Artificial environment 7
  • 8.
    Delineating Trips –Overview • GPS Logs = Data Points – Need trips • Trip Identification – Trip Ends – (1) Time between GPS data points – (2) Time with zero movement – (3) Significant changes in direction 8
  • 9.
    Delineating Trips –(1) Time between GPS data points • Large amount of time (e.g. 2 Days) – Trip has ended • Cut-off = 20 minutes – Timeout of in-car GPS units 9
  • 10.
    Delineating Trips –(2) Time with zero movement • Based upon maximum signal cycle time in Sydney – 150 seconds during peak periods 10
  • 11.
    Delineating Trips –(3) Significant changes in direction • U-turns • Turns greater than 90 degrees – Sensitivity testing undertaken on the change in heading – No change in number of trips identified 11
  • 12.
    This Study • FocalPoint – Toll Road versus Untolled Alternative – Can isolate value of time • Explicit cost for toll road • Stochastic travel time saving 12
  • 13.
    Study Area (1)– M2 vs Epping Road 13
  • 14.
    Study Area (2)– M4 vs Parramatta Road • Used as a “control” for the study – Equivalent to “no treatment” scenario in experiments 14
  • 15.
    This Study • Othervariables / covariates – Age / Experience – Preferred Travel Mode – Car Ownership 15
  • 16.
    Modelling – Valueof Expected Travel Time Savings • Regression Modelling – Binary Logit Model Choice of Motorway or Arterial • Value of Expected Travel Time Savings (VETTS) – $9.63 / hour • Comparison VETTS – Los Angeles, USA: $21.46 / hour – Brisbane, Australia: $17.60 / hour 16
  • 17.
    Modelling – Valueof Expected Travel Time Savings • Value of Expected Travel Time Savings (VETTS) – $9.63 / hour • VETTS result is more than 50% less than in other cities • Reason for difference – VETTS identified is specific to Carshare Users – Carshare Users are suspected of having lower VETTS compared to average motorist • Cannot be used as a representative sample group 17
  • 18.
    Further Studies • Riskaversion – Travel times are stochastic – Need to include risk parameter • Model including risk parameter is ongoing – Risk models considered: • Constant Absolute Risk Aversion (CARA) • Constant Relative Risk Aversion (CRRA) • Ongoing / Not yet finalised 18
  • 19.