The Cost of Bad (And Clean) Data
•
43 likes•13,396 views

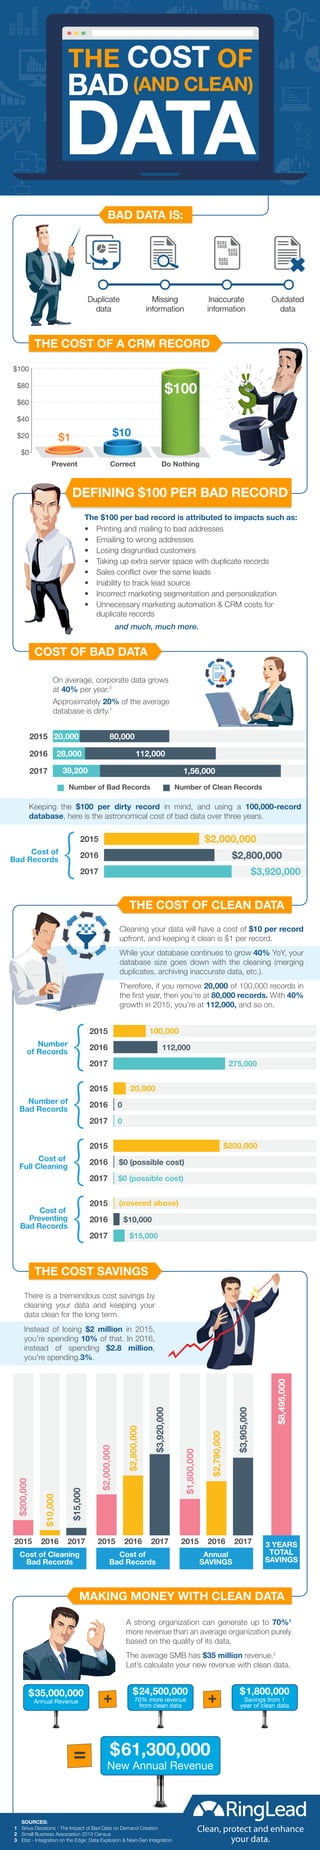
Bad data can cost you millions of dollars, while clean data can earn you tons of revenue. Learn the facts in this infographic.
Recommended

Recommended
More Related Content
Viewers also liked
Viewers also liked (14)
Similar to The Cost of Bad (And Clean) Data
Similar to The Cost of Bad (And Clean) Data (20)
More from RingLead
More from RingLead (20)
Recently uploaded
Recently uploaded (20)
The Cost of Bad (And Clean) Data
- 1. 2015 2016 2017 $2,800,000 $3,920,000 Cost of Bad Records $2,000,000 2015 2016 2017 112,000 275,000 Number of Records 100,000 2015 2016 2017 0 0 Number of Bad Records 20,000 2015 2016 2017 $0 (possible cost) $0 (possible cost) Cost of Full Cleaning $200,000 Cost of Preventing Bad Records BAD DATA IS: THE COST OF BAD(AND CLEAN) DATA SOURCES: 1 Sirius Decisions - The Impact of Bad Data on Demand Creation 2 Small Business Association 2013 Census 3 Ebiz - Integration on the Edge: Data Explosion & Next-Gen Integration Clean, protect and enhance your data. Duplicate data Missing information Inaccurate information Outdated data THE COST OF A CRM RECORD COST OF BAD DATA THE COST SAVINGS Prevent $1 $10 $100 Correct Do Nothing $100 $80 $60 $40 $20 $0 DEFINING $100 PER BAD RECORD • Printing and mailing to bad addresses • Emailing to wrong addresses • Losing disgruntled customers • Taking up extra server space with duplicate records • Sales conflict over the same leads • Inability to track lead source • Incorrect marketing segmentation and personalization • Unnecessary marketing automation & CRM costs for duplicate records On average, corporate data grows at 40% per year.3 Approximately 20% of the average database is dirty.1 Keeping the $100 per dirty record in mind, and using a 100,000-record database, here is the astronomical cost of bad data over three years. There is a tremendous cost savings by cleaning your data and keeping your data clean for the long term. Instead of losing $2 million in 2015, you’re spending 10% of that. In 2016, instead of spending $2.8 million, you’re spending.3%. Cleaning your data will have a cost of $10 per record upfront, and keeping it clean is $1 per record. While your database continues to grow 40% YoY, your database size goes down with the cleaning (merging duplicates, archiving inaccurate data, etc.). Therefore, if you remove 20,000 of 100,000 records in the first year, then you’re at 80,000 records. With 40% growth in 2015, you’re at 112,000, and so on. A strong organization can generate up to 70%1 more revenue than an average organization purely based on the quality of its data. The average SMB has $35 million revenue.2 Let’s calculate your new revenue with clean data. and much, much more. The $100 per bad record is attributed to impacts such as: THE COST OF CLEAN DATA MAKING MONEY WITH CLEAN DATA 2015 2016 2017 $10,000 (covered above) $15,000 2015 2016 2017 $200,000 $10,000 $15,000 Cost of Cleaning Bad Records 2015 2016 2017 $2,000,000 $2,800,000 $3,920,000 2015 2016 2017 $1,800,000 $2,790,000 $3,905,000 Annual SAVINGS $8,495,000 Cost of Bad Records +$35,000,000 Annual Revenue + $24,500,000 70% more revenue from clean data $61,300,000 New Annual Revenue $1,800,000 Savings from 1 year of clean data = 3 YEARS TOTAL SAVINGS Number of Bad Records Number of Clean Records 2016 112,00028,000 2017 39,200 1,56,000 2015 80,00020,000