Download to read offline


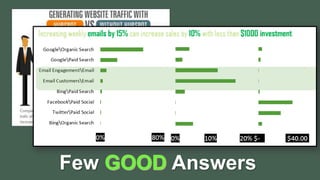


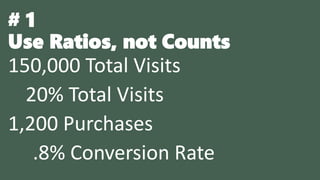
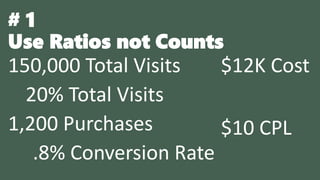
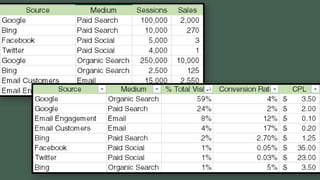


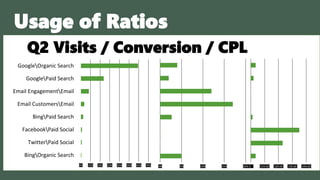
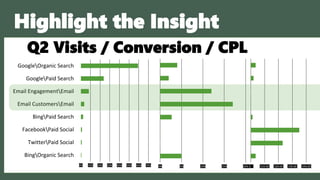
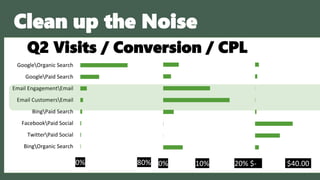
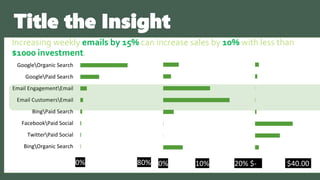
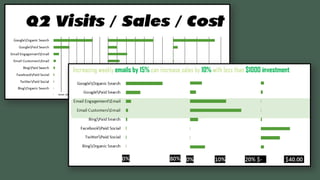


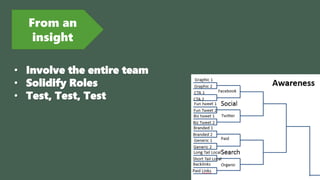


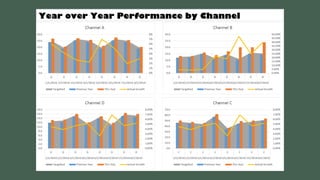
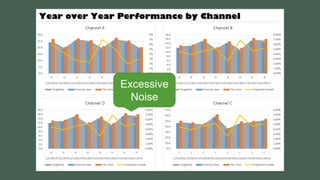

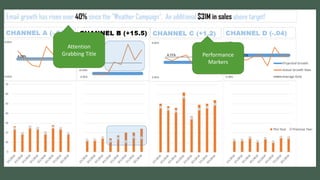
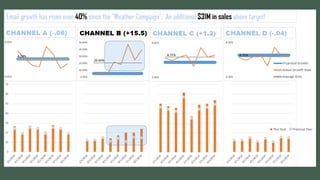
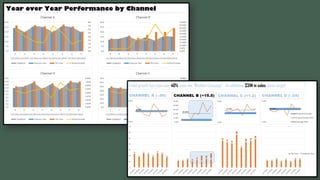


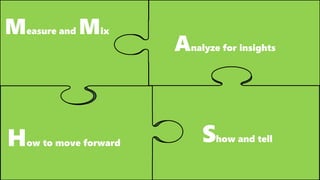


The document discusses the importance of data visualization and effective reporting in marketing analysis, emphasizing the need for metrics that provide actionable insights. It outlines common mistakes in reporting, the significance of using ratios instead of counts, and strategies for enhancing engagement and conversion rates. Additionally, the document highlights the role of teamwork, testing, and data-driven decisions in improving marketing effectiveness and overall performance.


