Downloaded 502 times


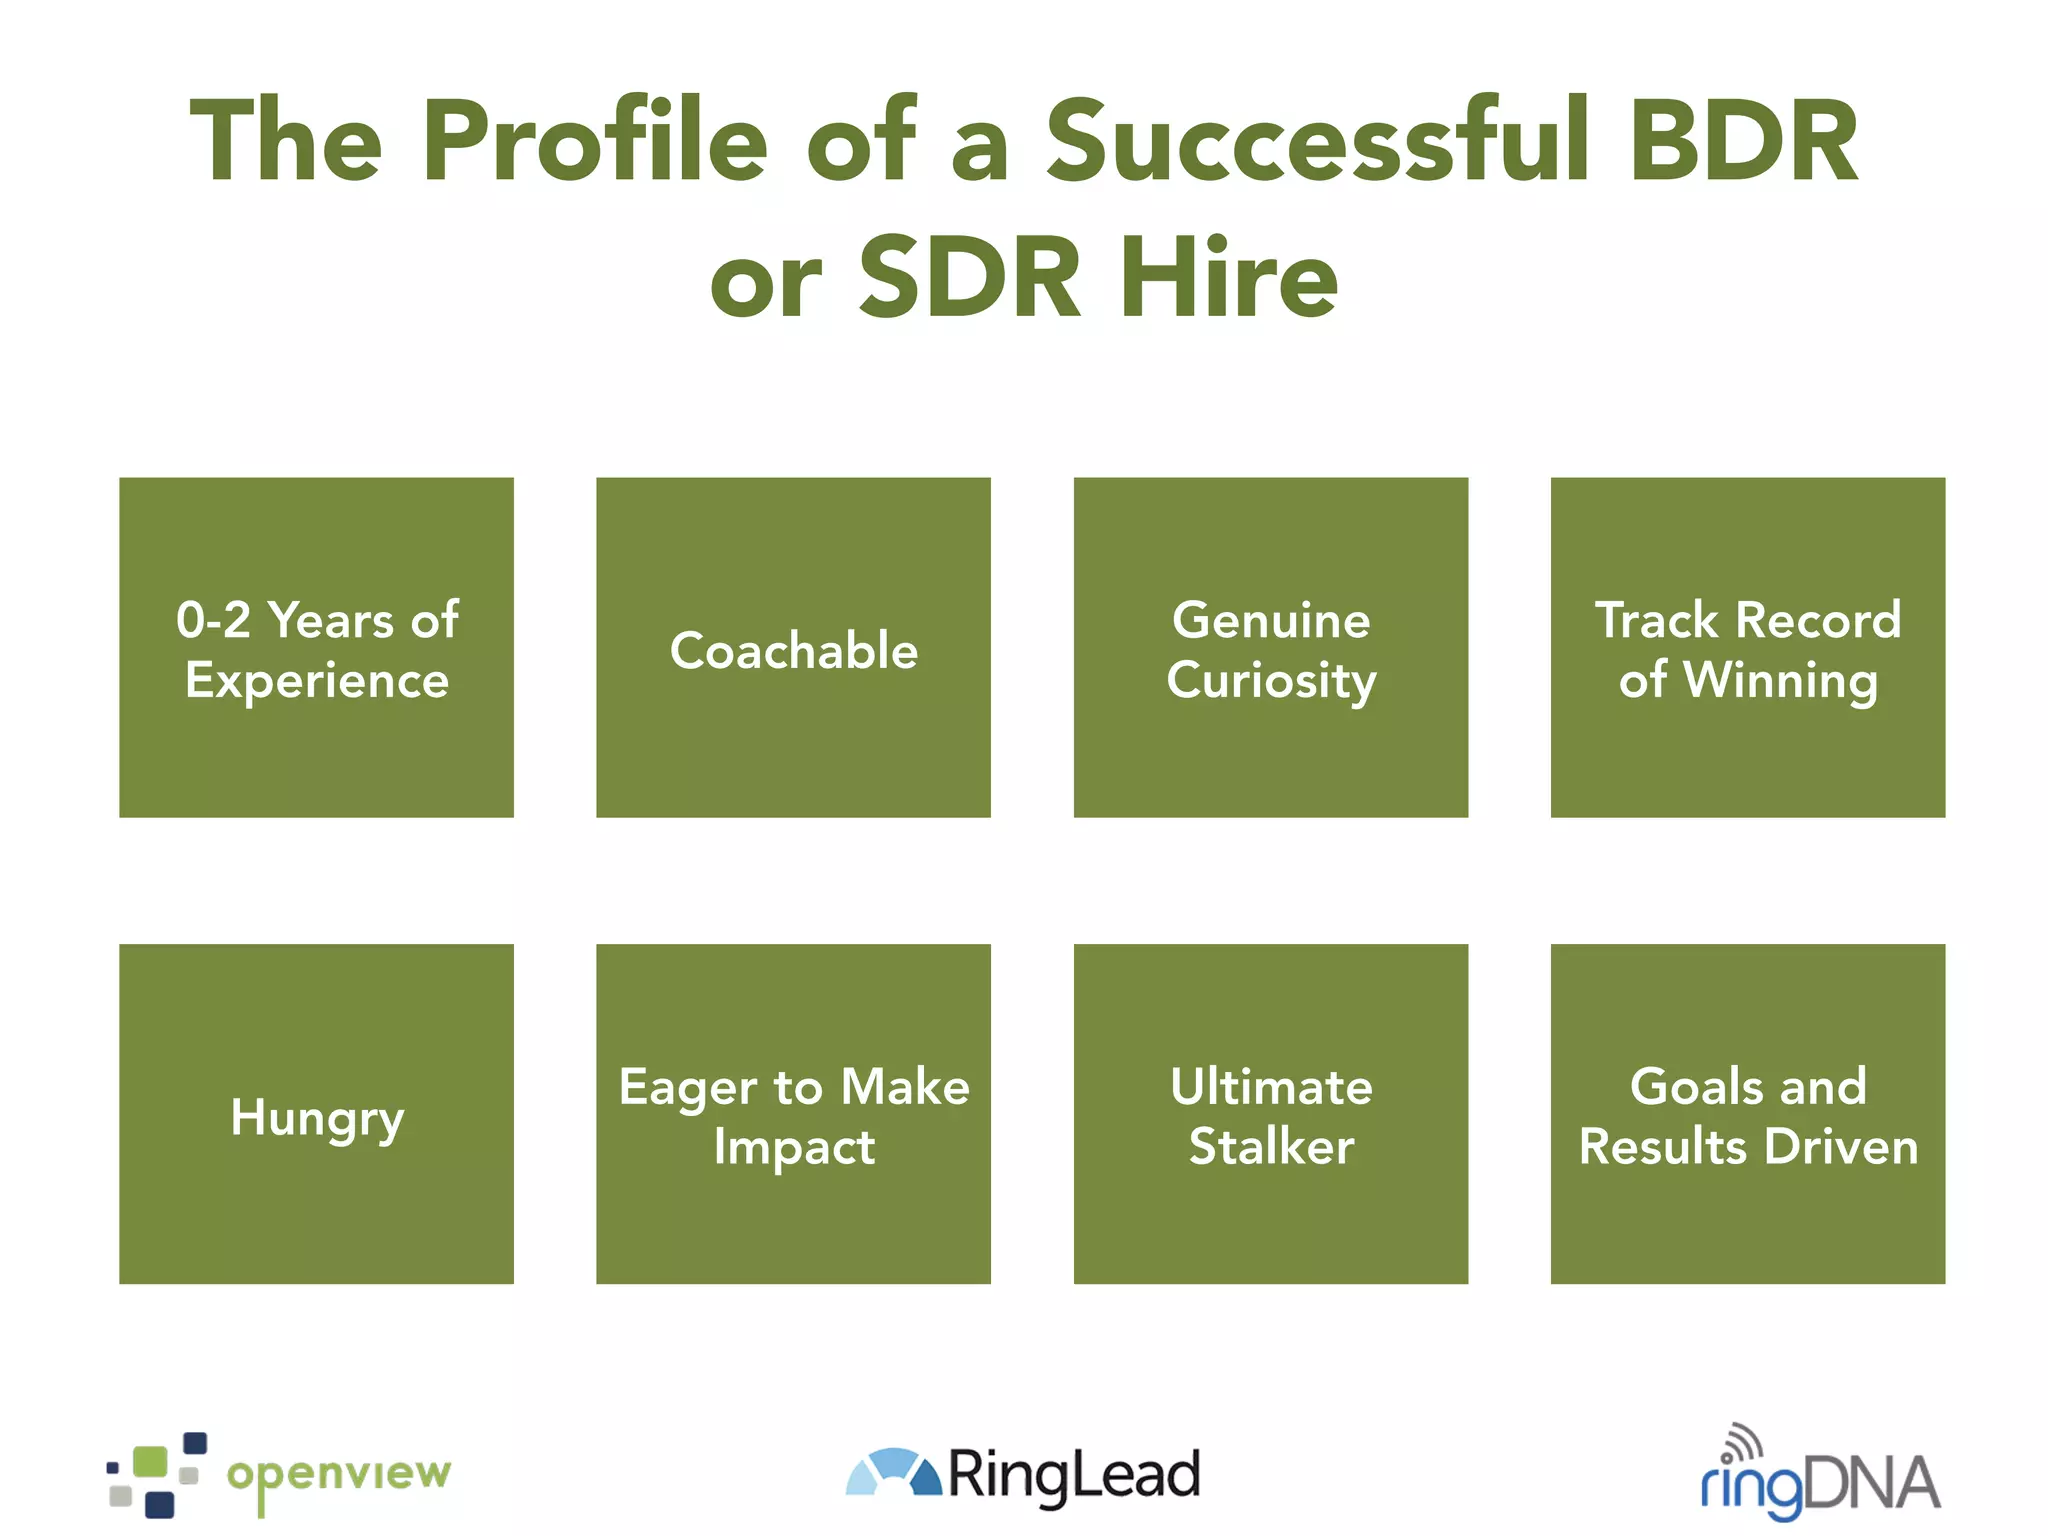


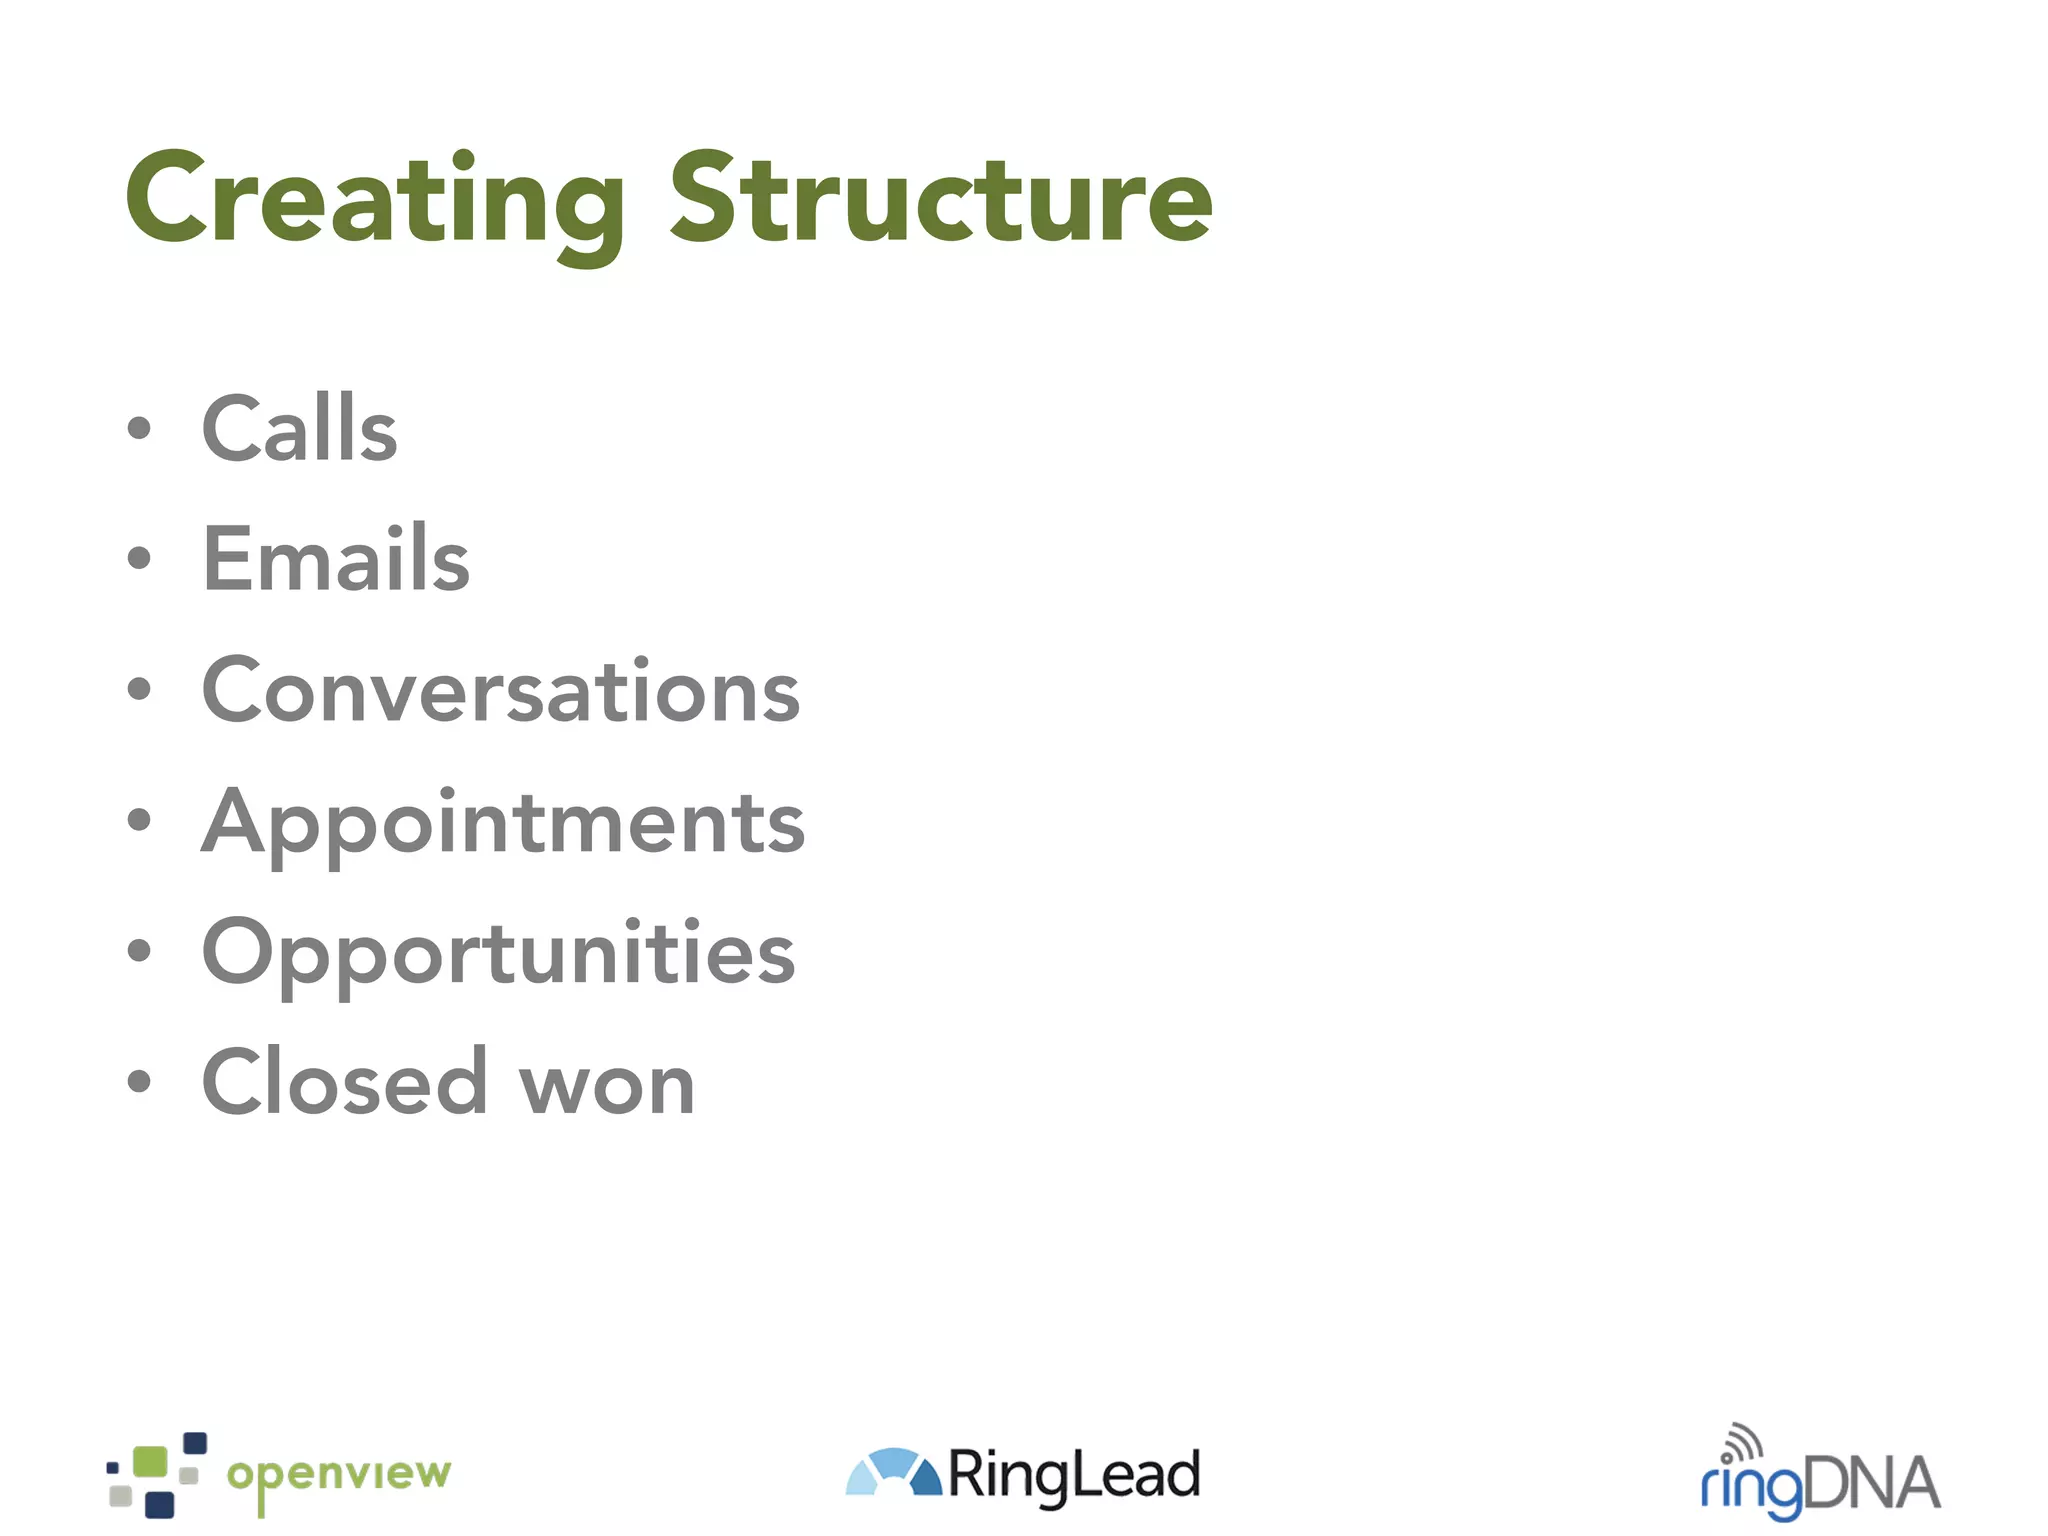

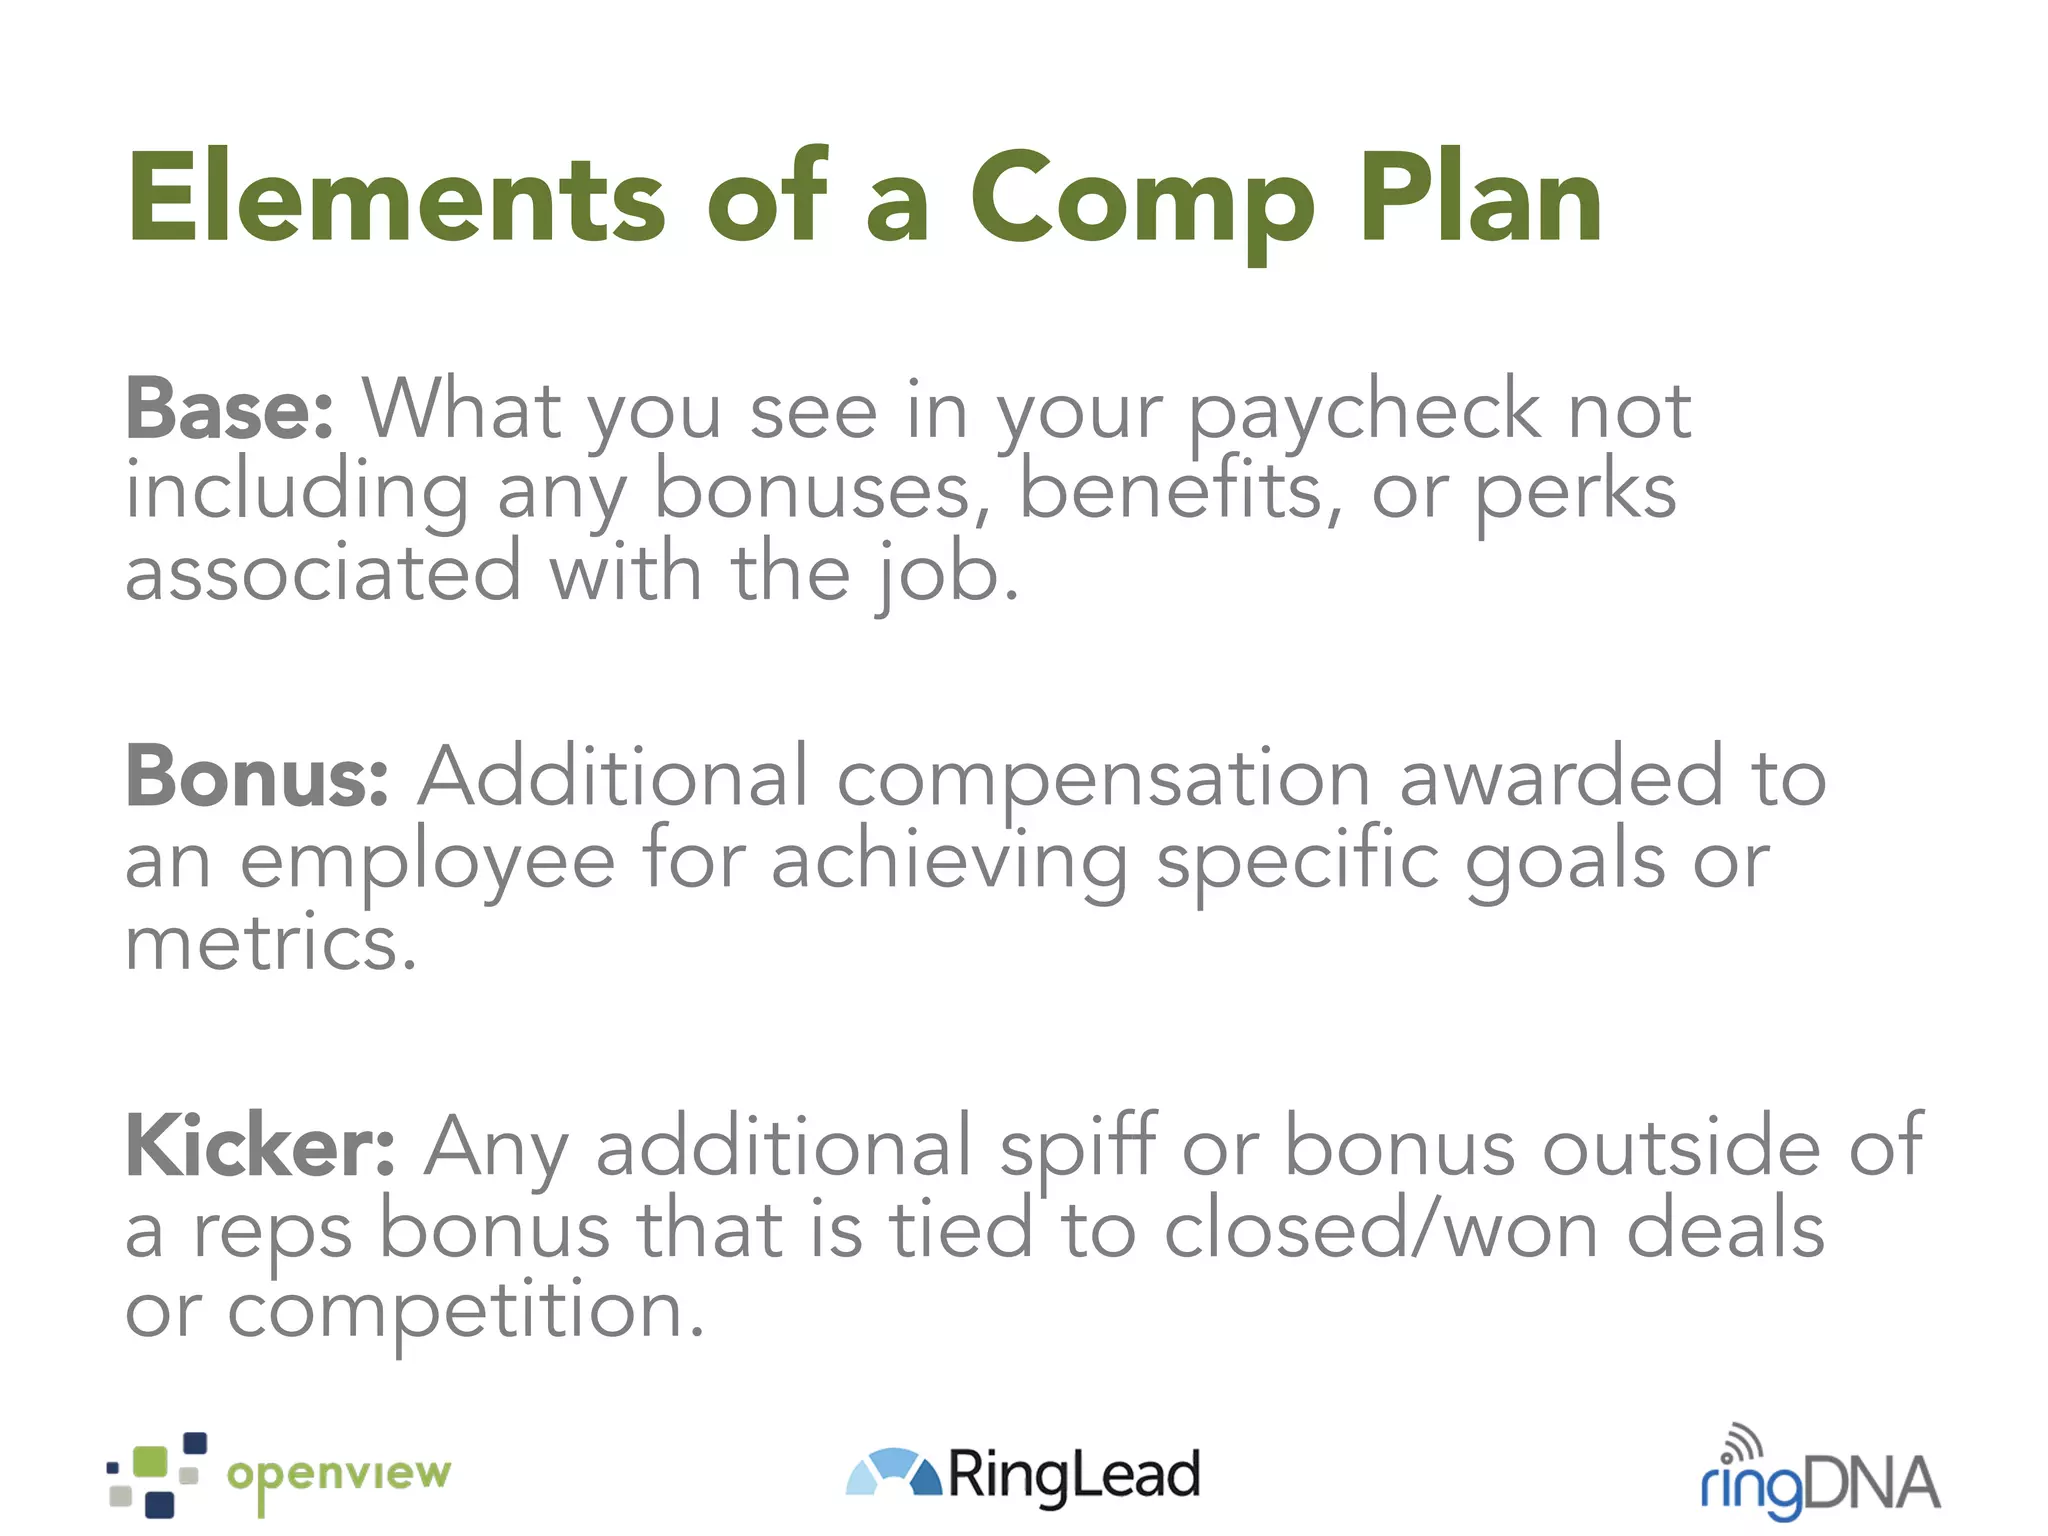
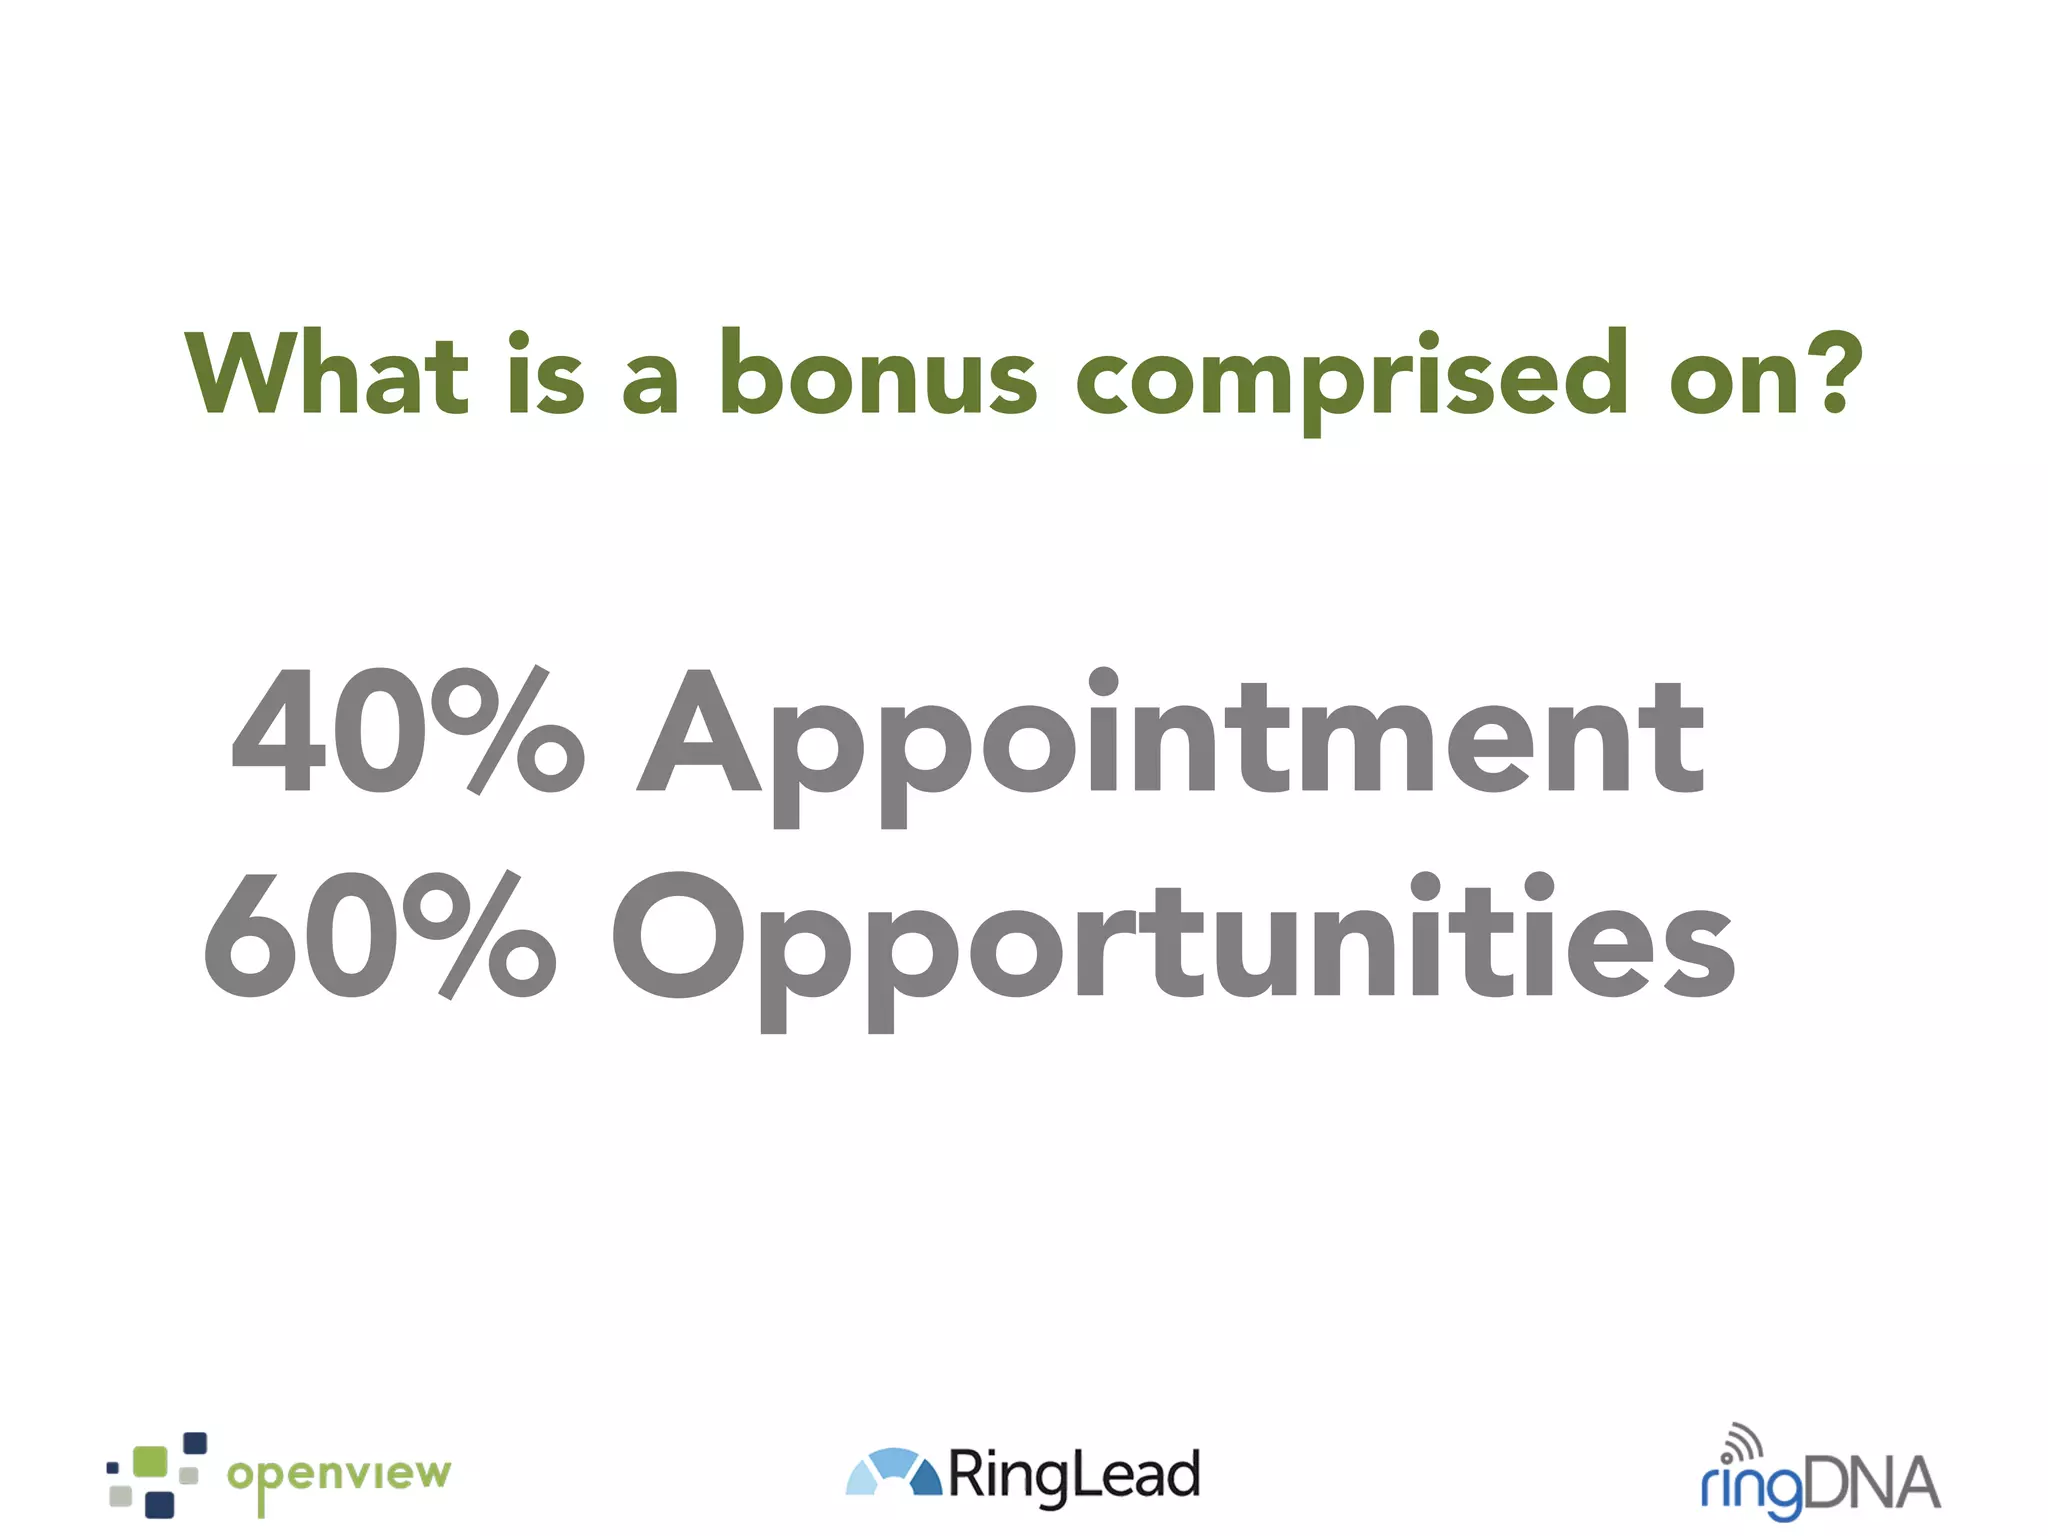
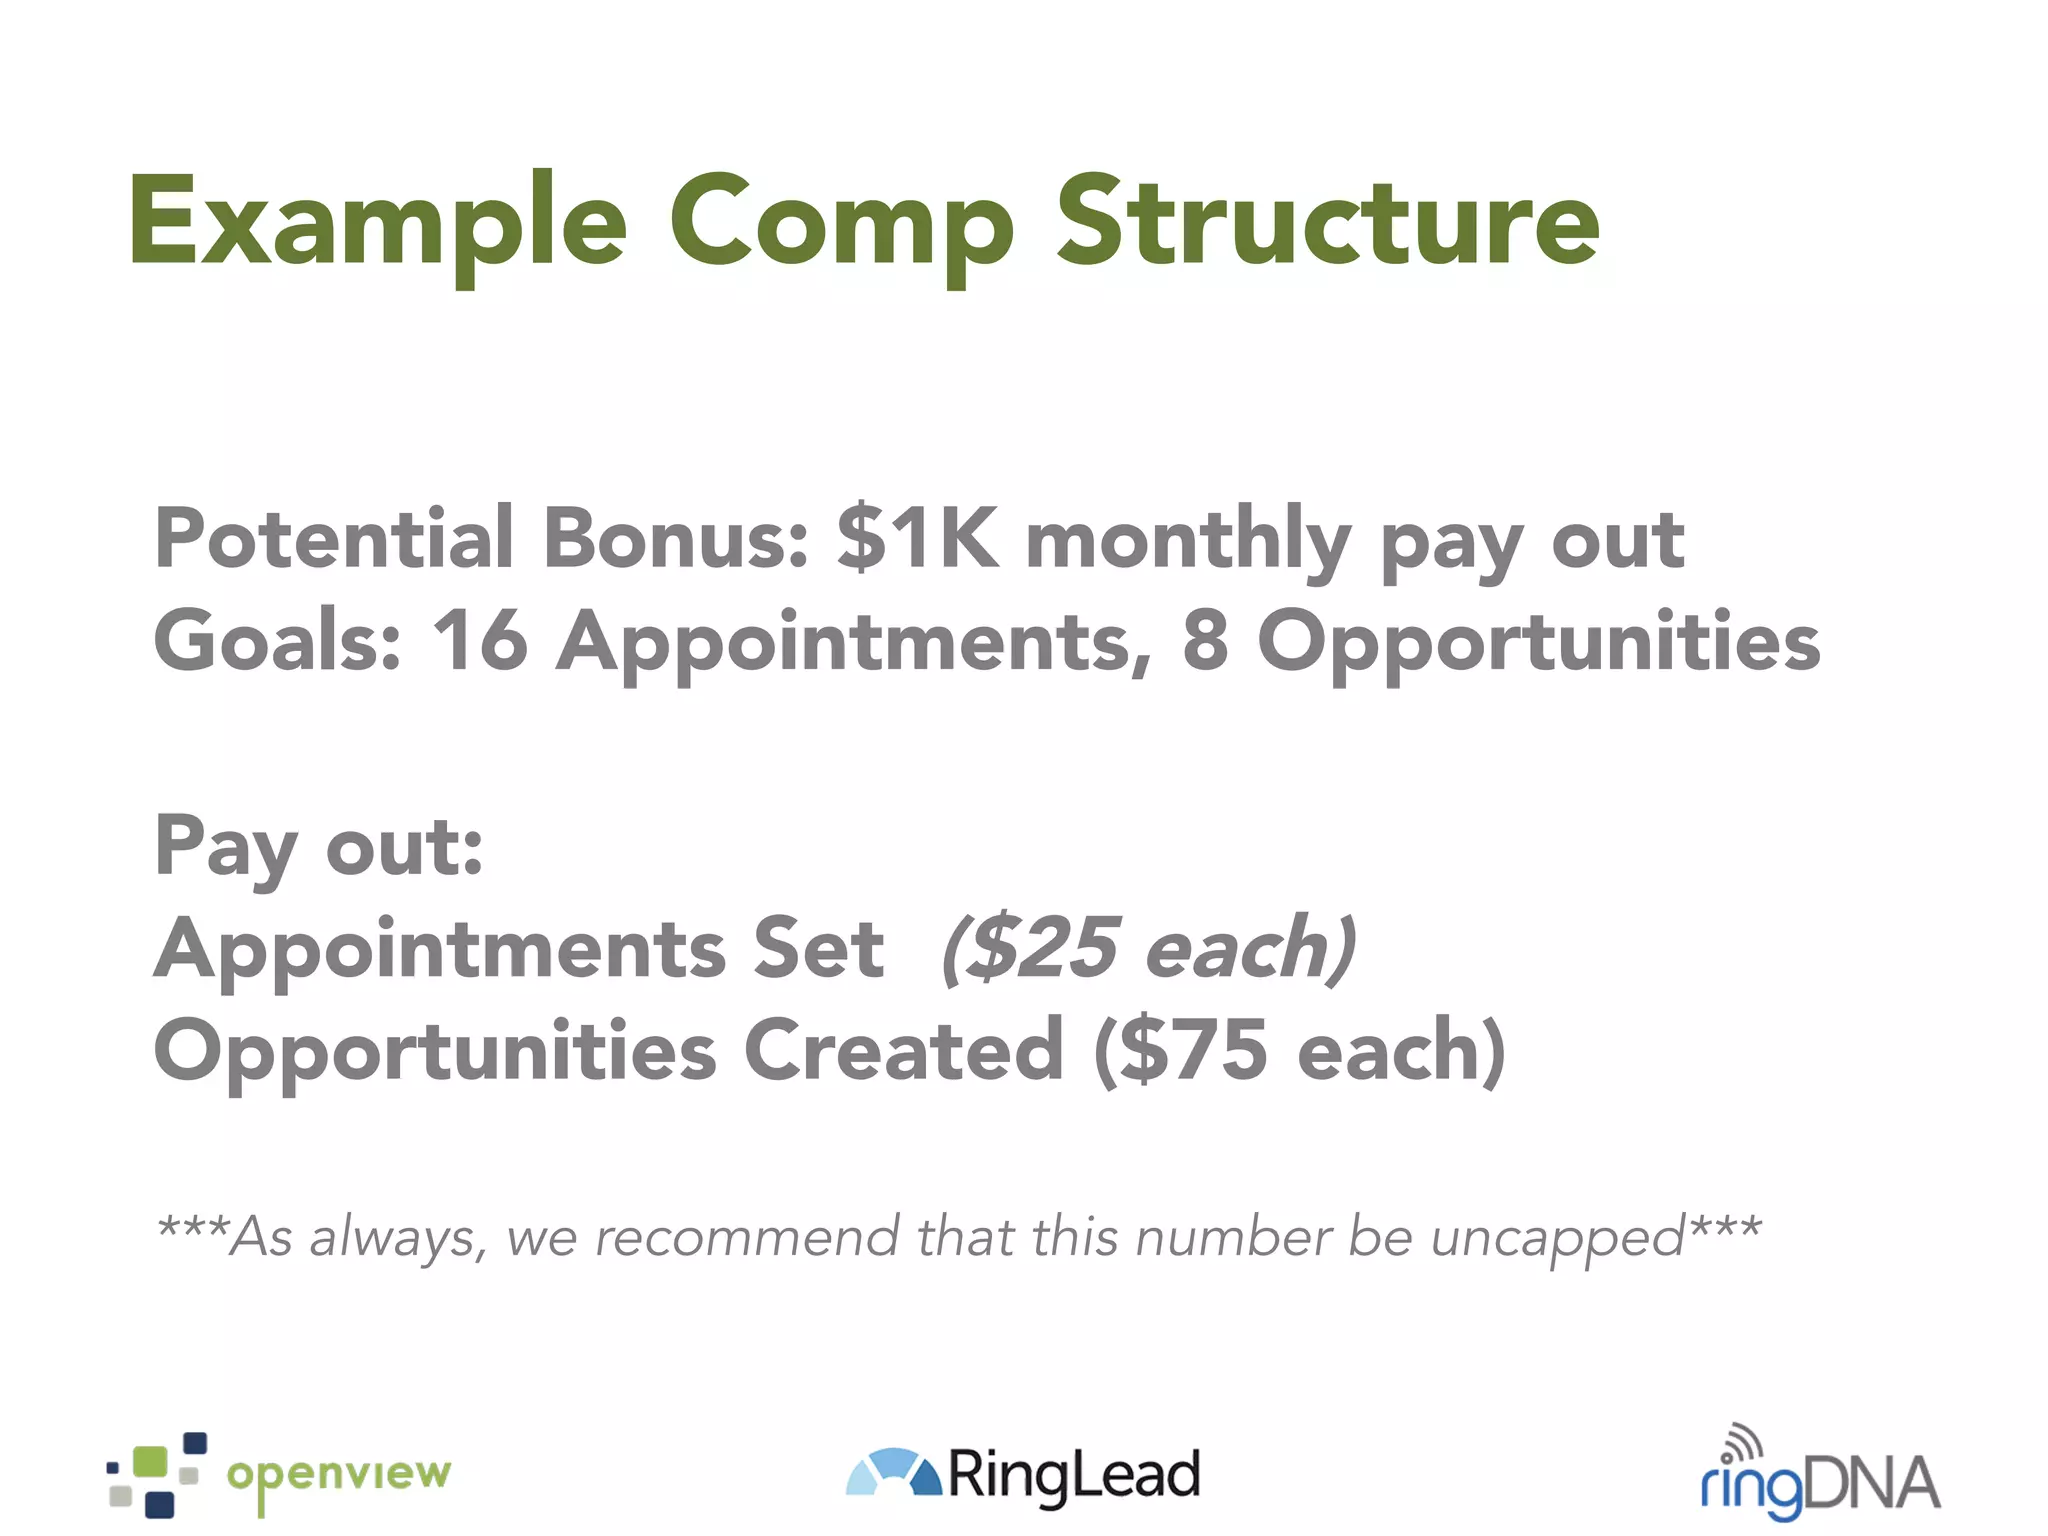
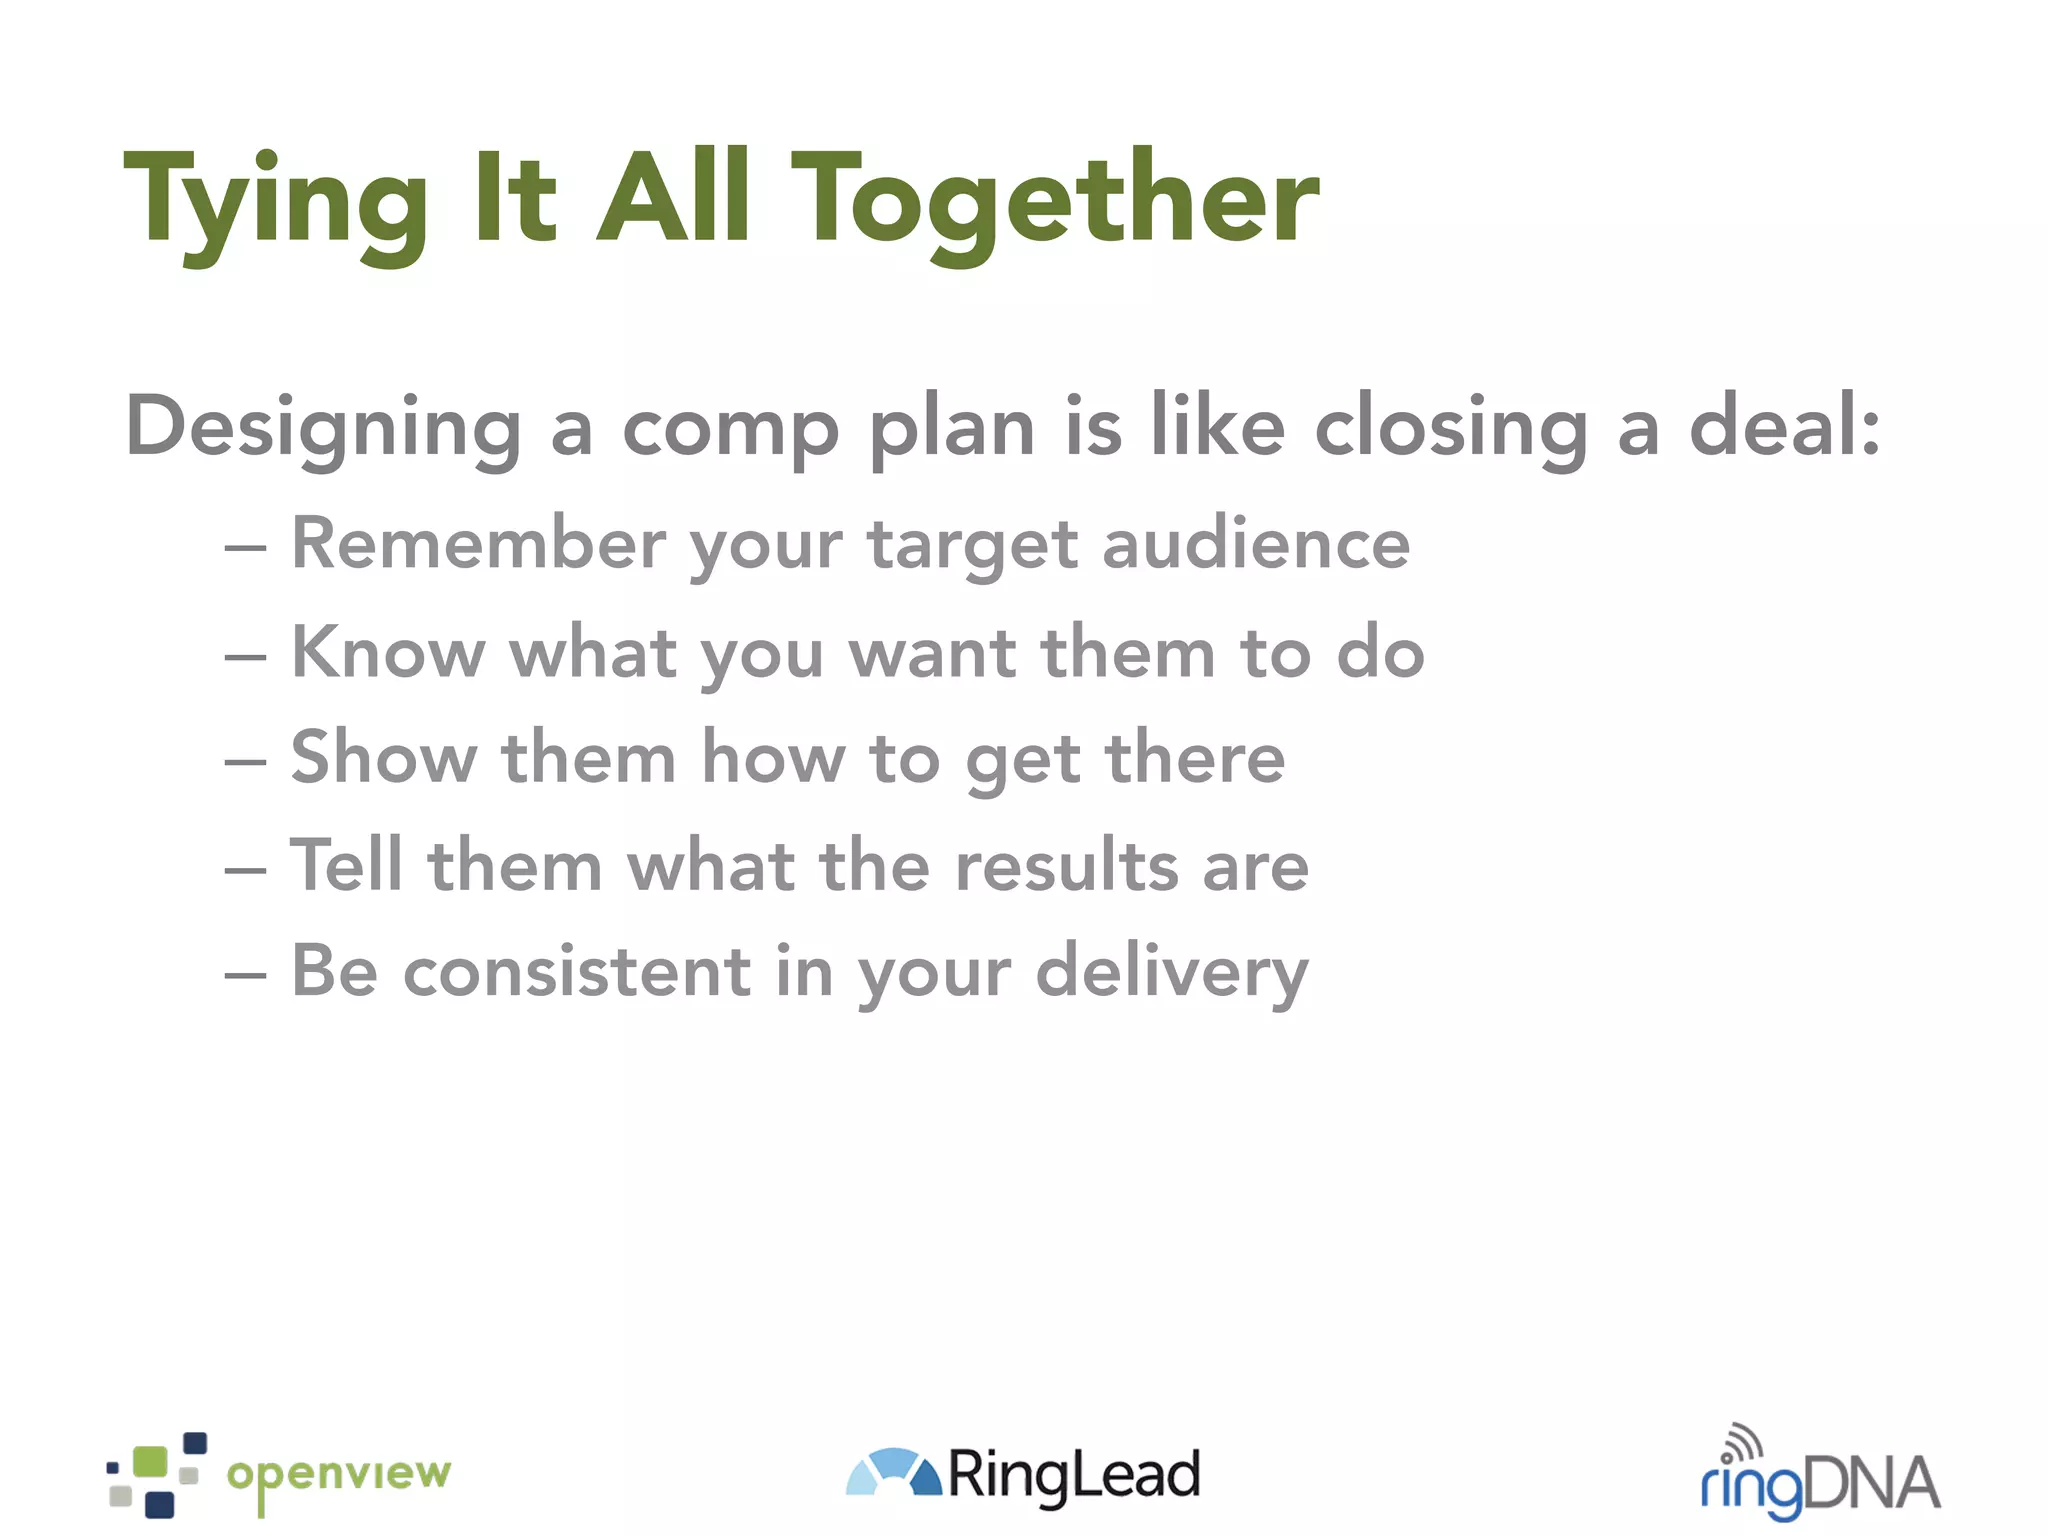


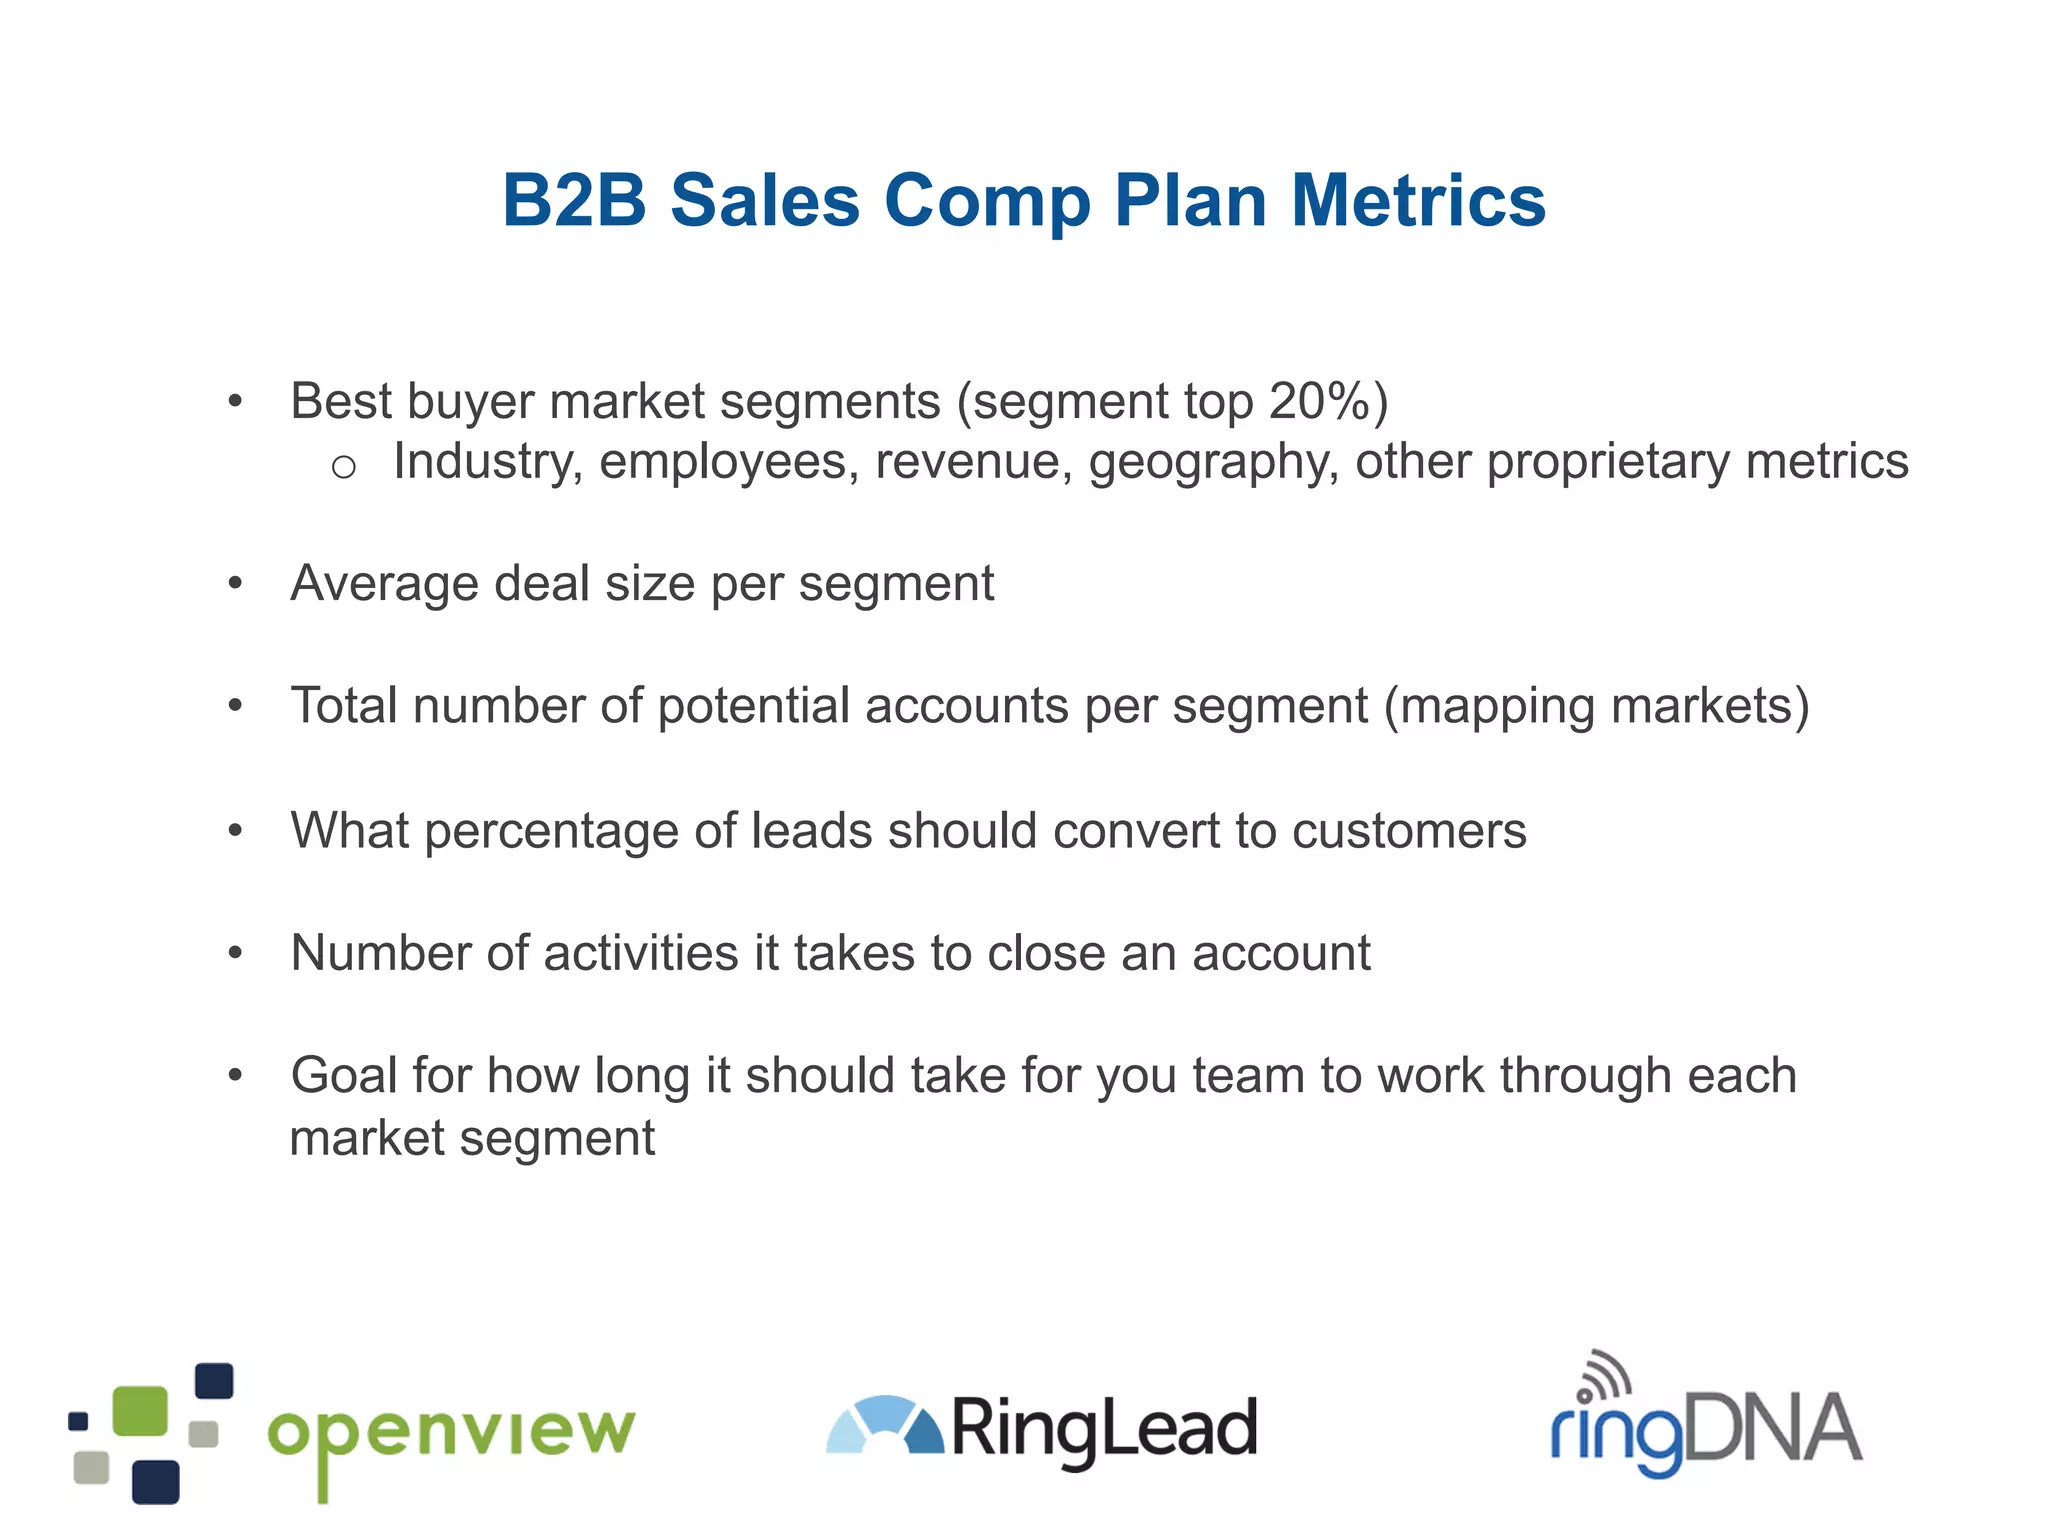
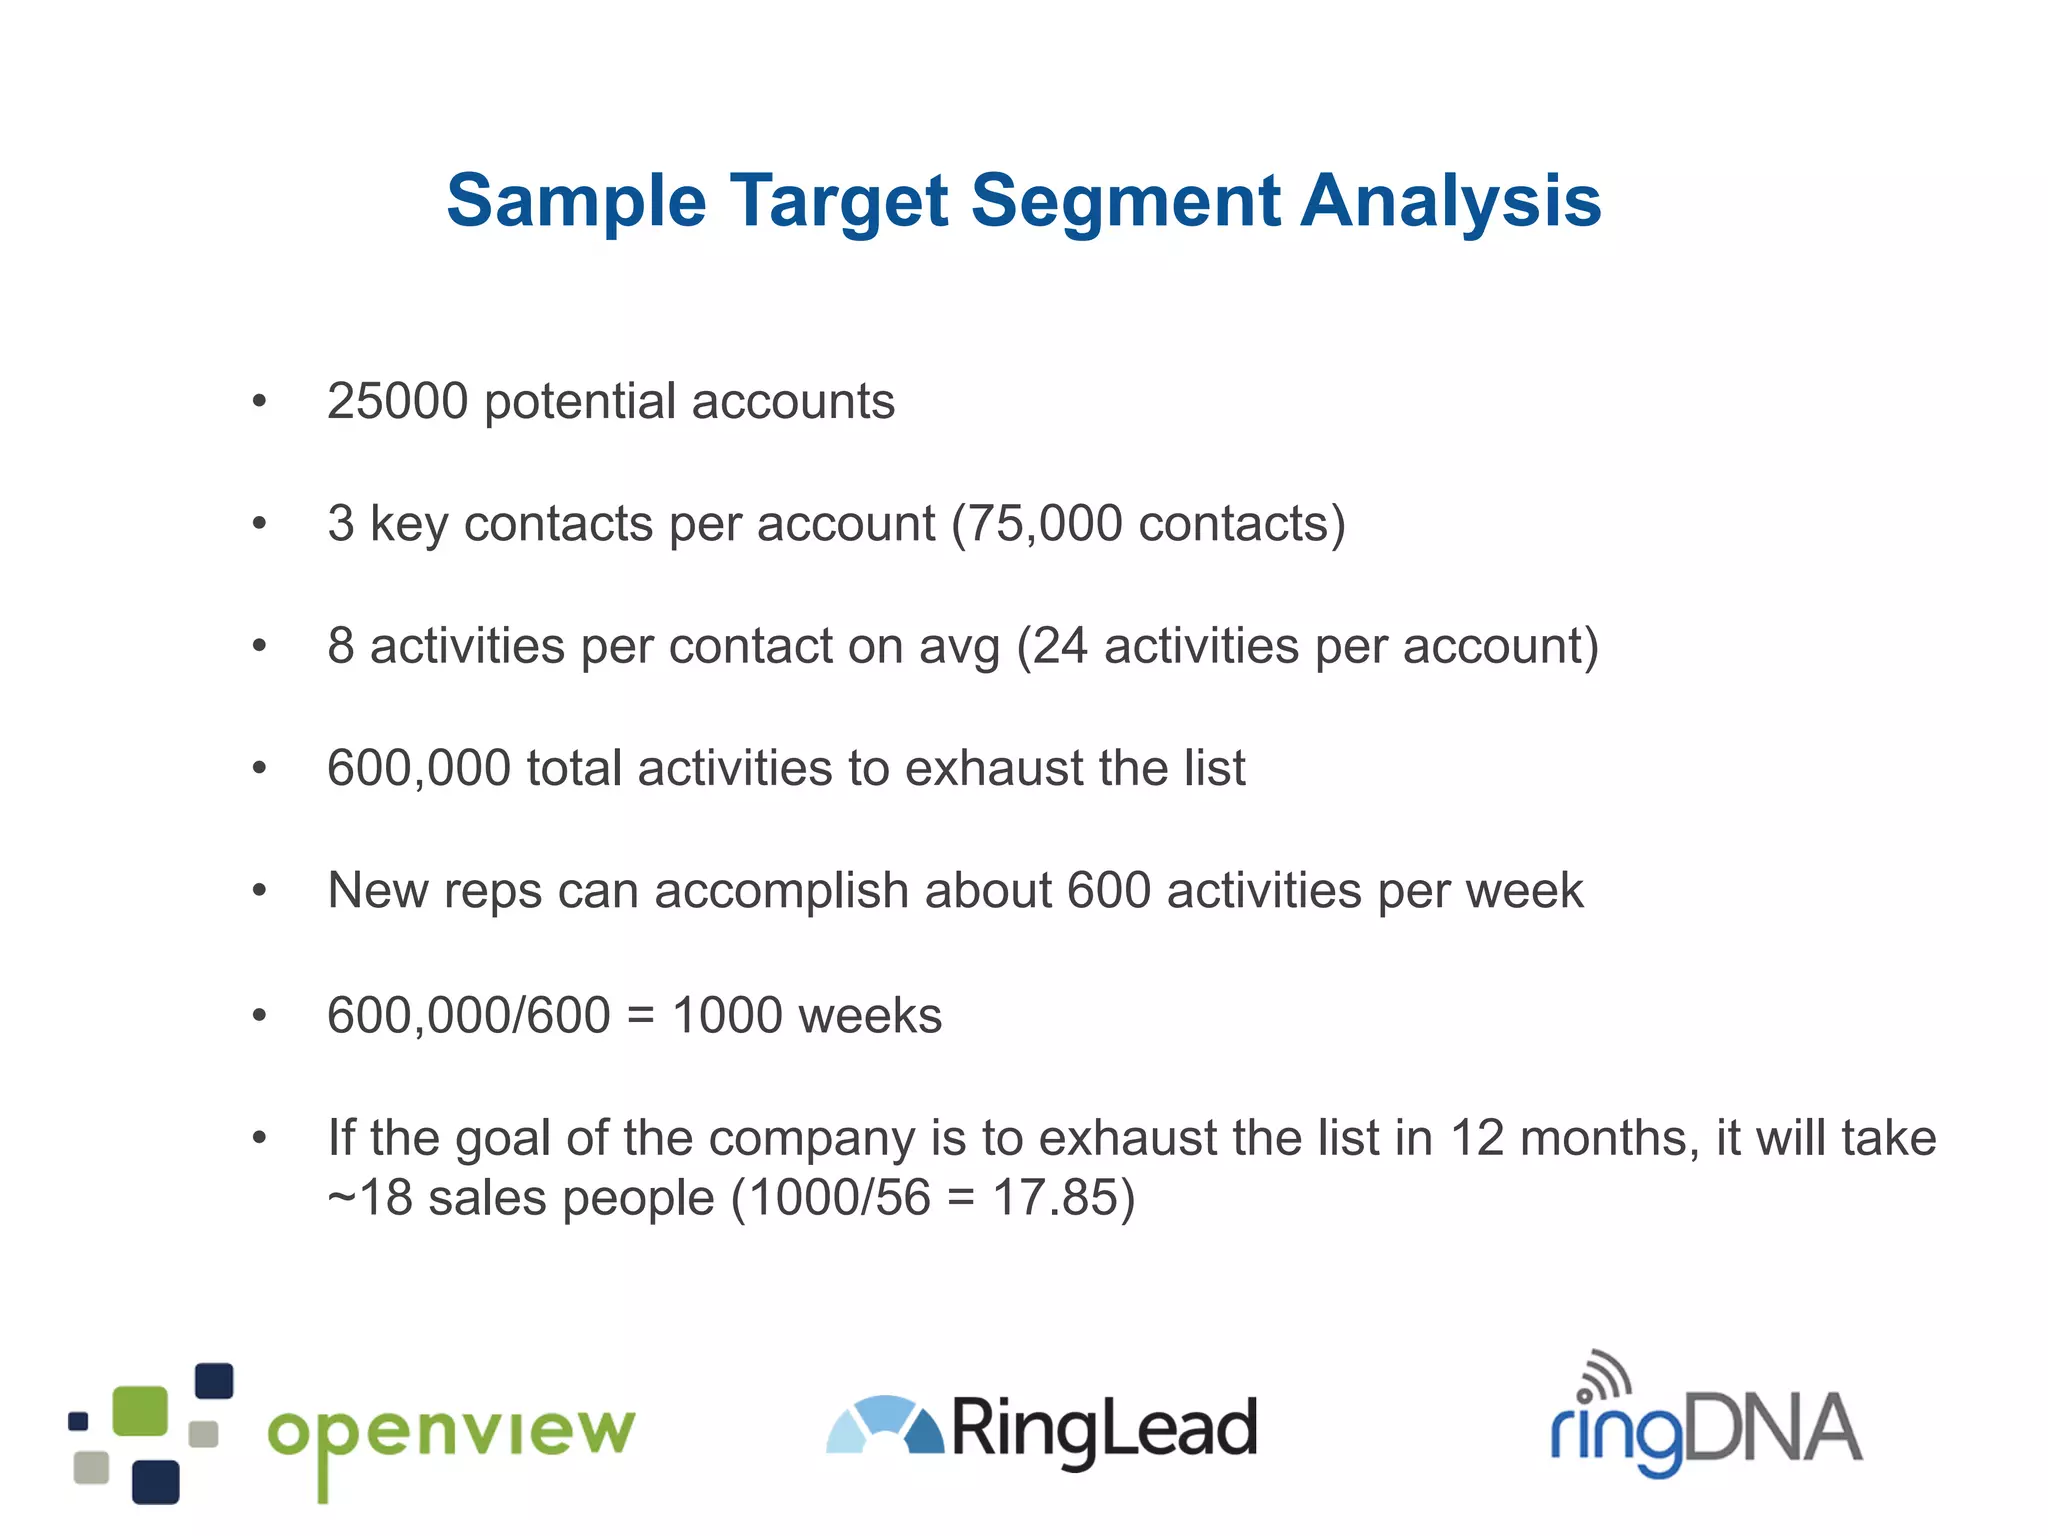
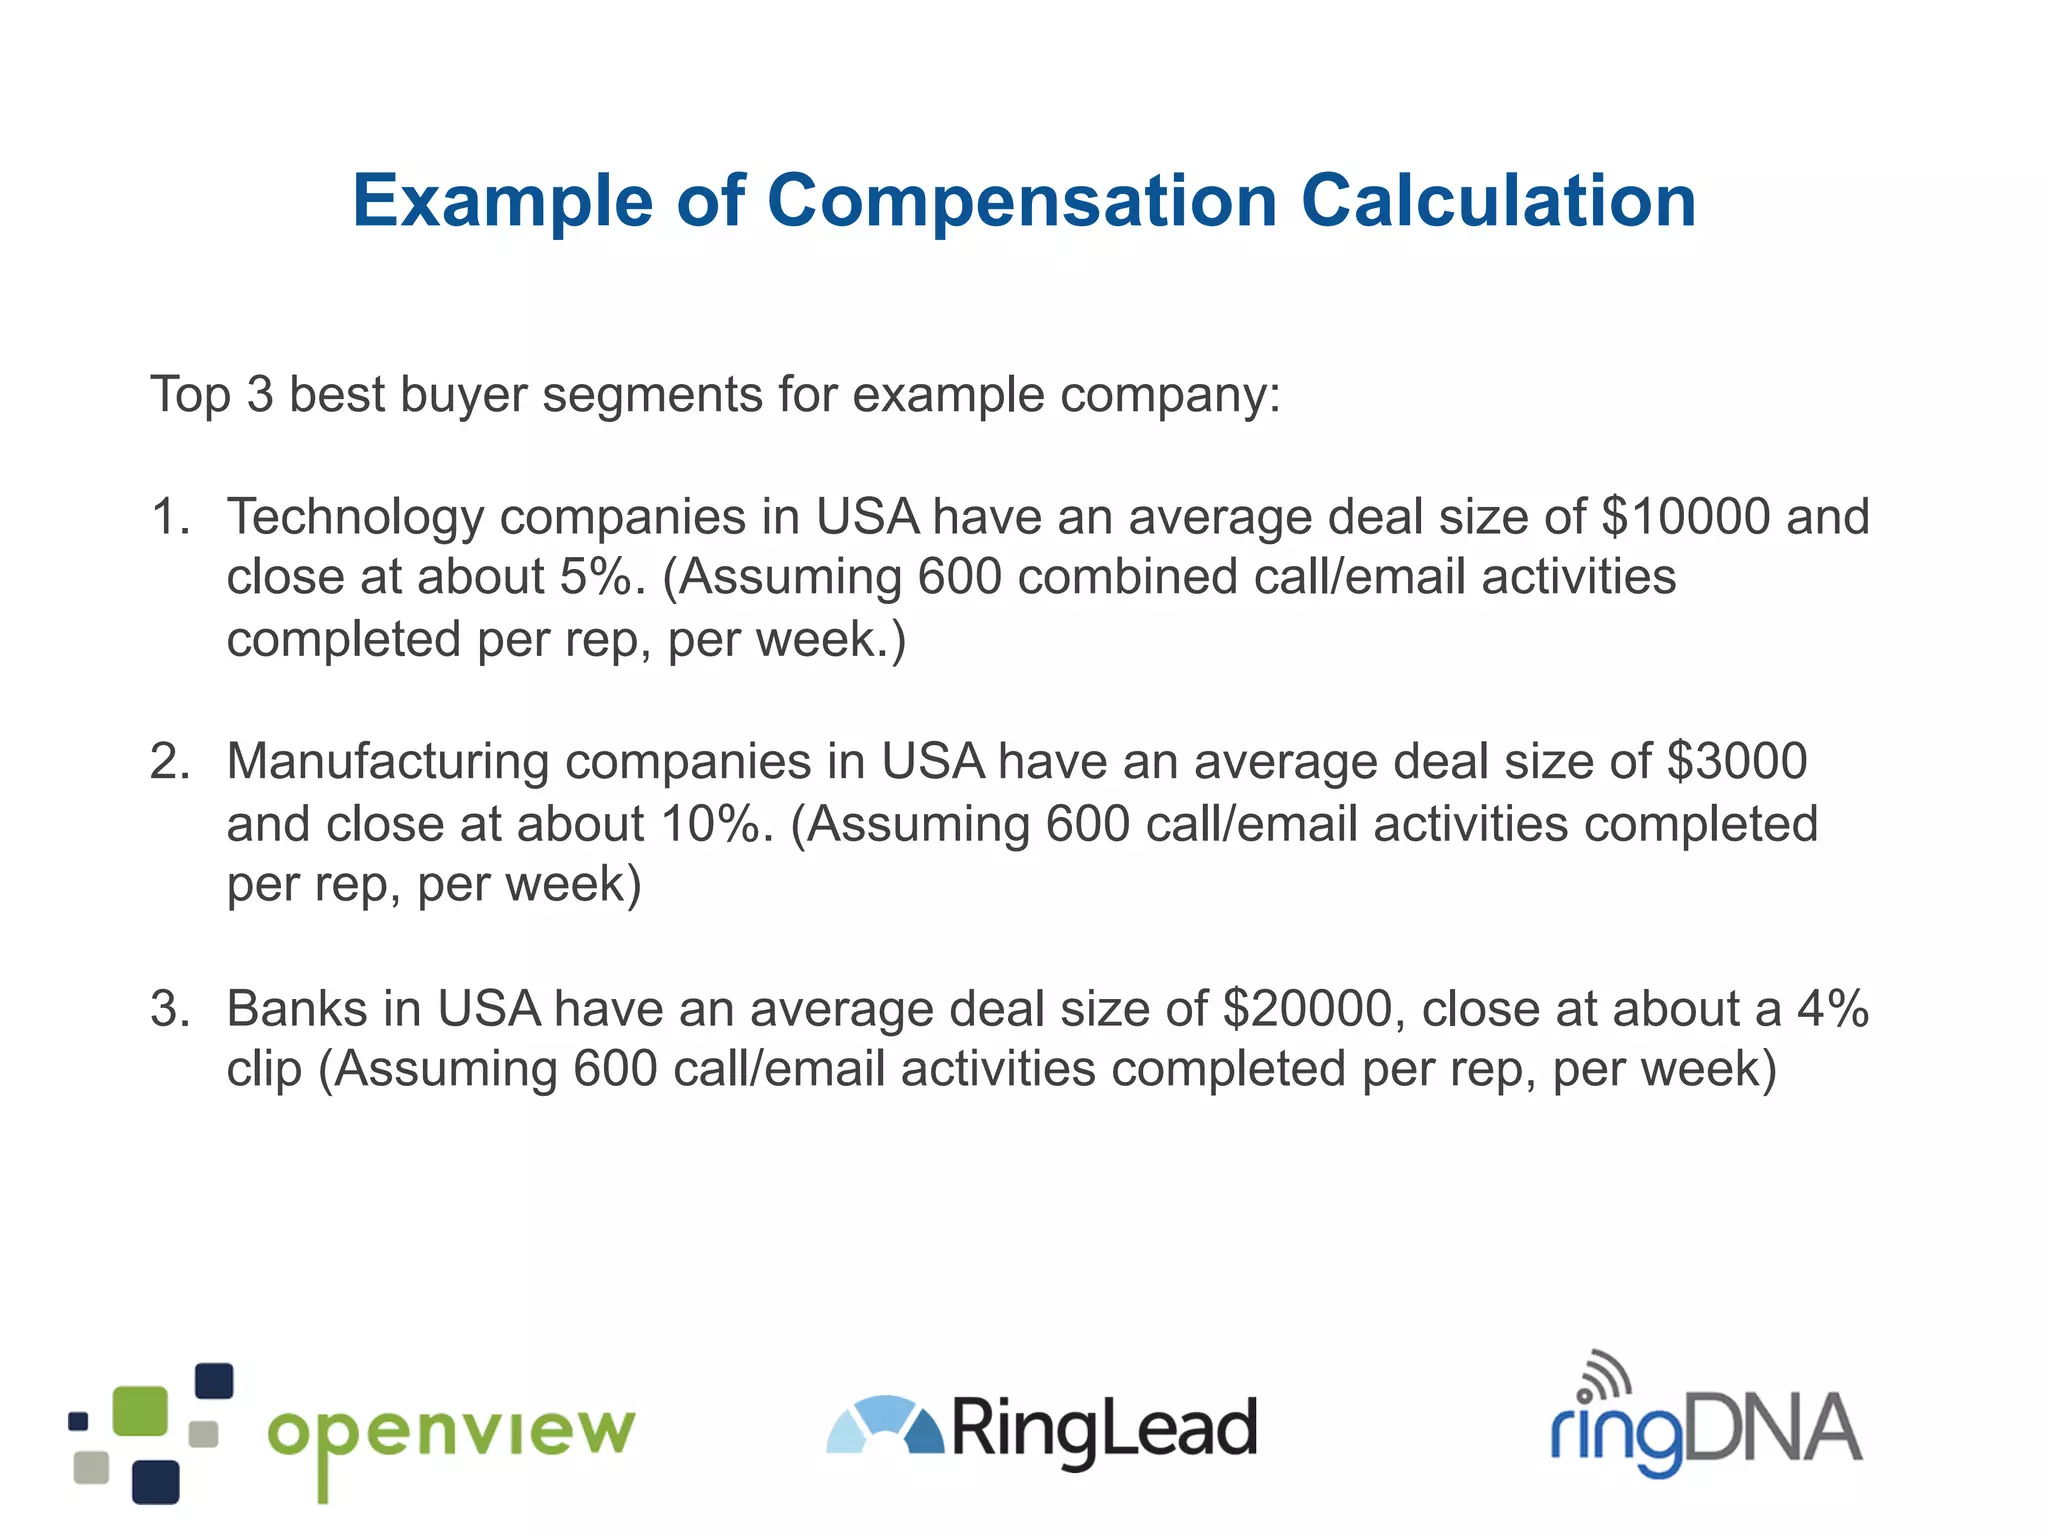
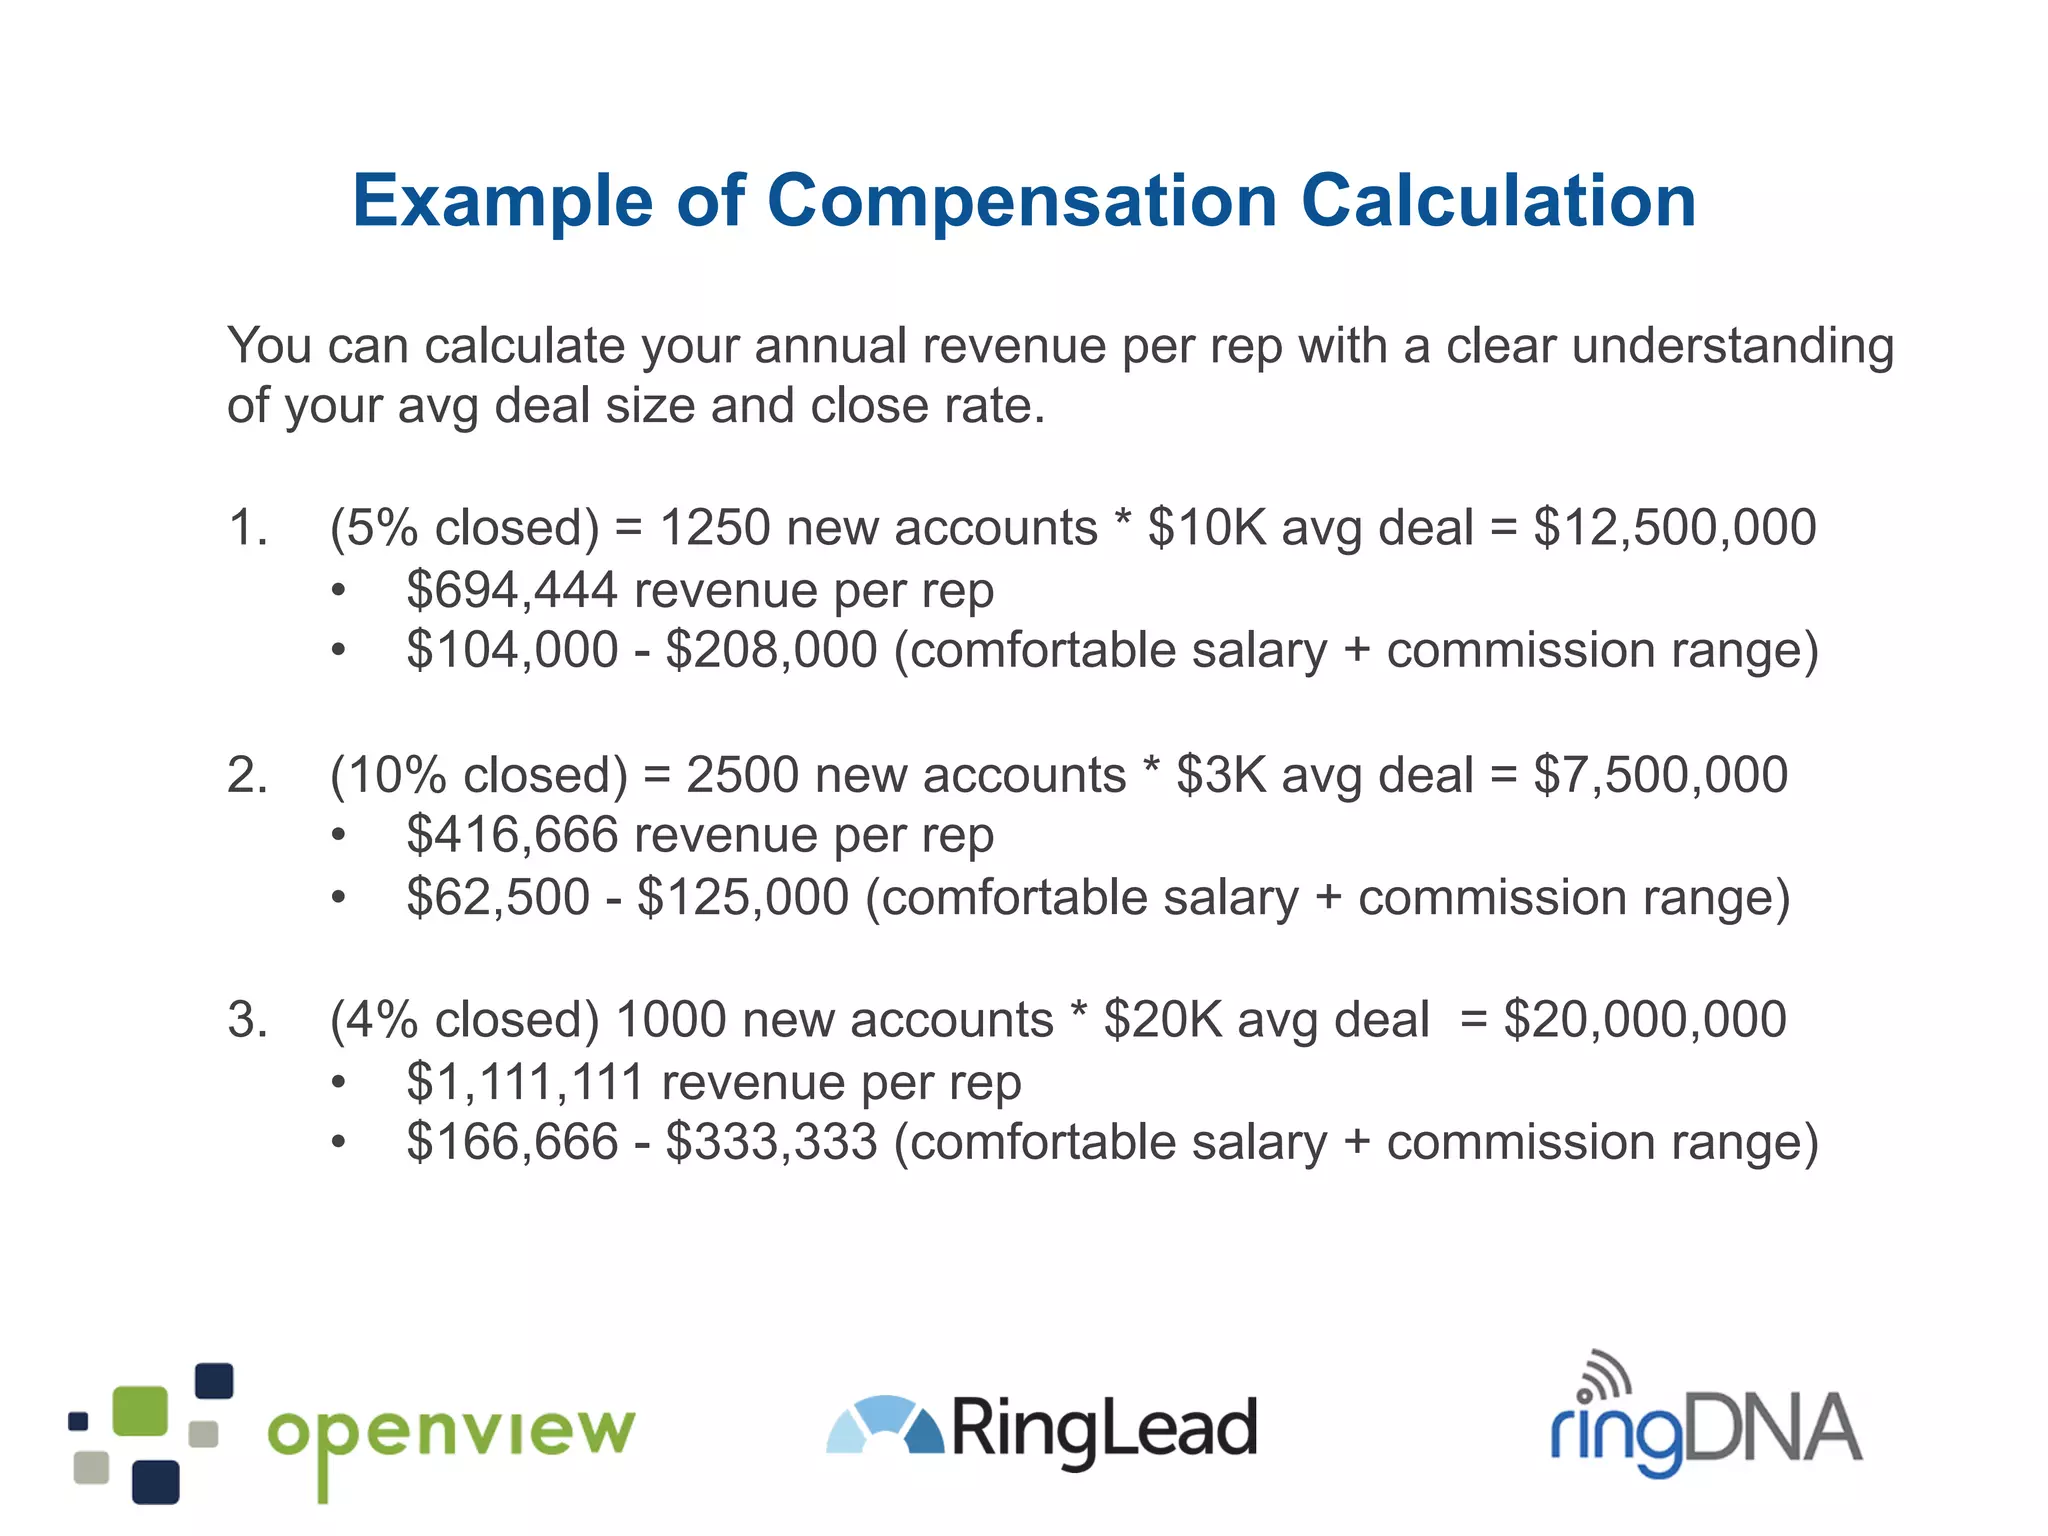


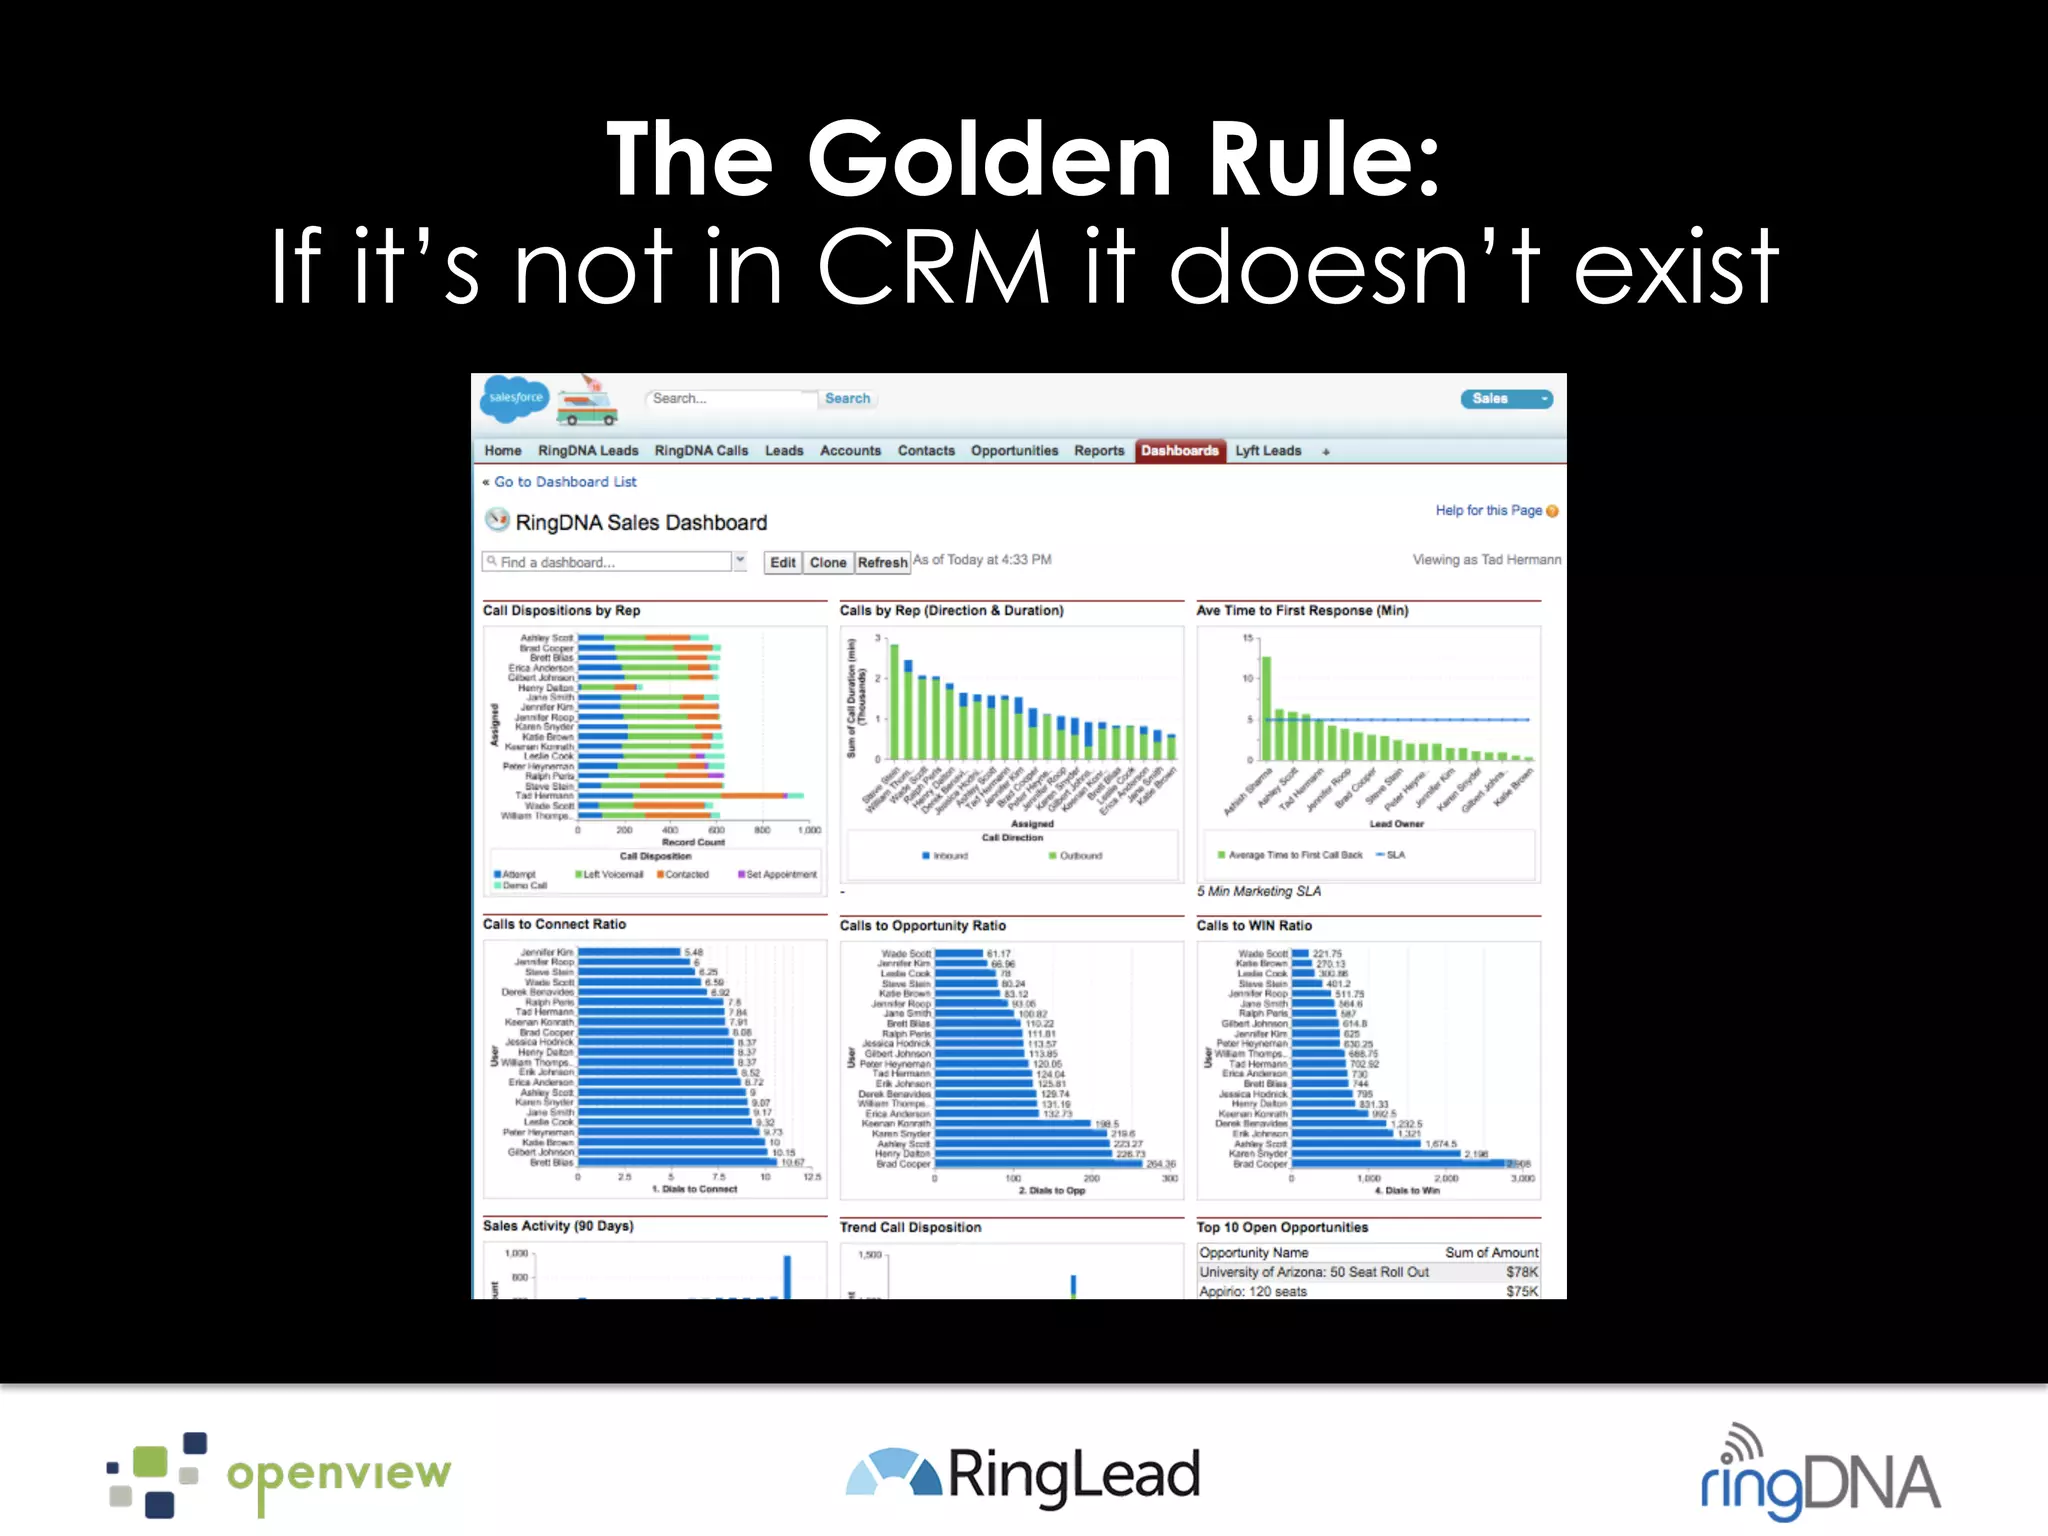
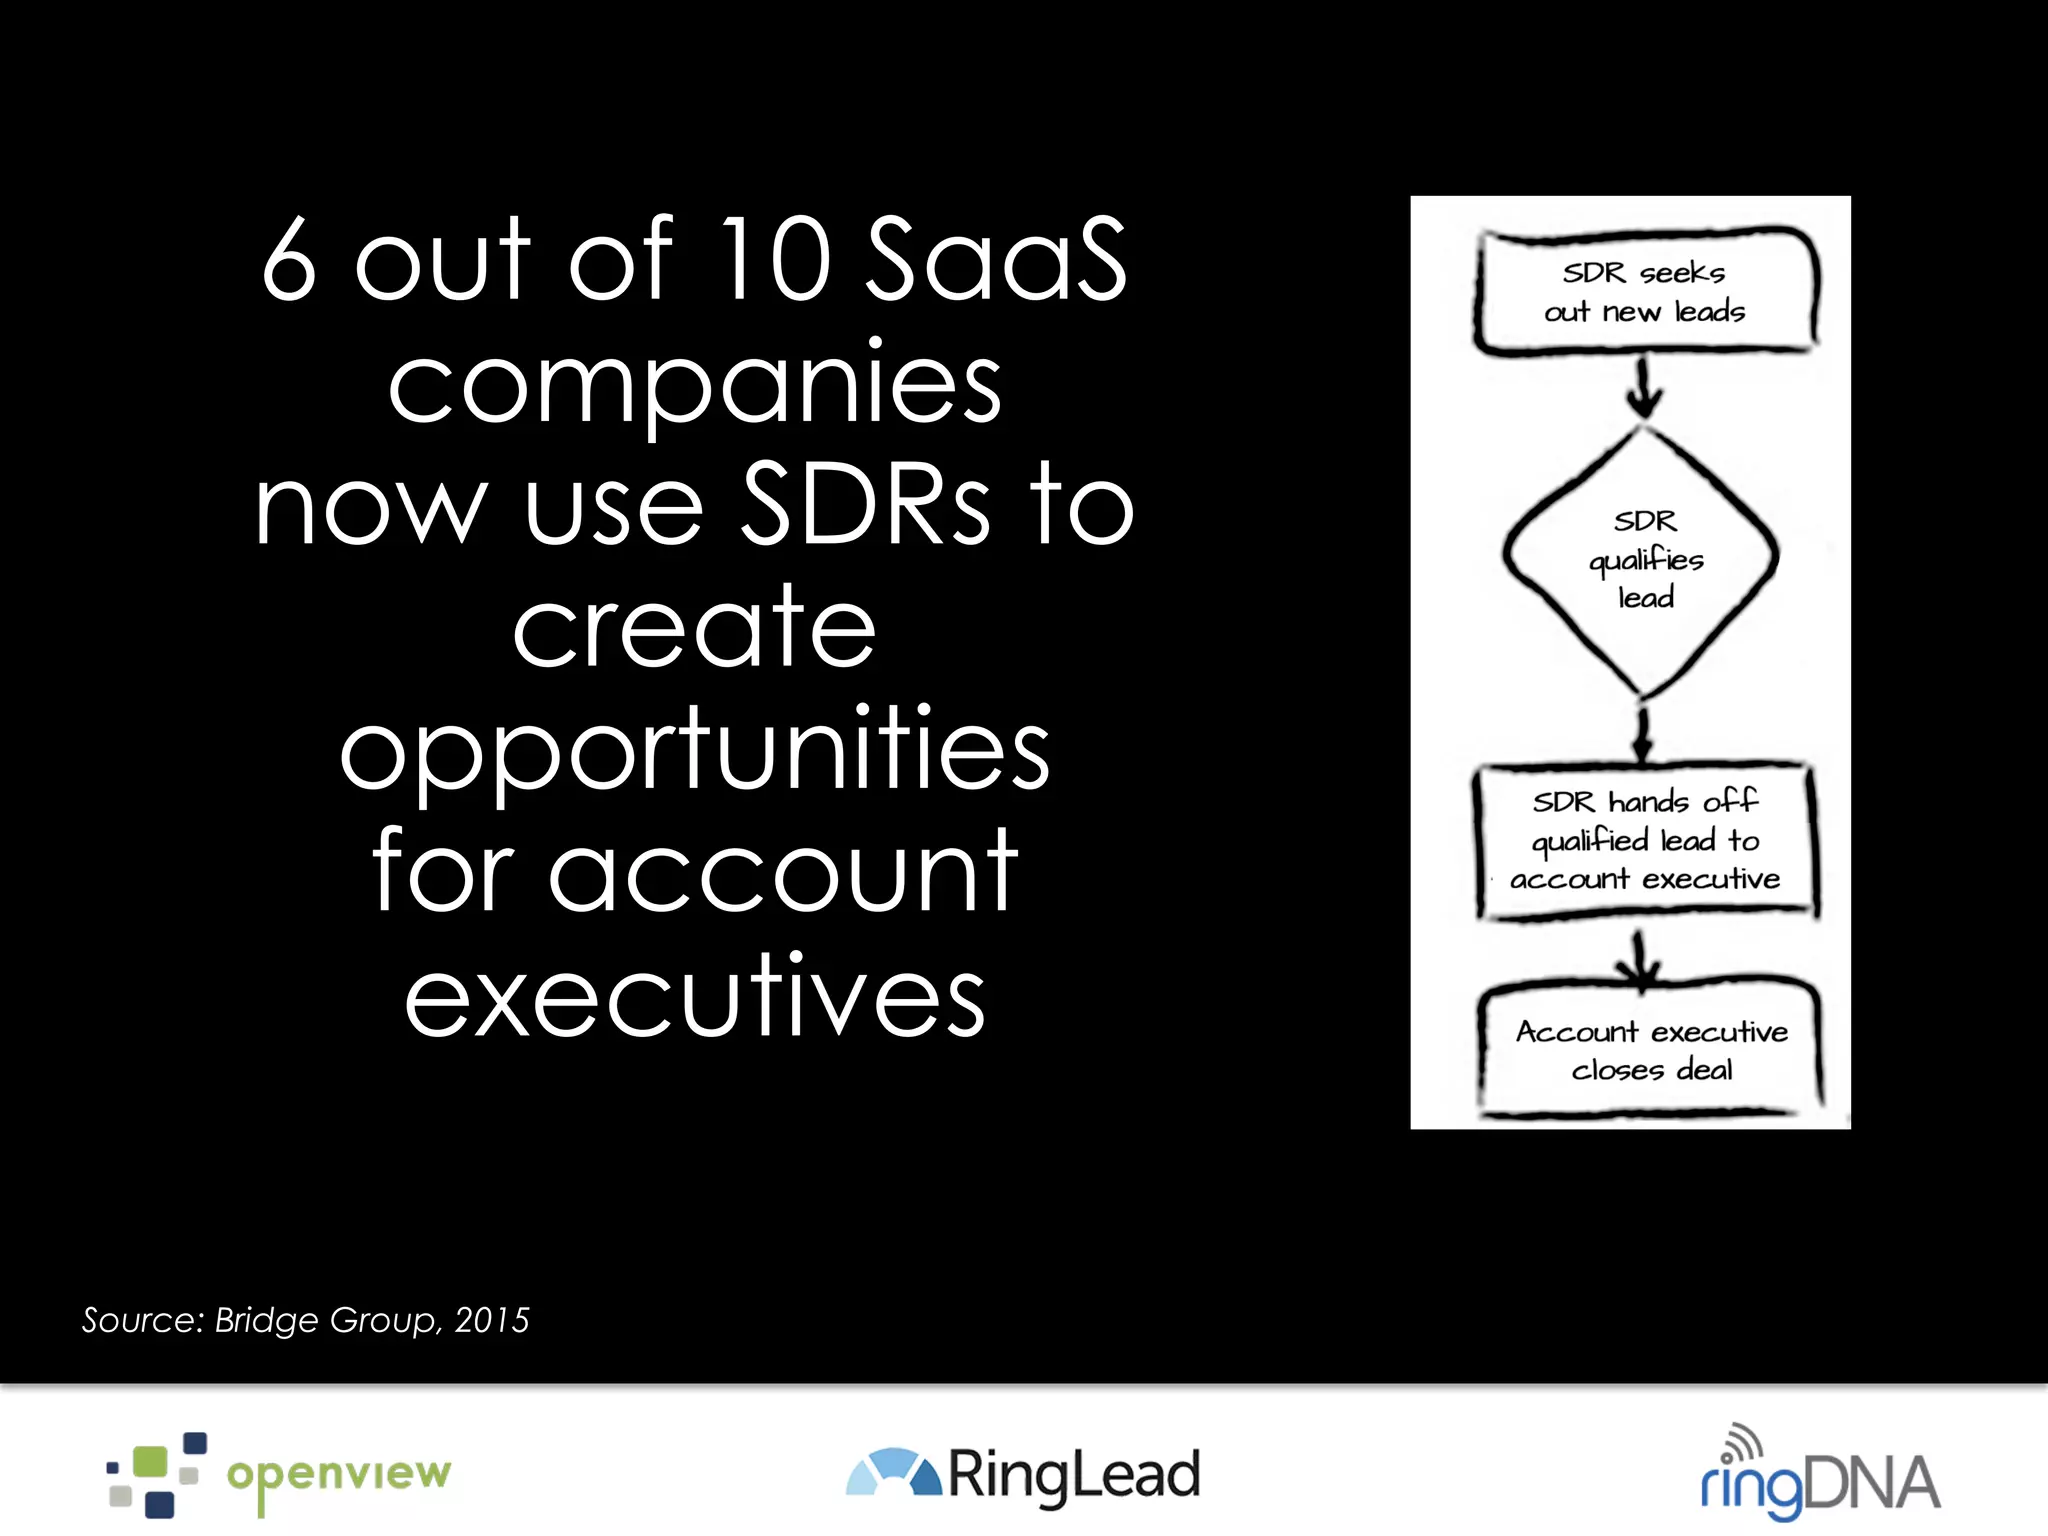
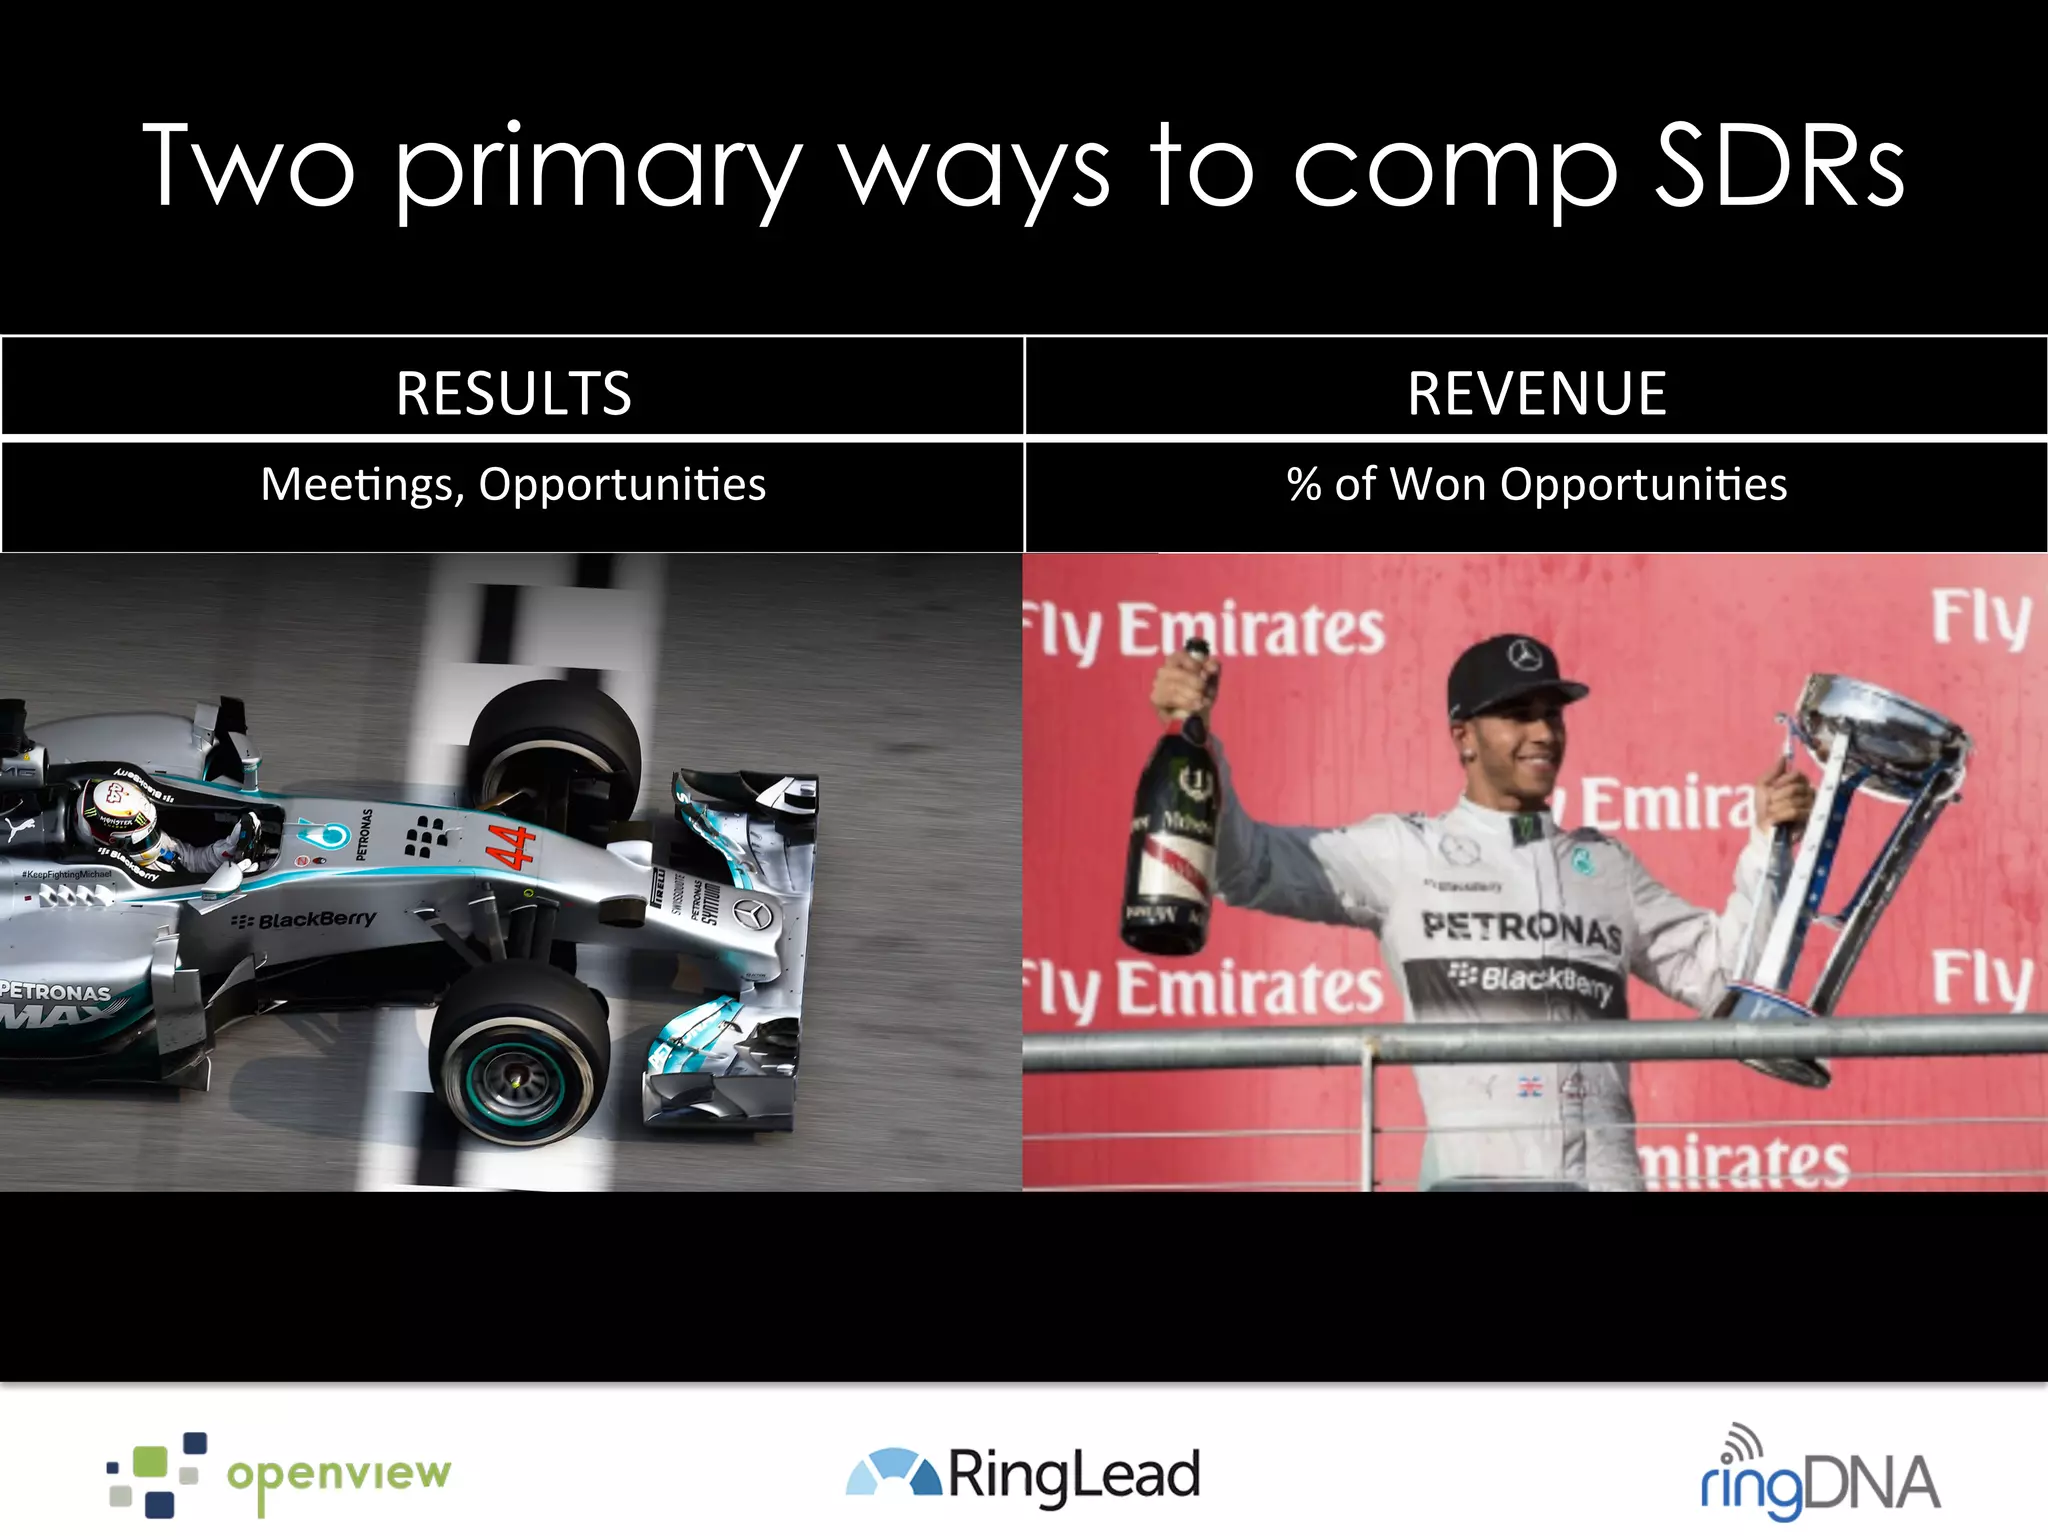

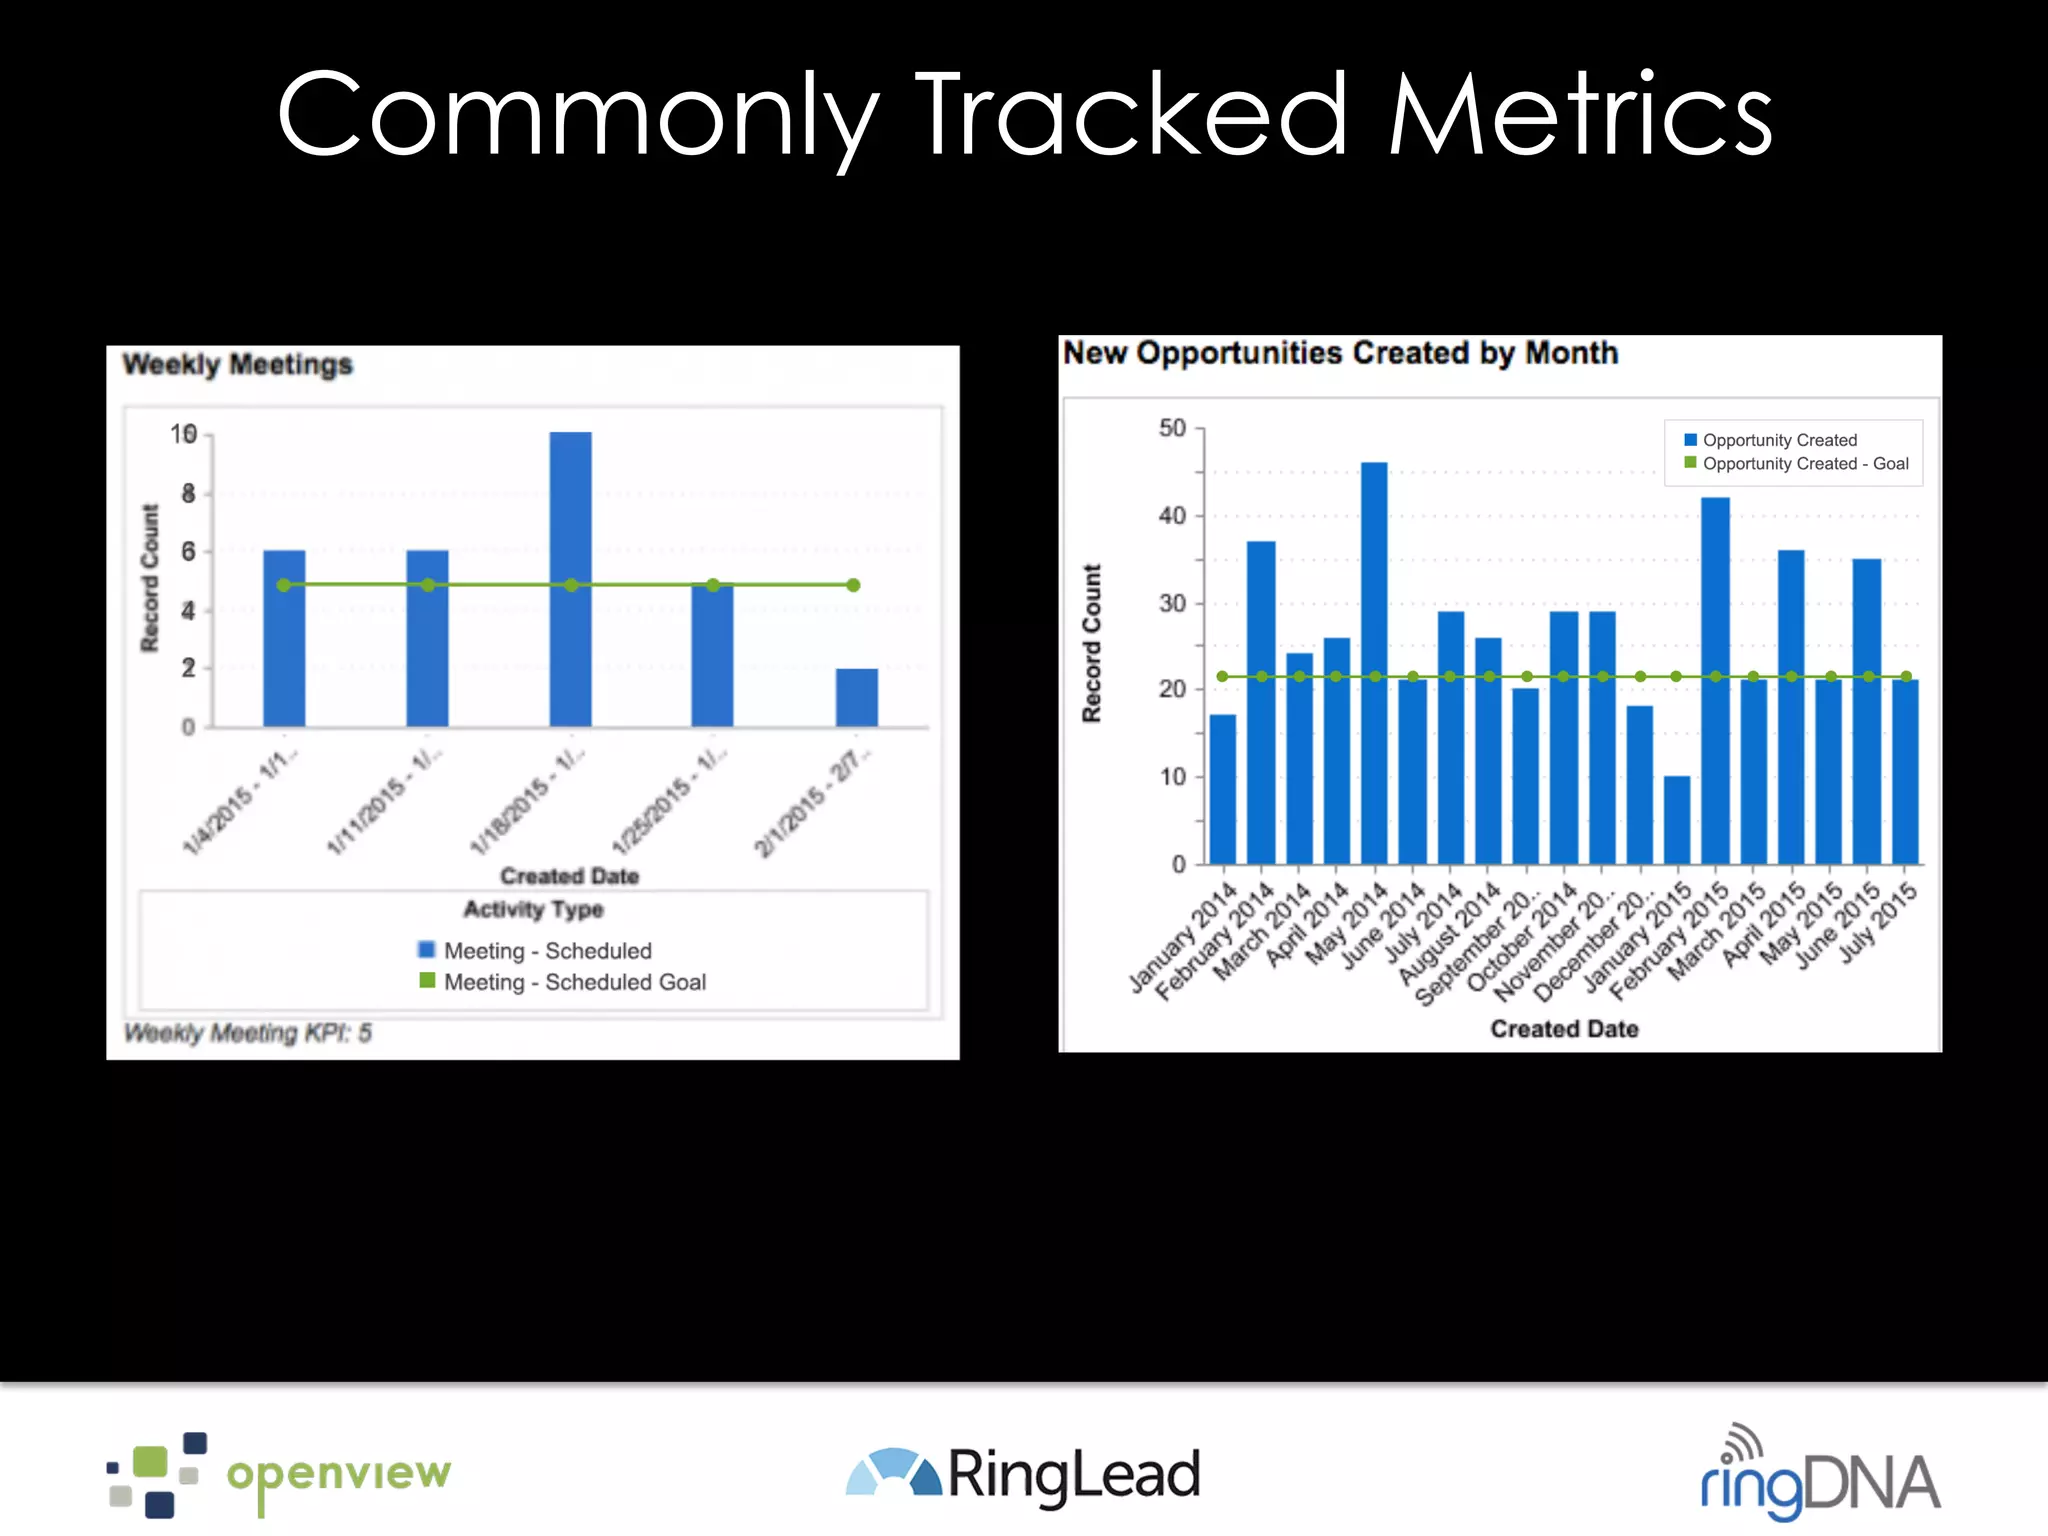
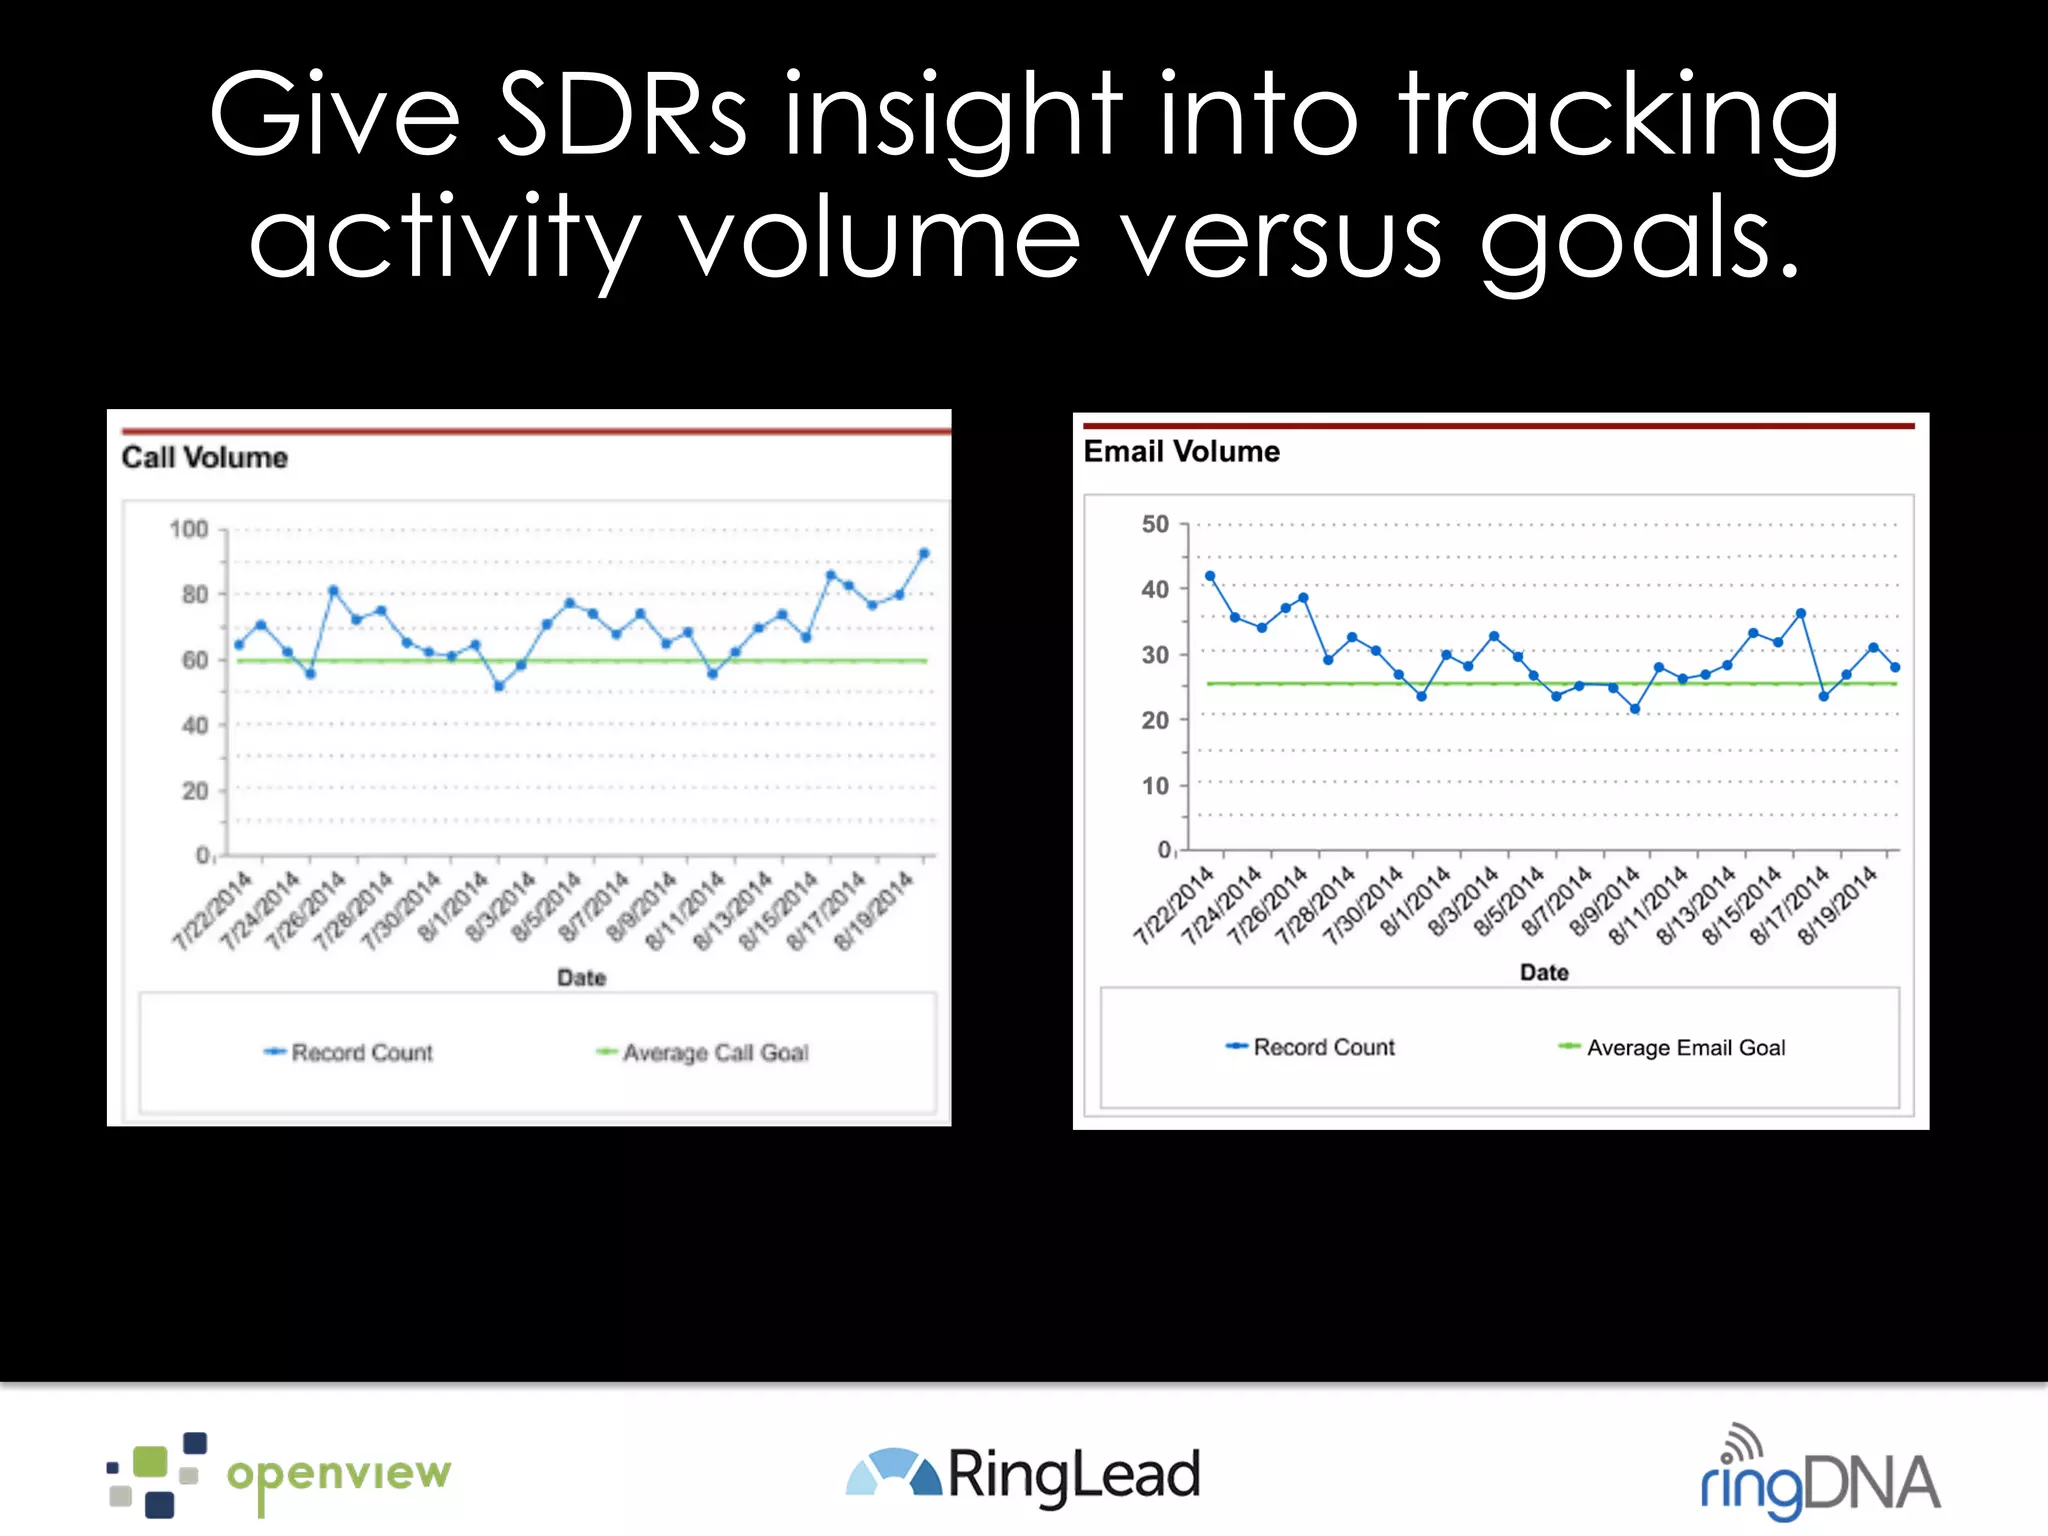


This document discusses creating compensation plans, specifically for millennial sales hires. It provides examples of metrics and goals that could be used in a comp plan, such as number of appointments set and opportunities created. An effective comp plan is simple, has clear structure and goals. It also discusses how to calculate potential revenue per rep based on deal size and close rate for different customer segments. The document emphasizes that top performance results from achieving goals in multiple areas, not just one metric, and notes the importance of tracking activities in CRM.


![CCNG_Exec_summ [Autosaved]](https://cdn.slidesharecdn.com/ss_thumbnails/4043f6cf-579f-4308-bdba-83c6bacf448a-161025223330-thumbnail.jpg?width=640&height=640&fit=bounds)