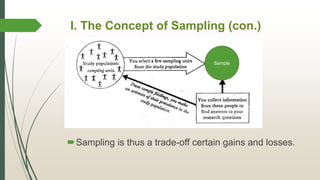
Lecturer: Leang Sokdina
វិទ្យាស្ថា នសហប្រតិរតតិការអនតរជាតិ កម្ពុជា
Cambodia International Cooperation Institute
Faculty of Arts, Humanities and Languages
Year III, Semester II
2014-2015
Academic Writing
Group 10’s Members
1. Ms. Rith ChanLeaphea
2. Ms. Thea Sievhong
3. Mr. Keo Vichet
Content
I. The Concept of Sampling
II. The concept of sampling in qualitative research
III.Sampling Terminology
IV.Principles of Sampling
V.Factors affecting the inferences drawn from a sample
VI.Aims in Selecting Sample
VII.Type of Sampling
VIII.Random/probability sampling designs
IX. Methods of drawing a random sample
X. Different Systems of drawing a random sample
XI.Specific random/probability sampling designs
XII.Non-random/non-probability sampling designs
XIII.Mixed sampling designs
XIV.The calculation of sample size
Conclusion
Content
I. The Concept of Sampling
Sampling is the process of selecting a few (a
sample) from a bigger group to become the basic for
estimating the prevalence of an unknown piece of
information.
Sampling is thus a trade-off certain gains and losses.
I. The Concept of Sampling (con.)
Sample
II. The concept of sampling in
qualitative research
In qualitative research Issue of sampling has:
little significance
Does not quantify or determine the extent of diversity
Explore diversity—saturation point
Saturation point is a subjective judgment we
researcher decide
III. Sampling Terminology
The main aim of sampling terminology is to find out the
average of something in particular place.
In this process there are a number of aspects:
Population or study population
Sample
Sample size
Sampling design or strategy
Sampling unit/element
III. Sampling Terminology (con.)
Sampling frame
Sample statistics
Population parameters/mean
Saturation point
IV. Principles of Sampling
The theory of sampling is guided by three principles:
1st Principle: in a majority of cases of sampling there
will be a difference between the sample statistics and
the true population mean, which is attributable to the
selection of the units in the sample.
Sample Sample Average
(statistics sample)
Population
mean/parameter
Difference
1 19.0 21.5 -2.5
2 20.5 21.5 -1.5
3 21.5 21.5 0.0
4 21.5 21.5 0.0
5 22.5 21.5 +1.5
6 24.0 21.5 +2.5
Example of 1st Principle (select two units from sample)
Suppose there are four individuals: A(18ys), B(20ys),
C(23ys) and D(25)
Population mean = (18+20+23+25)/4 = 21.5
IV. Principles of Sampling (con.)
2nd Principle: the greater the sample size, the more
accurate will be the estimate of the true population
mean.
3rd Principle: the greater the difference in variable
under study in a population for a given sample size, the
greater will be the difference the sample statistics and
the true population mean.
Example of 2nd Principle (select three units from sample)
Sample Sample Average
(statistics sample)
Population
mean/parameter
Difference
1 20.33 21.5 -1.17
2 21.00 21.5 -0.5
3 22.00 21.5 +0.5
4 22.67 21.5 +1.17
Suppose there are four individuals: A(18ys), B(20ys),
C(23ys) and D(25)
Population mean = (18+20+23+25)/4 = 21.5
V. Factors affecting the inferences drawn
from a sample
The above principles suggest that two factors may
influence the degree of certainty:
The size of sample—findings based upon larger
sample have more certainty than those based on
smaller one.
The extent of variation in the sampling population—
the greater the variation in the study population with
respect to the characteristics under study for a given
sample size, the greater will be uncertainty.
VI. Aims in Selecting Sample
The aims in selecting a sample are to:
Achieve maximum precision in your estimates within a
given sample size;
Avoid bias in the selection of your sample
Bias in the selection of a sample can occur if:
Sampling is done by a non-random method
The sampling frame
A section of a sampling population is impossible to find or
refuses to cooperate
VII. Type of Sampling
The various sampling strategies can be categorized as
follows:
Random/probability sampling designs
Non-random/Non-probability sampling designs
Mixed sampling designs
VIII. Random/probability sampling designs
For a sampling design to be called a random or
probability sample, it is imperative that each
element in the population has an equal and
independent change of selection in the sample.
VIII. Random/probability sampling designs
(con.)
There are two main advantages of Random/Probability
samples:
As they represent the total sampling population
Some statistical tests based upon the theory of
probability can be applied only to data collected from
random samples.
IX. Methods of drawing a random sample
Of the methods that you can adopt to select a random
sample the three most common are :
The fishbowl draw –- This method is used in some
lotteries.
Computer Program –- there are a number of
programs that can help you to select random samples.
A table of random numbers –- A table of randomly
generated number in their appendices.
IX. Methods of drawing a random sample
The procedure for selecting a sample using a table of
random number is as follows:
Step 1: Identify the total number of element in the
study population.
Step 2: Number of each element starting from 1
Step 3: If the table or random numbers is on more than
one page, choose the starting page by a random
procedure.
A table of random numbers
IX. Methods of drawing a random sample
Step 4: Corresponding to the number of digits to which
the total population runs, select the same number,
randomly, of columns or rows of digits from the table.
Step 5: Decide on your sample size
Step 6: Select the require number of elements for your
sample from the table.
A table of random numbers
X. Different Systems of drawing a random
sample
There are two ways of selecting a random sample:
Sampling without replacement
Sampling with replacement
XI. Specific random/probability sampling designs
There are three types:
 simple random sampling(SRS)
Step 1 : Identify by number all elements or sampling units in
the population.
Step 2 : Decide on the sample size (n)
Step 3 : Select (n) using either the fishbowl draw the table of
random numbers or a computer program
 Stratified random sampling
XI. Specific random/probability sampling designs
 Cluster sampling: is bases on the ability of the researcher to
divide sampling population into group.
Step 1 : Identify all elements or sampling units in the sampling
population.
Step 2 : Decide upon the different strata (K) into which you want
to stratify the population.
Step 3 : Place each element into the appropriate stratum
Step 4 : Number every element in each stratum separately
Step 5 : Decide the total sample size (n)
Step 6 : Decide whether you want to select proportionate or
disproportionate stratified sampling and follow the steps
below.
XII. Non-random/non-probability sampling designs
There are four non-random designs, which are commonly used
in qualitative and quantitative:
 Quota sampling is a researcher’s ease of access to the
sample population. There are advantages and disadvantages
with this design.
- advantages: you do not need any information such the
total number of element, their location…
- disadvantages: the finding cannot be generalized to the
total sampling population hence might not be truly
representative of the total sampling population.
XII. Non-random/non-probability sampling designs
Accidental sampling is also base upon convenience in
accessing the sample population. It common among
market research and new paper report.
 Judgemental or purposive sampling is the judgment of
the researcher as to who can provide the best information
to achieve the objectives of the study.
Snowball sampling is the process of selecting sample
using network. To start with, a few individuals in a group or
organization are selected and the required information is
collect from them.
XIII. Mixed sampling designs
Systematic sampling design: has been classified under the mixed
sapling category. It has characteristics of both random and non-
random sampling design.
The procedure for selecting a systematic simple
Step 1: Prepare a list of all the elements in the study
population (N).
Step 2 : Decide on the sample size (n).
Step 3 : Determine the width of the interval (k) = N/n.
Step 4 : Using the SRS, select an element from the first interval
(nth order)
Step 5 : Select the same order element from each subsequent
interval.
XIII. Mixed sampling designs
Systematic sampling
Sampling frame
1
2
3
4
5
6
7
8
9
10
21
22
23
24
25
26
27
28
29
30
31
32
33
34
35
36
37
38
39
40
41
42
43
44
45
46
47
48
49
50
11
12
13
14
15
16
17
18
19
20
Interval(k)
3
7
12
20
23
27
32
37
44
49
Sample selected
XIV. The calculation of sample size
It You can use this sample size calculator to determine
how many subjects you need to collect data from in order
to get results that reflect the target population as
precisely as needed. You can also find the level of
precision you have in an existing sample.
It depends on what you want to do with the findings and
what type of relationships you want to establish
Conclusion
References
Academic Writing, CICI.
http://www.surveysystem.com/sscalc.htm
32

The Concept of Sampling

  • 1.
    Lecturer: Leang Sokdina វិទ្យាស្ថានសហប្រតិរតតិការអនតរជាតិ កម្ពុជា Cambodia International Cooperation Institute Faculty of Arts, Humanities and Languages Year III, Semester II 2014-2015 Academic Writing
  • 2.
    Group 10’s Members 1.Ms. Rith ChanLeaphea 2. Ms. Thea Sievhong 3. Mr. Keo Vichet
  • 3.
    Content I. The Conceptof Sampling II. The concept of sampling in qualitative research III.Sampling Terminology IV.Principles of Sampling V.Factors affecting the inferences drawn from a sample VI.Aims in Selecting Sample VII.Type of Sampling VIII.Random/probability sampling designs
  • 4.
    IX. Methods ofdrawing a random sample X. Different Systems of drawing a random sample XI.Specific random/probability sampling designs XII.Non-random/non-probability sampling designs XIII.Mixed sampling designs XIV.The calculation of sample size Conclusion Content
  • 5.
    I. The Conceptof Sampling Sampling is the process of selecting a few (a sample) from a bigger group to become the basic for estimating the prevalence of an unknown piece of information.
  • 6.
    Sampling is thusa trade-off certain gains and losses. I. The Concept of Sampling (con.) Sample
  • 7.
    II. The conceptof sampling in qualitative research In qualitative research Issue of sampling has: little significance Does not quantify or determine the extent of diversity Explore diversity—saturation point Saturation point is a subjective judgment we researcher decide
  • 8.
    III. Sampling Terminology Themain aim of sampling terminology is to find out the average of something in particular place. In this process there are a number of aspects: Population or study population Sample Sample size Sampling design or strategy Sampling unit/element
  • 9.
    III. Sampling Terminology(con.) Sampling frame Sample statistics Population parameters/mean Saturation point
  • 10.
    IV. Principles ofSampling The theory of sampling is guided by three principles: 1st Principle: in a majority of cases of sampling there will be a difference between the sample statistics and the true population mean, which is attributable to the selection of the units in the sample.
  • 11.
    Sample Sample Average (statisticssample) Population mean/parameter Difference 1 19.0 21.5 -2.5 2 20.5 21.5 -1.5 3 21.5 21.5 0.0 4 21.5 21.5 0.0 5 22.5 21.5 +1.5 6 24.0 21.5 +2.5 Example of 1st Principle (select two units from sample) Suppose there are four individuals: A(18ys), B(20ys), C(23ys) and D(25) Population mean = (18+20+23+25)/4 = 21.5
  • 12.
    IV. Principles ofSampling (con.) 2nd Principle: the greater the sample size, the more accurate will be the estimate of the true population mean. 3rd Principle: the greater the difference in variable under study in a population for a given sample size, the greater will be the difference the sample statistics and the true population mean.
  • 13.
    Example of 2ndPrinciple (select three units from sample) Sample Sample Average (statistics sample) Population mean/parameter Difference 1 20.33 21.5 -1.17 2 21.00 21.5 -0.5 3 22.00 21.5 +0.5 4 22.67 21.5 +1.17 Suppose there are four individuals: A(18ys), B(20ys), C(23ys) and D(25) Population mean = (18+20+23+25)/4 = 21.5
  • 14.
    V. Factors affectingthe inferences drawn from a sample The above principles suggest that two factors may influence the degree of certainty: The size of sample—findings based upon larger sample have more certainty than those based on smaller one. The extent of variation in the sampling population— the greater the variation in the study population with respect to the characteristics under study for a given sample size, the greater will be uncertainty.
  • 15.
    VI. Aims inSelecting Sample The aims in selecting a sample are to: Achieve maximum precision in your estimates within a given sample size; Avoid bias in the selection of your sample Bias in the selection of a sample can occur if: Sampling is done by a non-random method The sampling frame A section of a sampling population is impossible to find or refuses to cooperate
  • 16.
    VII. Type ofSampling The various sampling strategies can be categorized as follows: Random/probability sampling designs Non-random/Non-probability sampling designs Mixed sampling designs
  • 17.
    VIII. Random/probability samplingdesigns For a sampling design to be called a random or probability sample, it is imperative that each element in the population has an equal and independent change of selection in the sample.
  • 18.
    VIII. Random/probability samplingdesigns (con.) There are two main advantages of Random/Probability samples: As they represent the total sampling population Some statistical tests based upon the theory of probability can be applied only to data collected from random samples.
  • 19.
    IX. Methods ofdrawing a random sample Of the methods that you can adopt to select a random sample the three most common are : The fishbowl draw –- This method is used in some lotteries. Computer Program –- there are a number of programs that can help you to select random samples. A table of random numbers –- A table of randomly generated number in their appendices.
  • 20.
    IX. Methods ofdrawing a random sample The procedure for selecting a sample using a table of random number is as follows: Step 1: Identify the total number of element in the study population. Step 2: Number of each element starting from 1 Step 3: If the table or random numbers is on more than one page, choose the starting page by a random procedure. A table of random numbers
  • 21.
    IX. Methods ofdrawing a random sample Step 4: Corresponding to the number of digits to which the total population runs, select the same number, randomly, of columns or rows of digits from the table. Step 5: Decide on your sample size Step 6: Select the require number of elements for your sample from the table. A table of random numbers
  • 22.
    X. Different Systemsof drawing a random sample There are two ways of selecting a random sample: Sampling without replacement Sampling with replacement
  • 23.
    XI. Specific random/probabilitysampling designs There are three types:  simple random sampling(SRS) Step 1 : Identify by number all elements or sampling units in the population. Step 2 : Decide on the sample size (n) Step 3 : Select (n) using either the fishbowl draw the table of random numbers or a computer program  Stratified random sampling
  • 24.
    XI. Specific random/probabilitysampling designs  Cluster sampling: is bases on the ability of the researcher to divide sampling population into group. Step 1 : Identify all elements or sampling units in the sampling population. Step 2 : Decide upon the different strata (K) into which you want to stratify the population. Step 3 : Place each element into the appropriate stratum Step 4 : Number every element in each stratum separately Step 5 : Decide the total sample size (n) Step 6 : Decide whether you want to select proportionate or disproportionate stratified sampling and follow the steps below.
  • 25.
    XII. Non-random/non-probability samplingdesigns There are four non-random designs, which are commonly used in qualitative and quantitative:  Quota sampling is a researcher’s ease of access to the sample population. There are advantages and disadvantages with this design. - advantages: you do not need any information such the total number of element, their location… - disadvantages: the finding cannot be generalized to the total sampling population hence might not be truly representative of the total sampling population.
  • 26.
    XII. Non-random/non-probability samplingdesigns Accidental sampling is also base upon convenience in accessing the sample population. It common among market research and new paper report.  Judgemental or purposive sampling is the judgment of the researcher as to who can provide the best information to achieve the objectives of the study. Snowball sampling is the process of selecting sample using network. To start with, a few individuals in a group or organization are selected and the required information is collect from them.
  • 27.
    XIII. Mixed samplingdesigns Systematic sampling design: has been classified under the mixed sapling category. It has characteristics of both random and non- random sampling design. The procedure for selecting a systematic simple Step 1: Prepare a list of all the elements in the study population (N). Step 2 : Decide on the sample size (n). Step 3 : Determine the width of the interval (k) = N/n. Step 4 : Using the SRS, select an element from the first interval (nth order) Step 5 : Select the same order element from each subsequent interval.
  • 28.
    XIII. Mixed samplingdesigns Systematic sampling Sampling frame 1 2 3 4 5 6 7 8 9 10 21 22 23 24 25 26 27 28 29 30 31 32 33 34 35 36 37 38 39 40 41 42 43 44 45 46 47 48 49 50 11 12 13 14 15 16 17 18 19 20 Interval(k) 3 7 12 20 23 27 32 37 44 49 Sample selected
  • 29.
    XIV. The calculationof sample size It You can use this sample size calculator to determine how many subjects you need to collect data from in order to get results that reflect the target population as precisely as needed. You can also find the level of precision you have in an existing sample. It depends on what you want to do with the findings and what type of relationships you want to establish
  • 30.
  • 31.
  • 32.

Editor's Notes

  • #8 Diversity = difference Subjective = Personal believe Saturation point = to reach a stage where no more can be added, contained or accepted