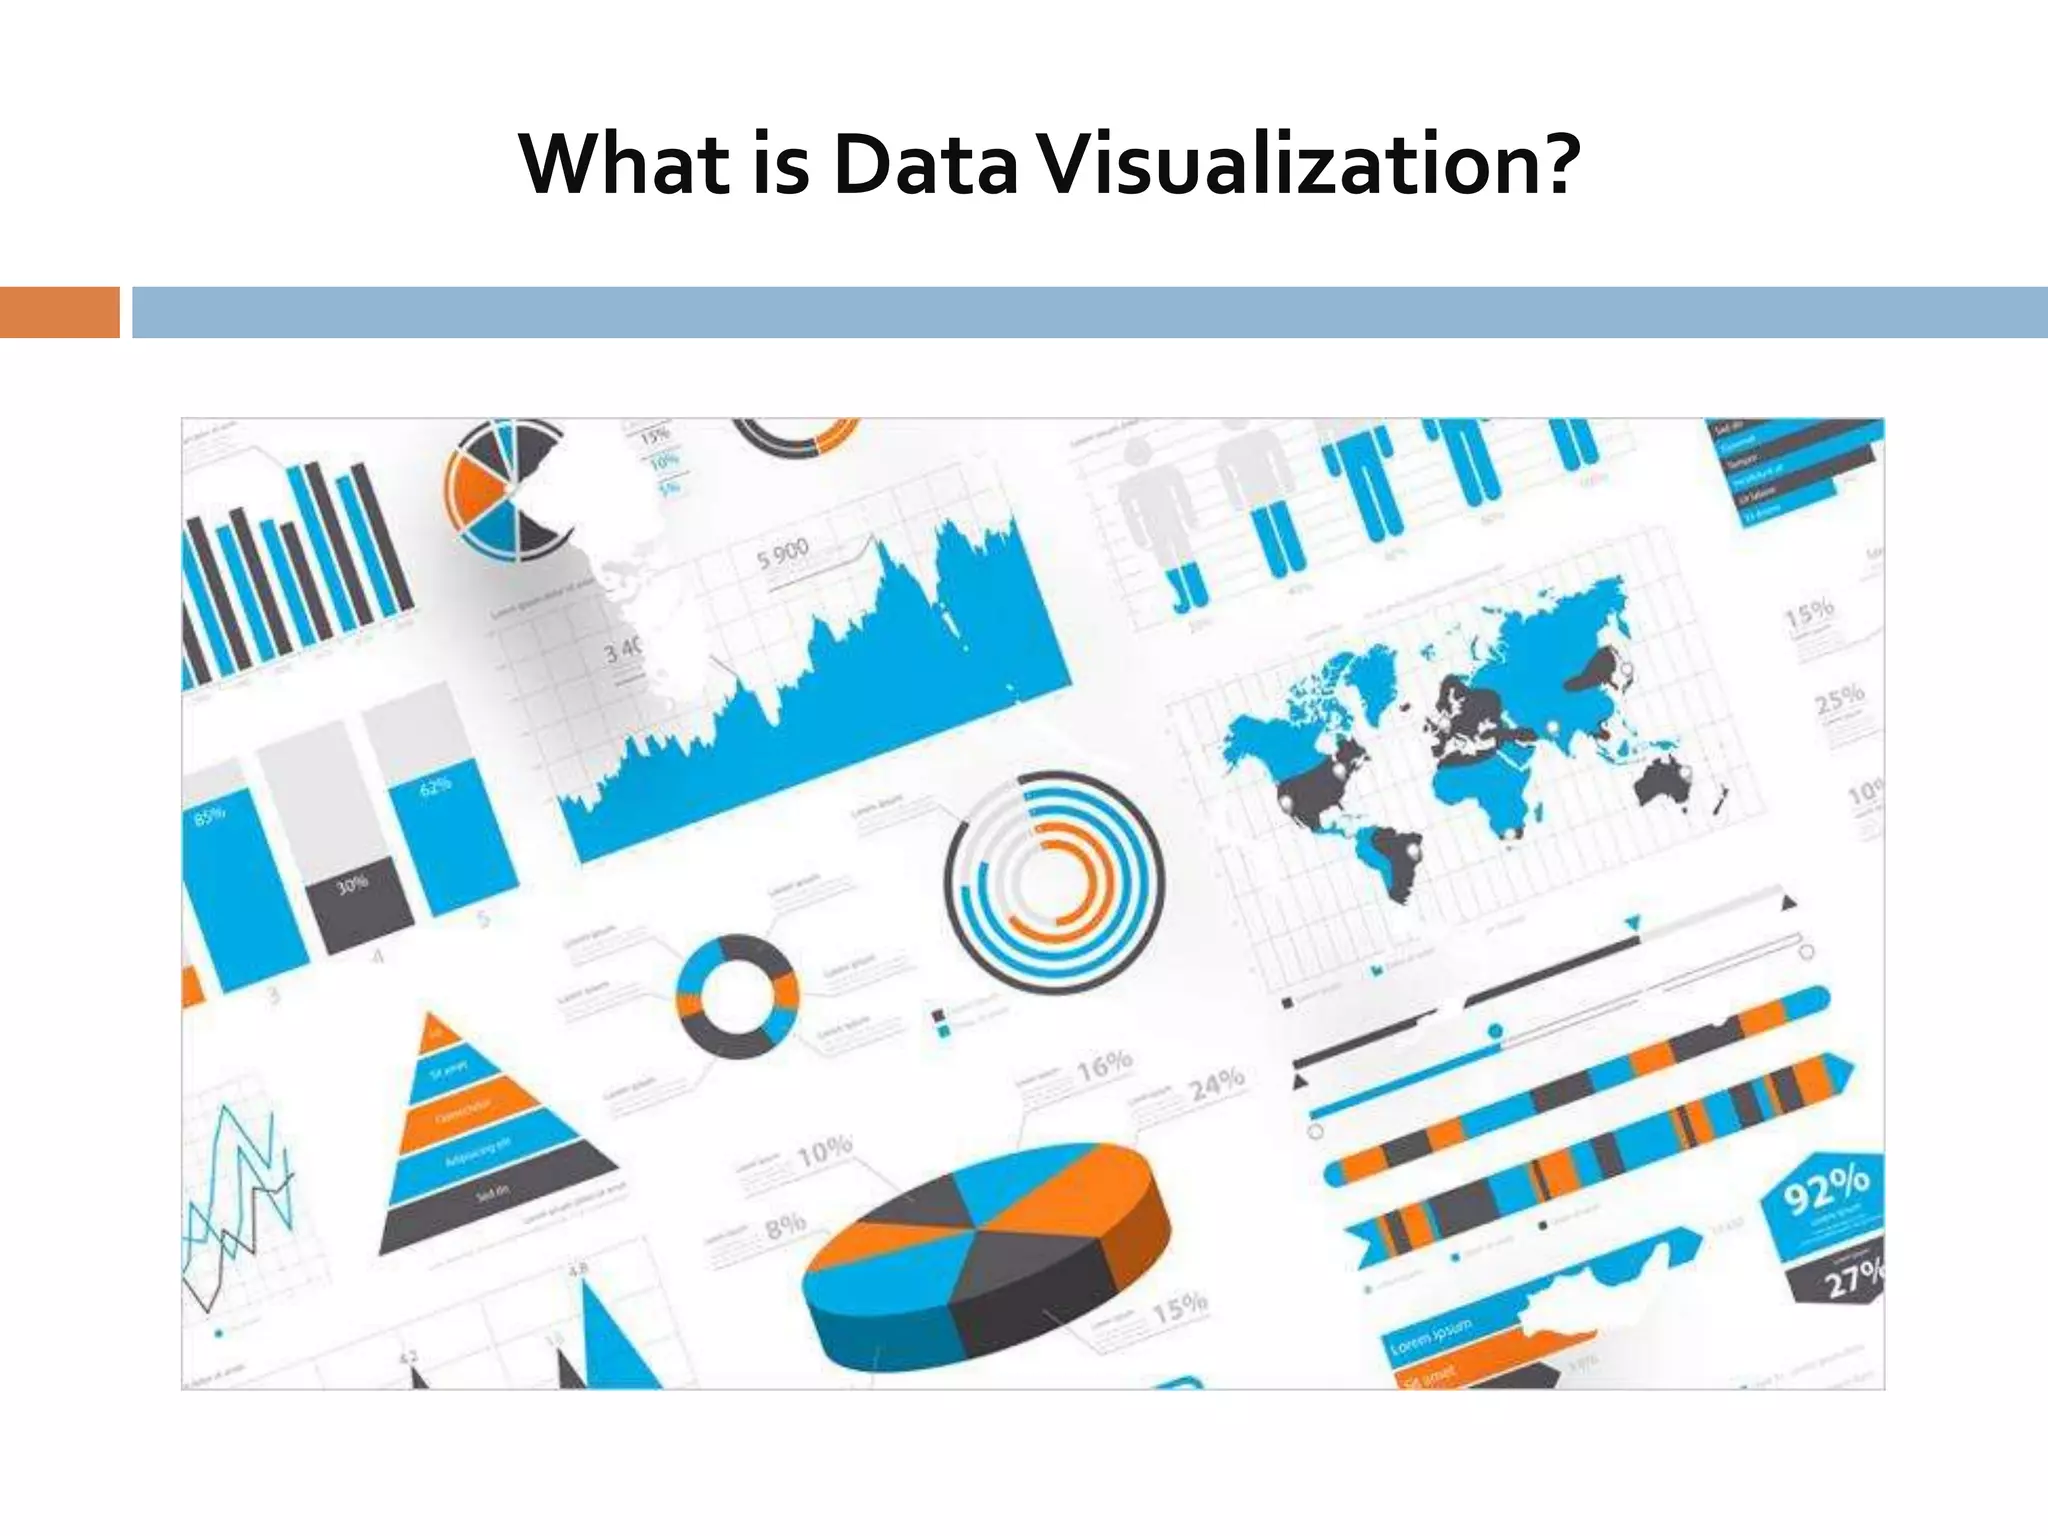
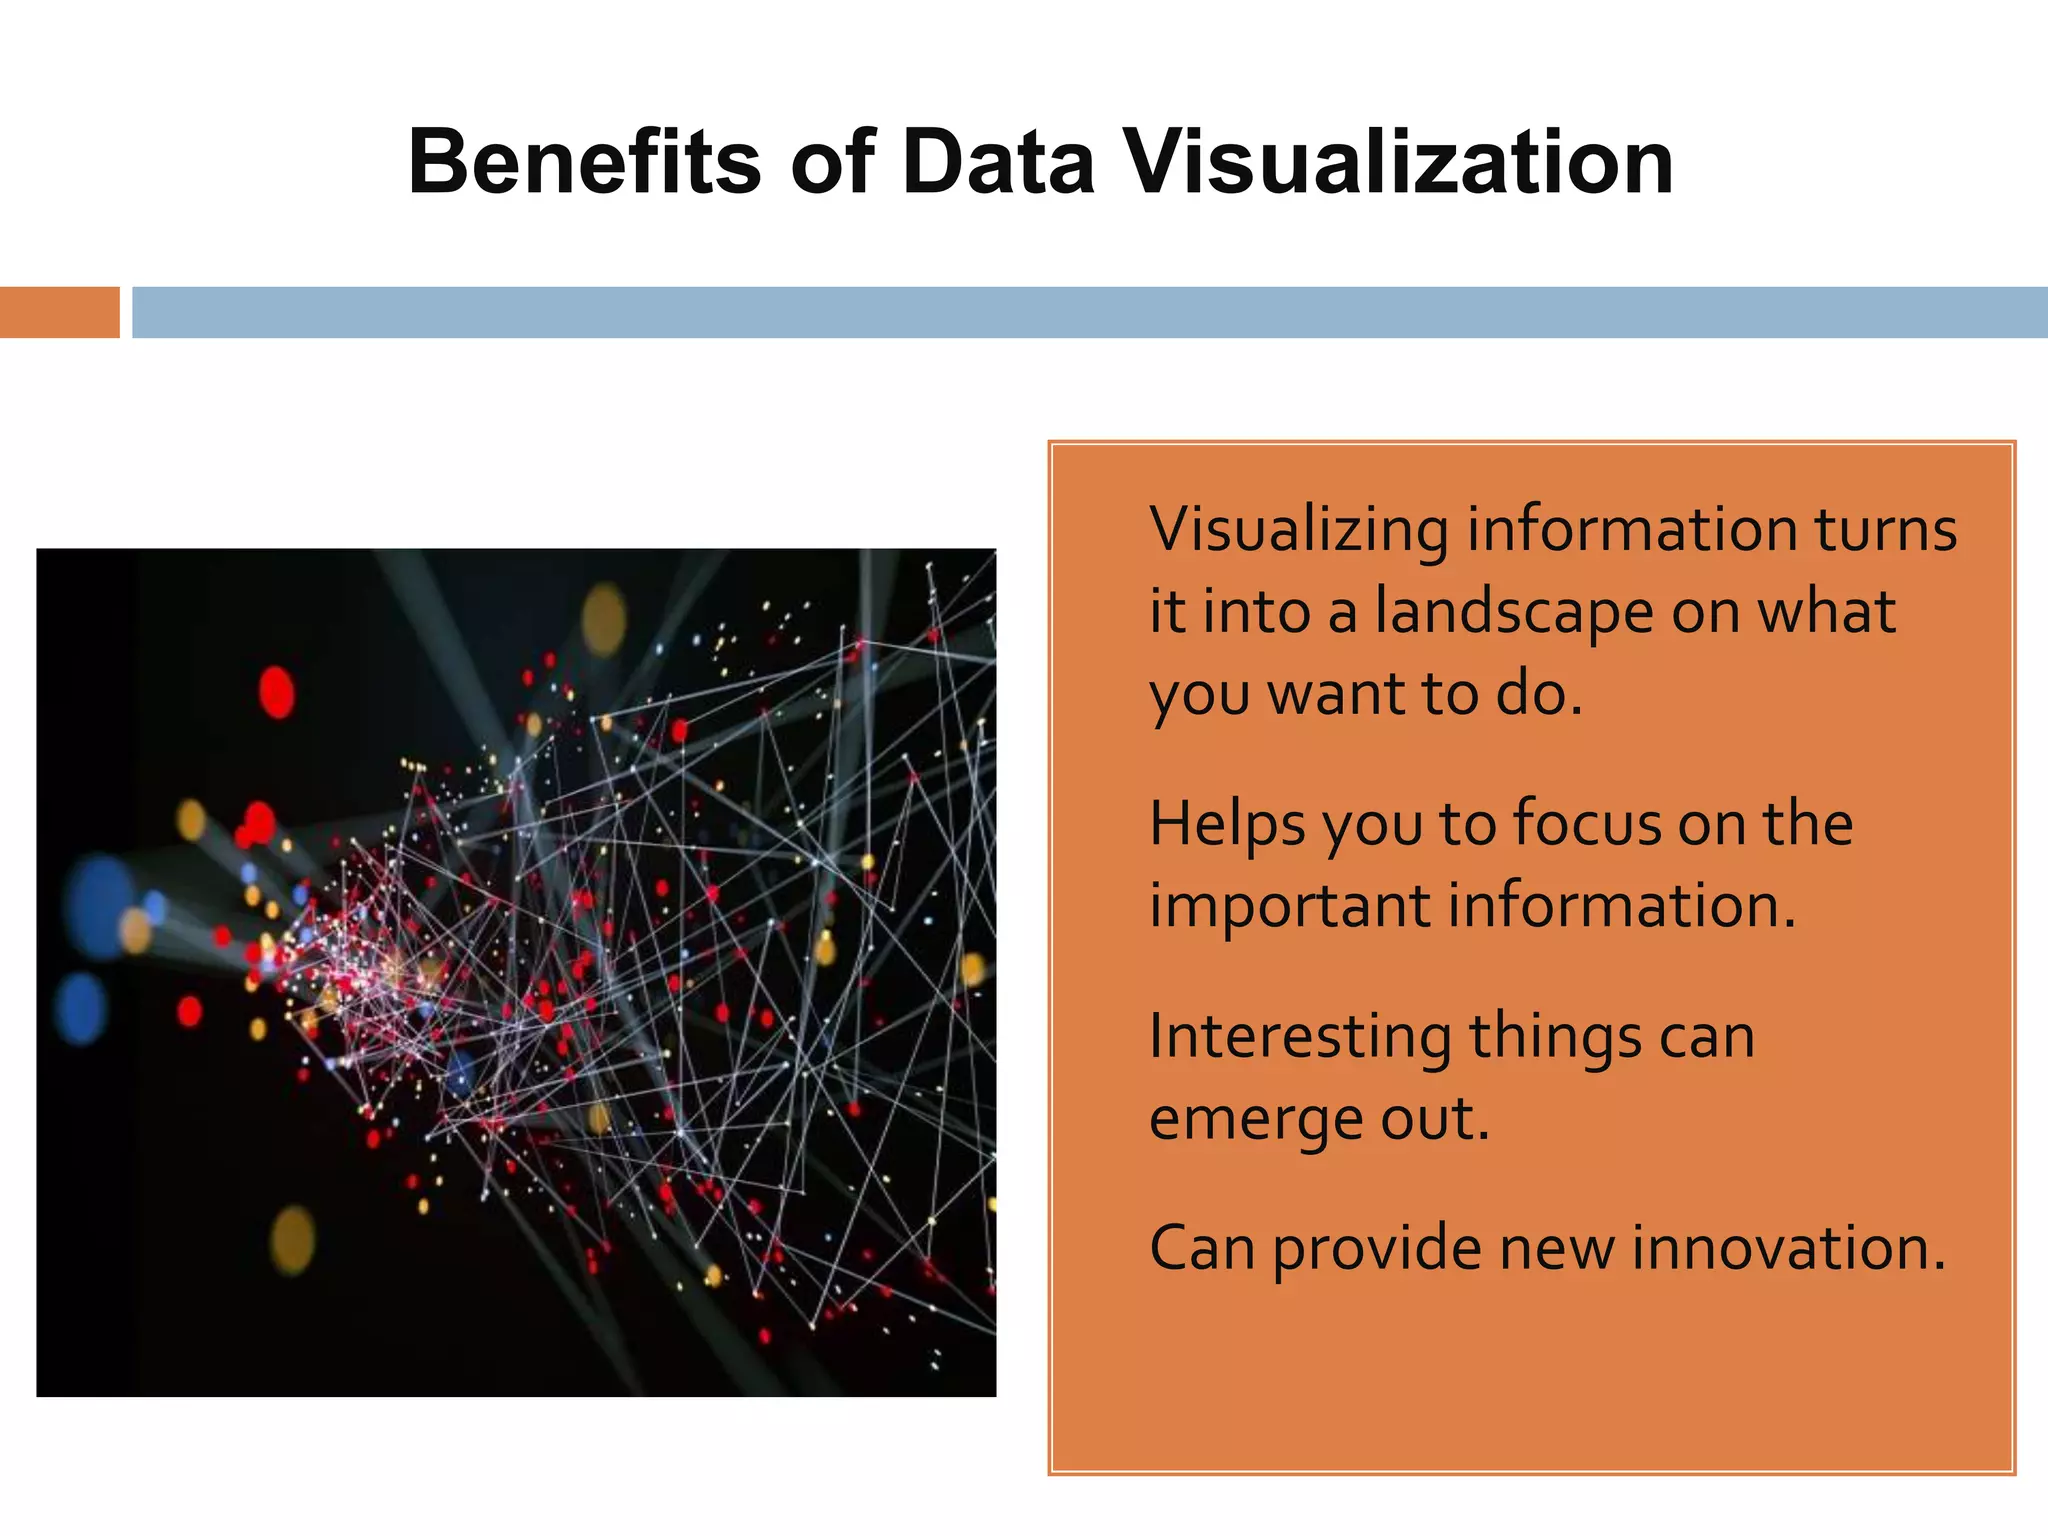
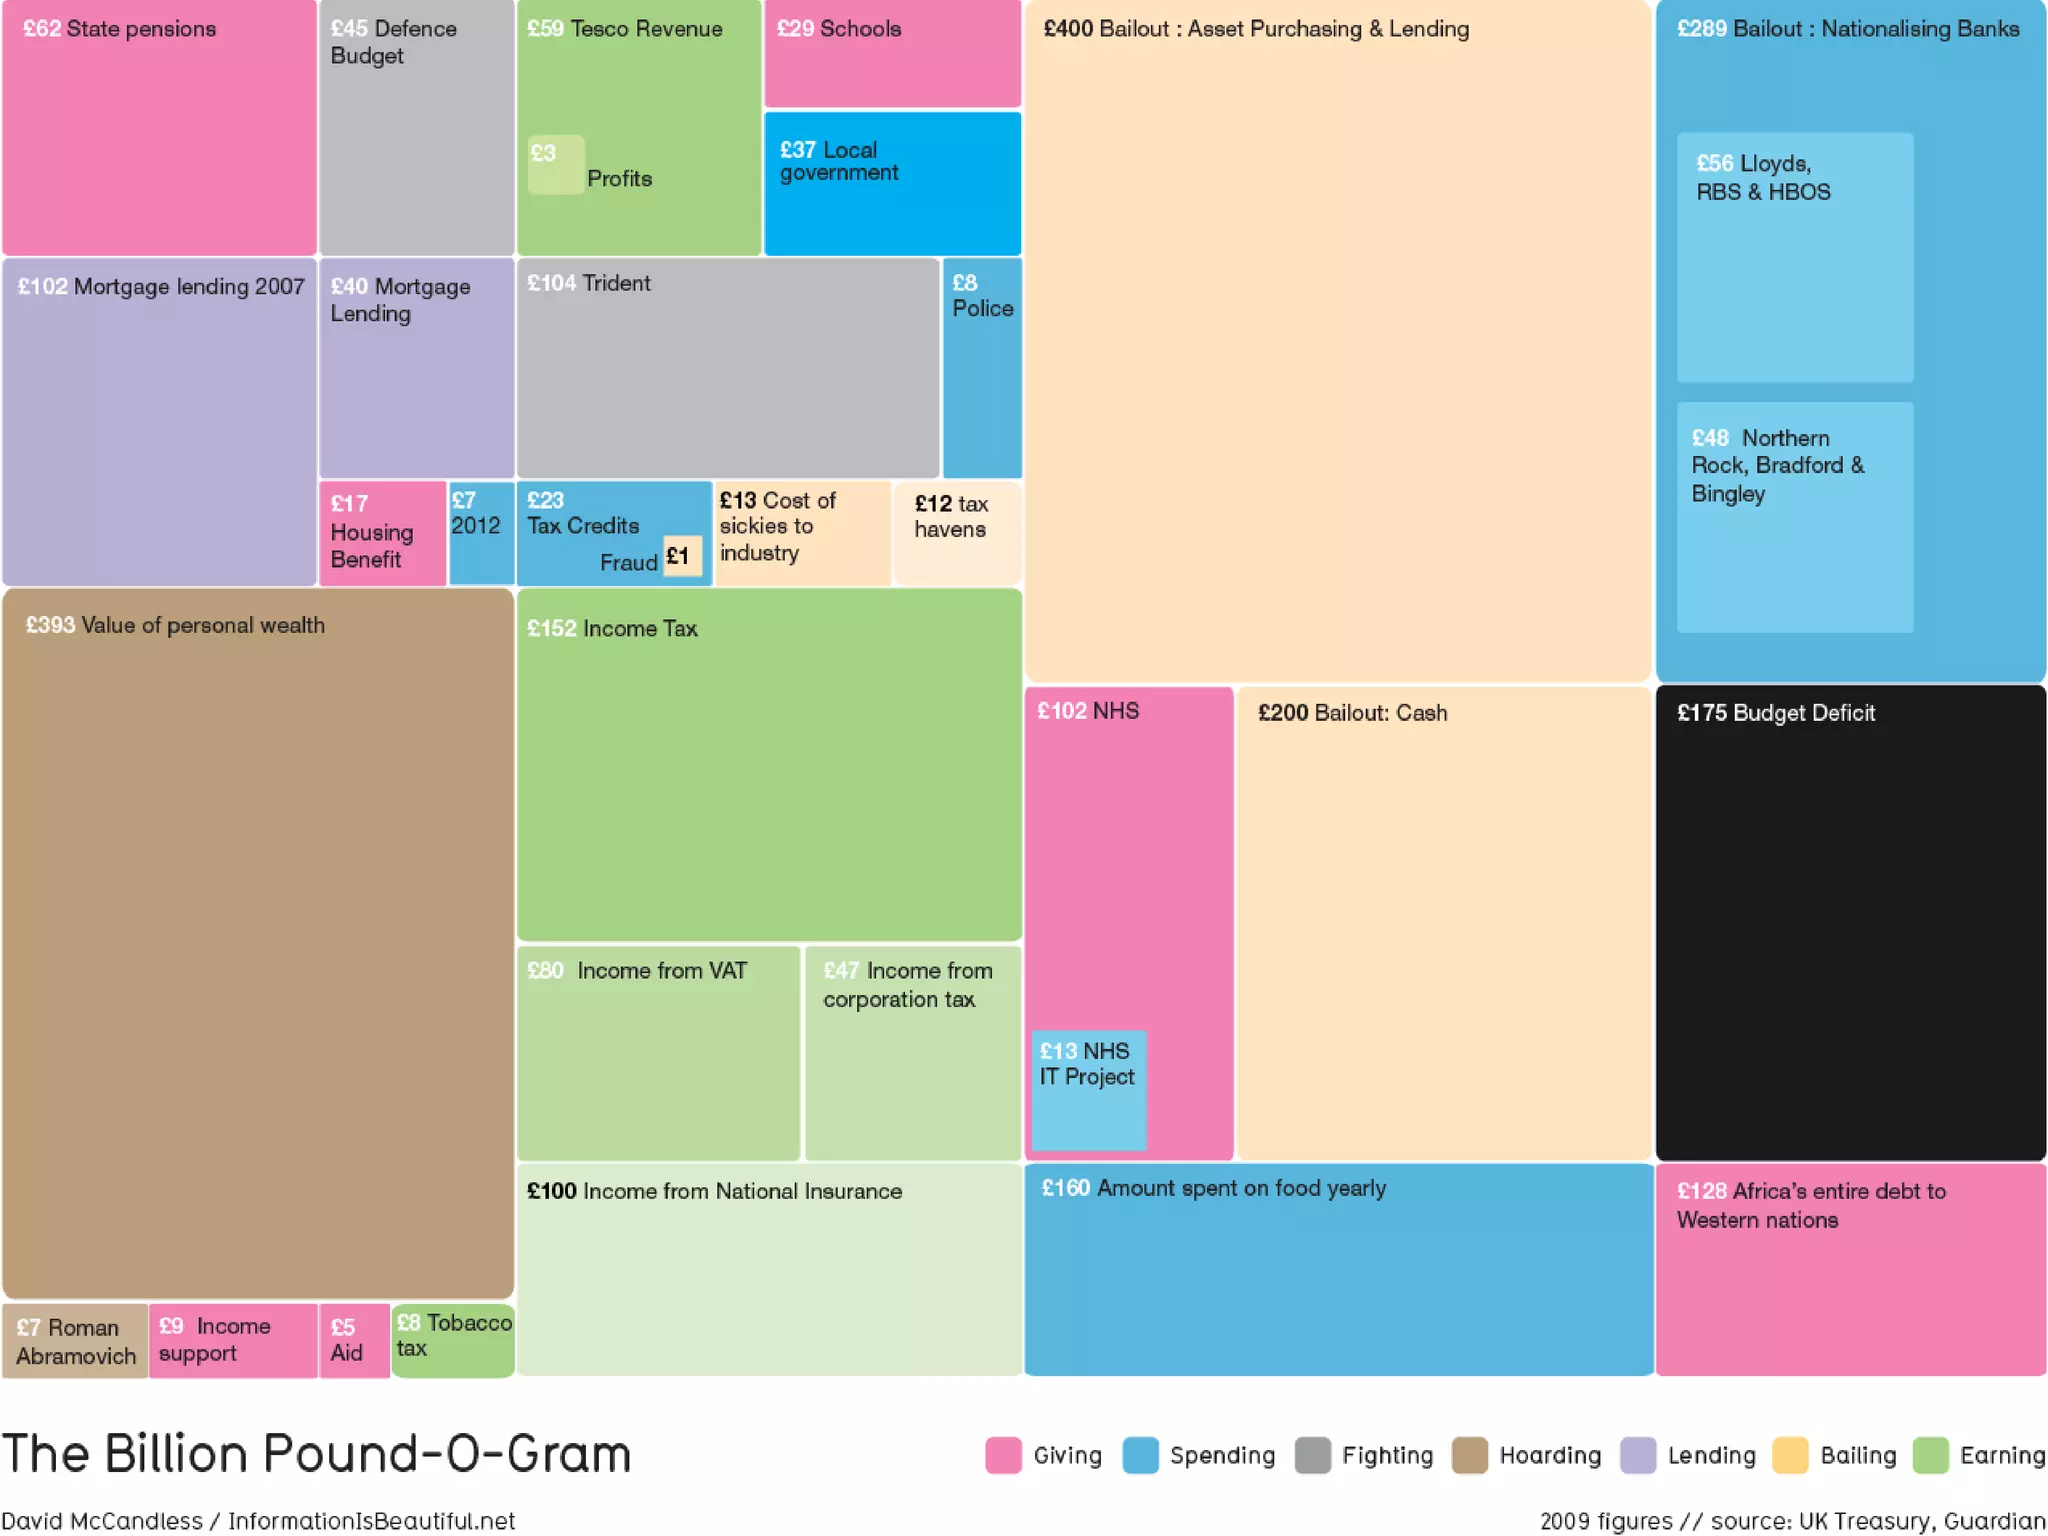
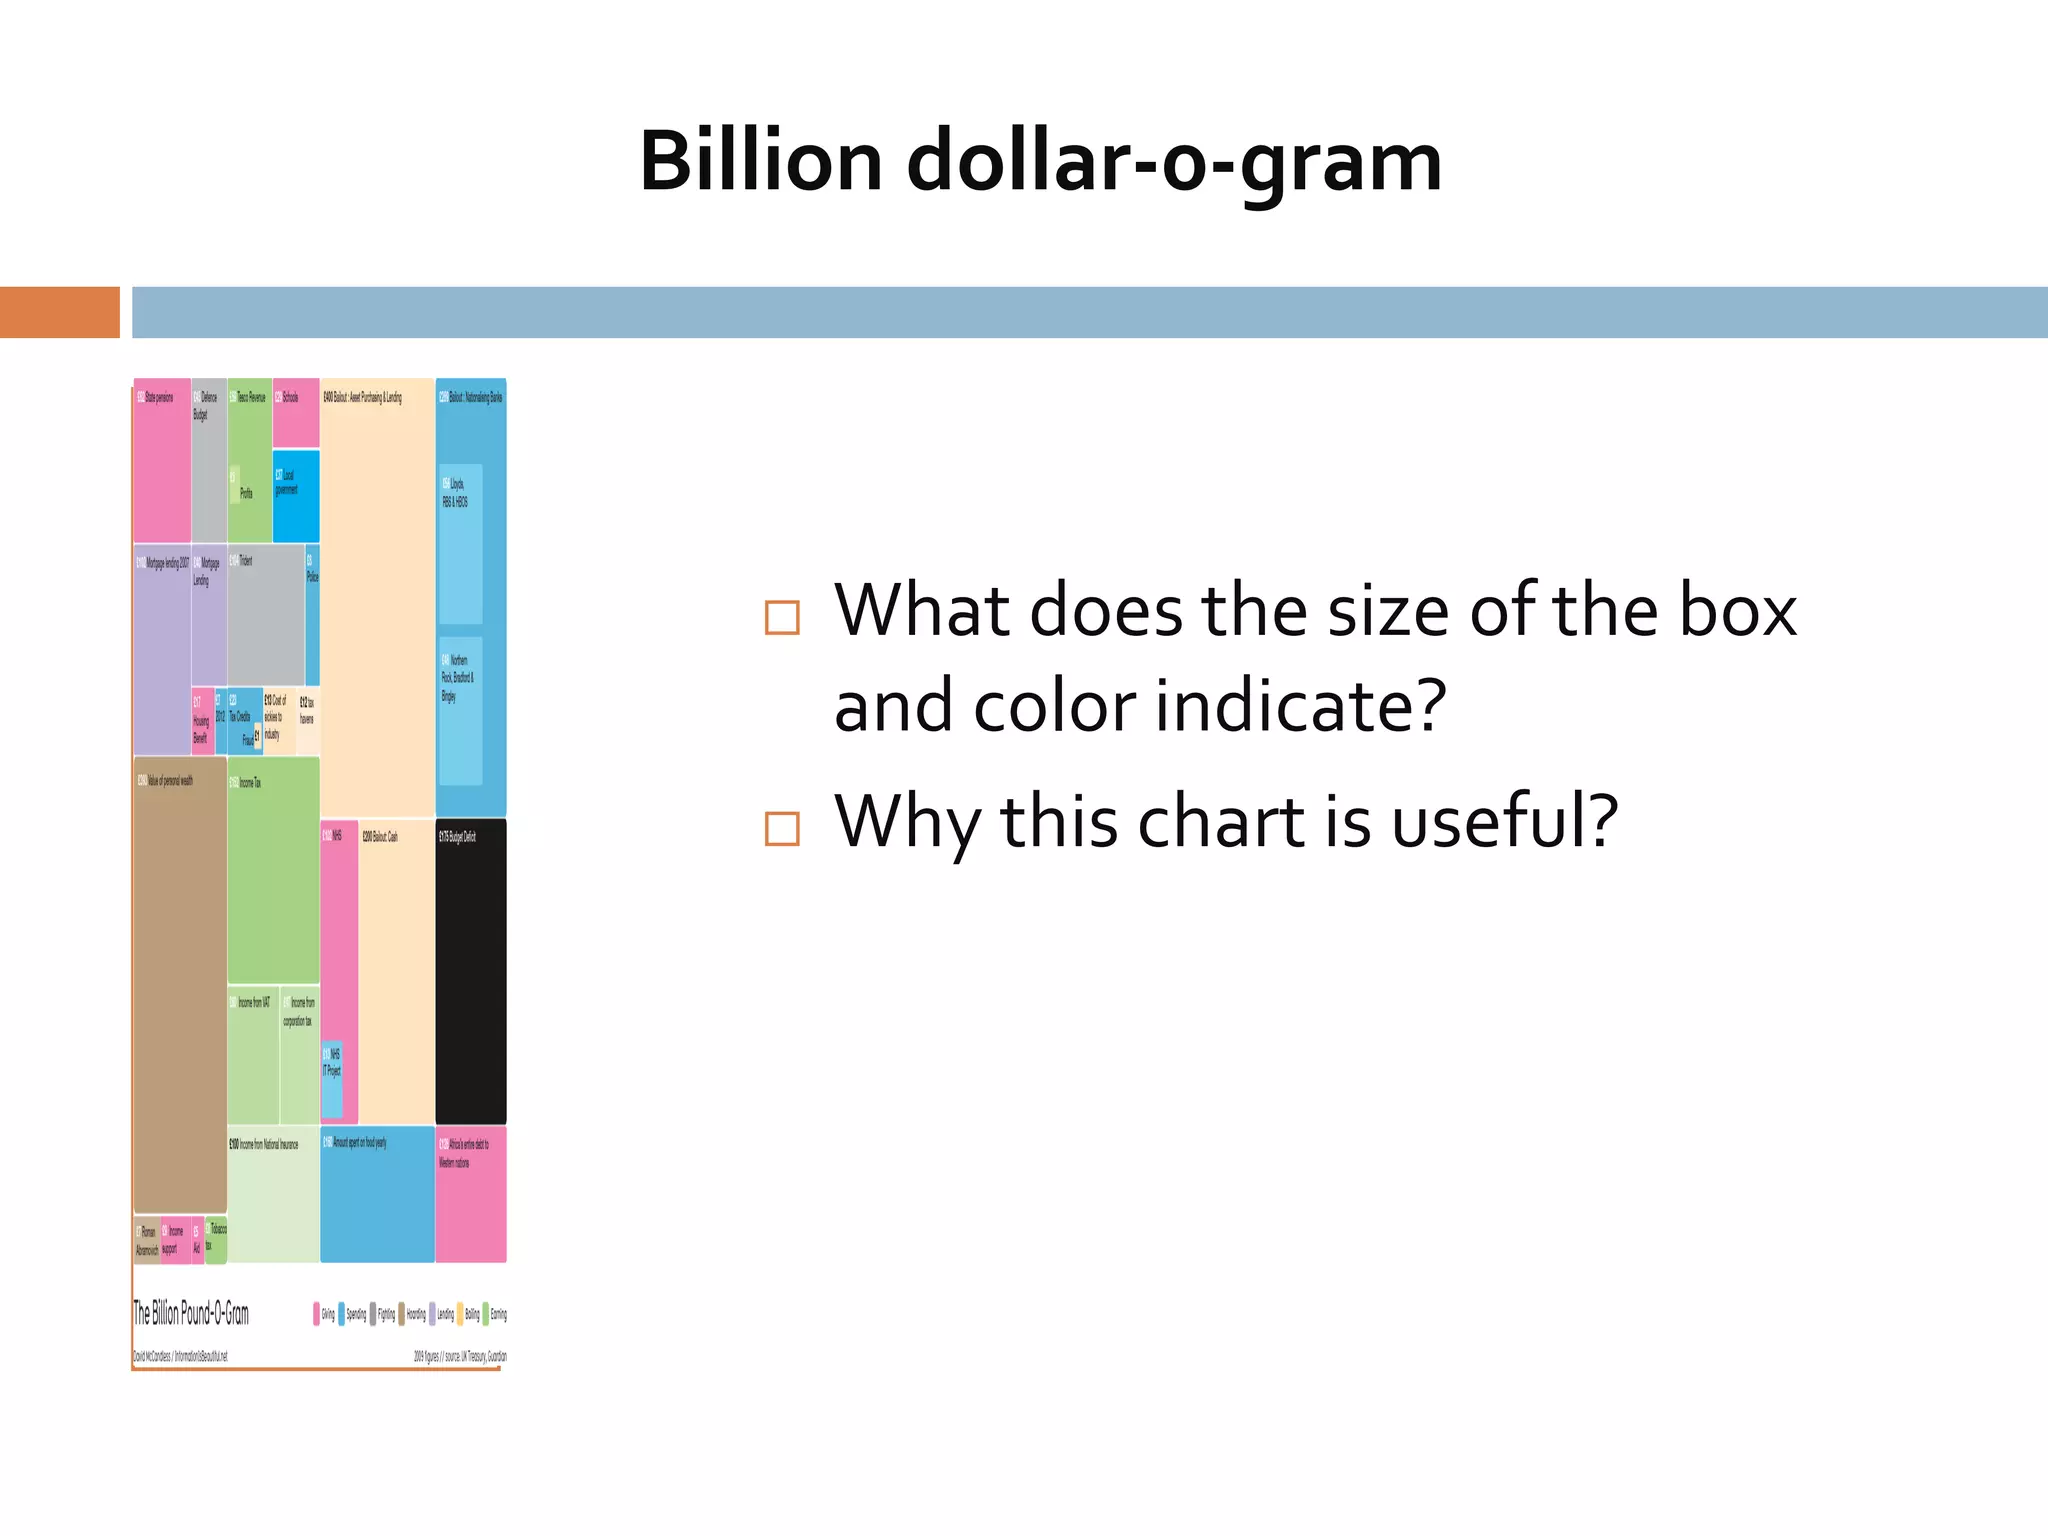
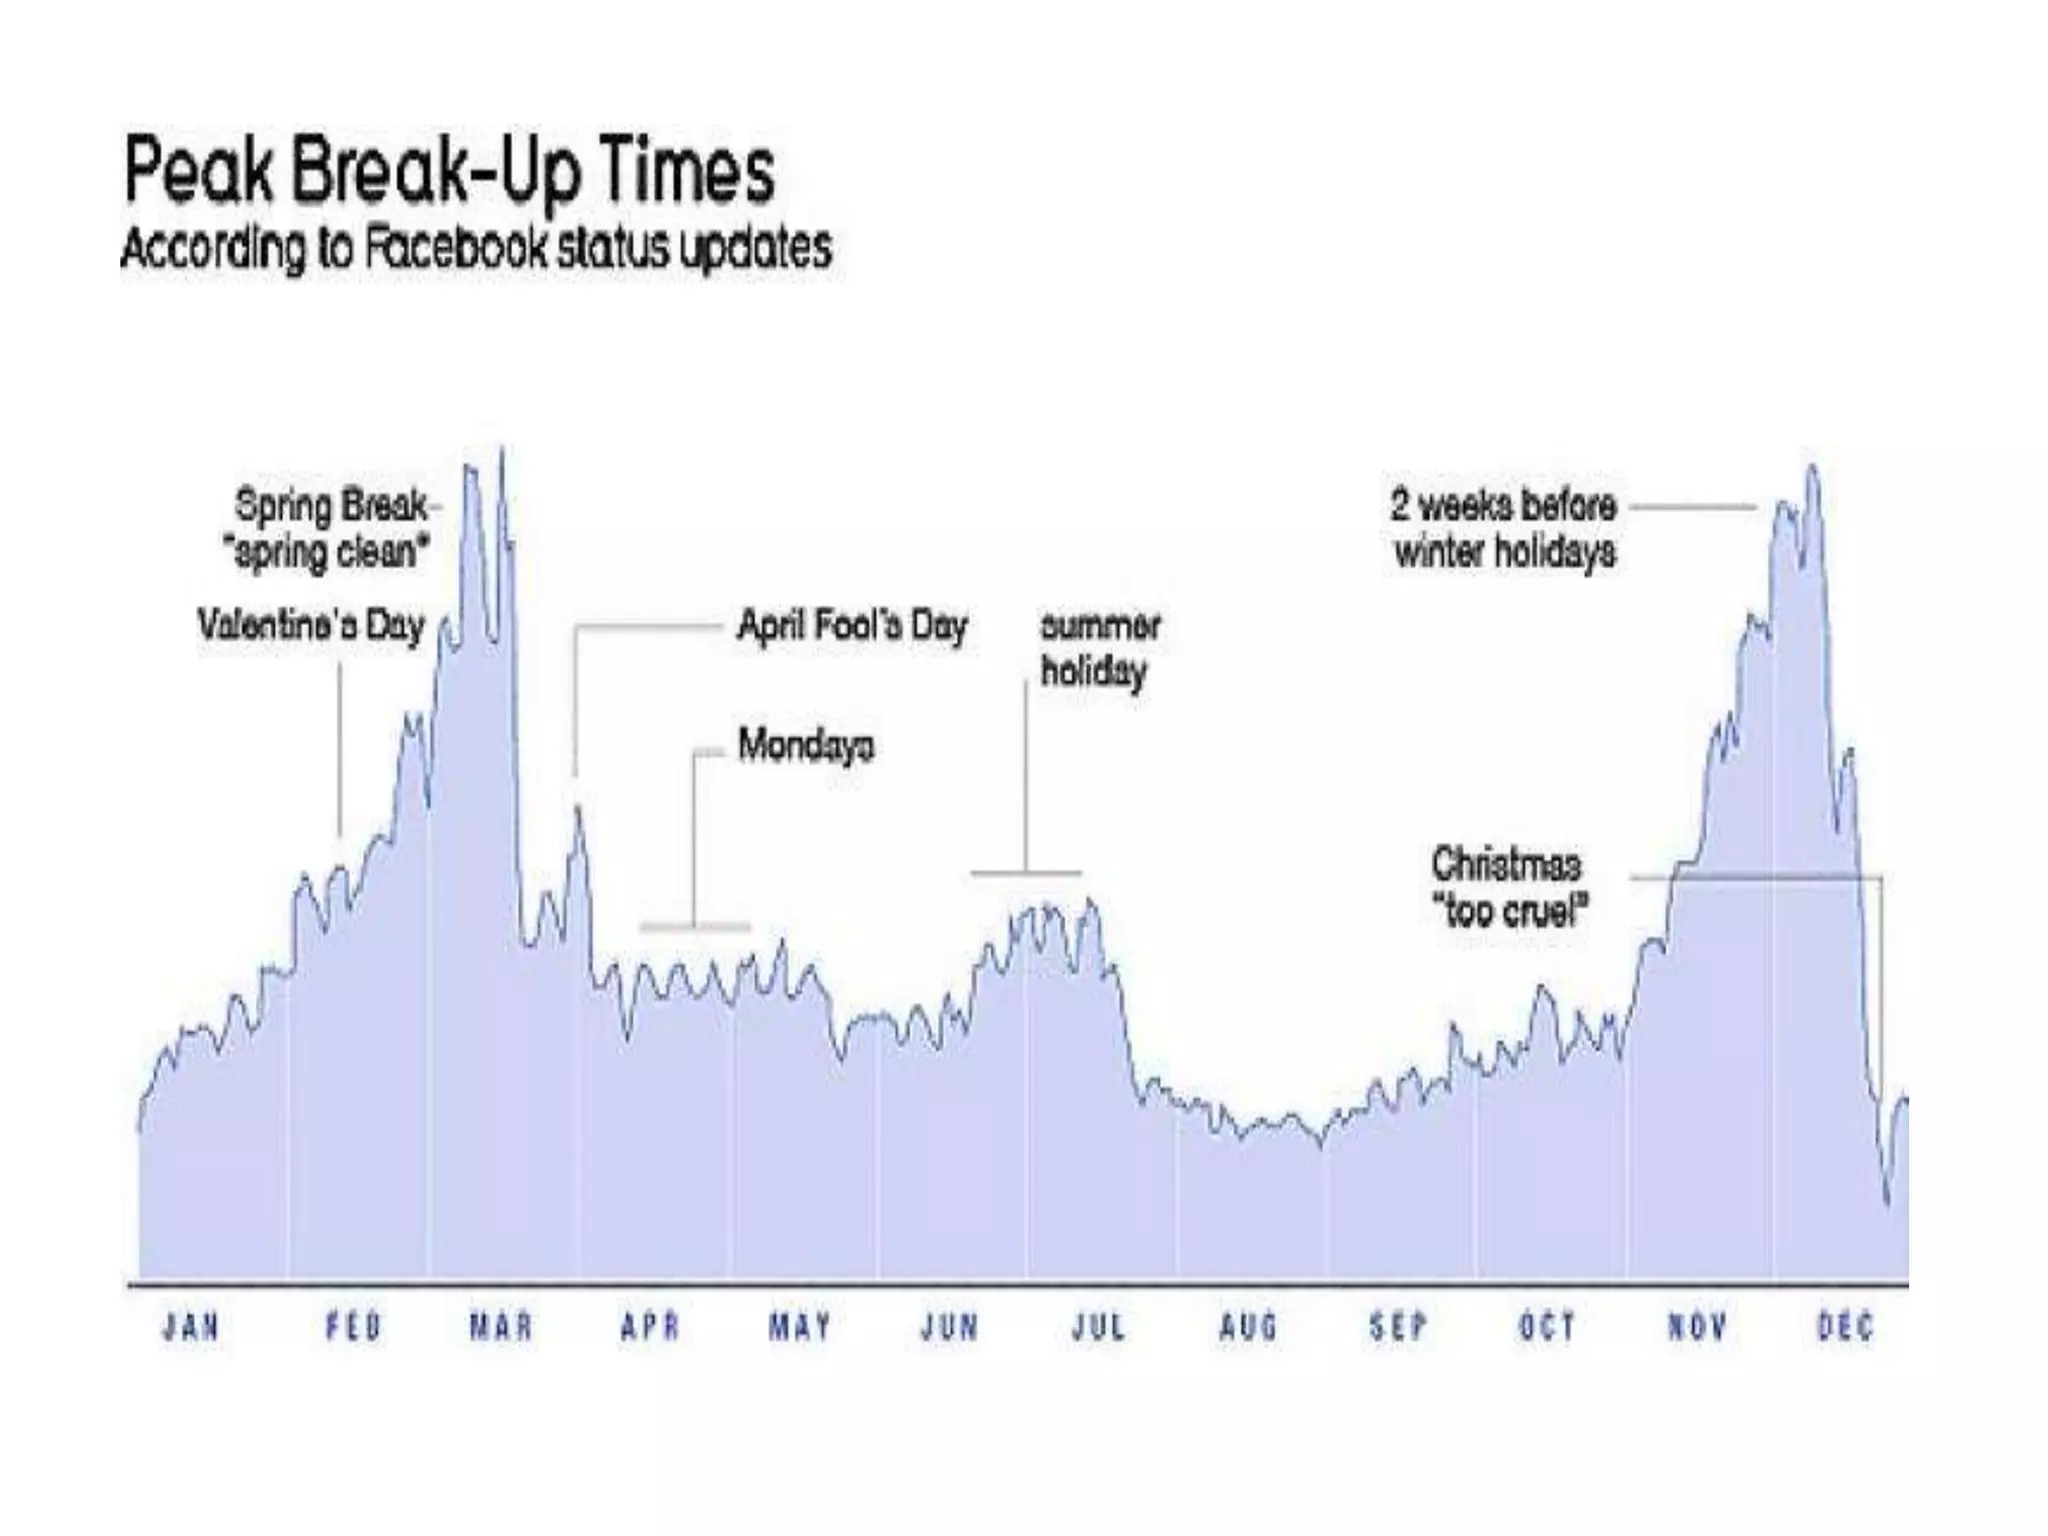
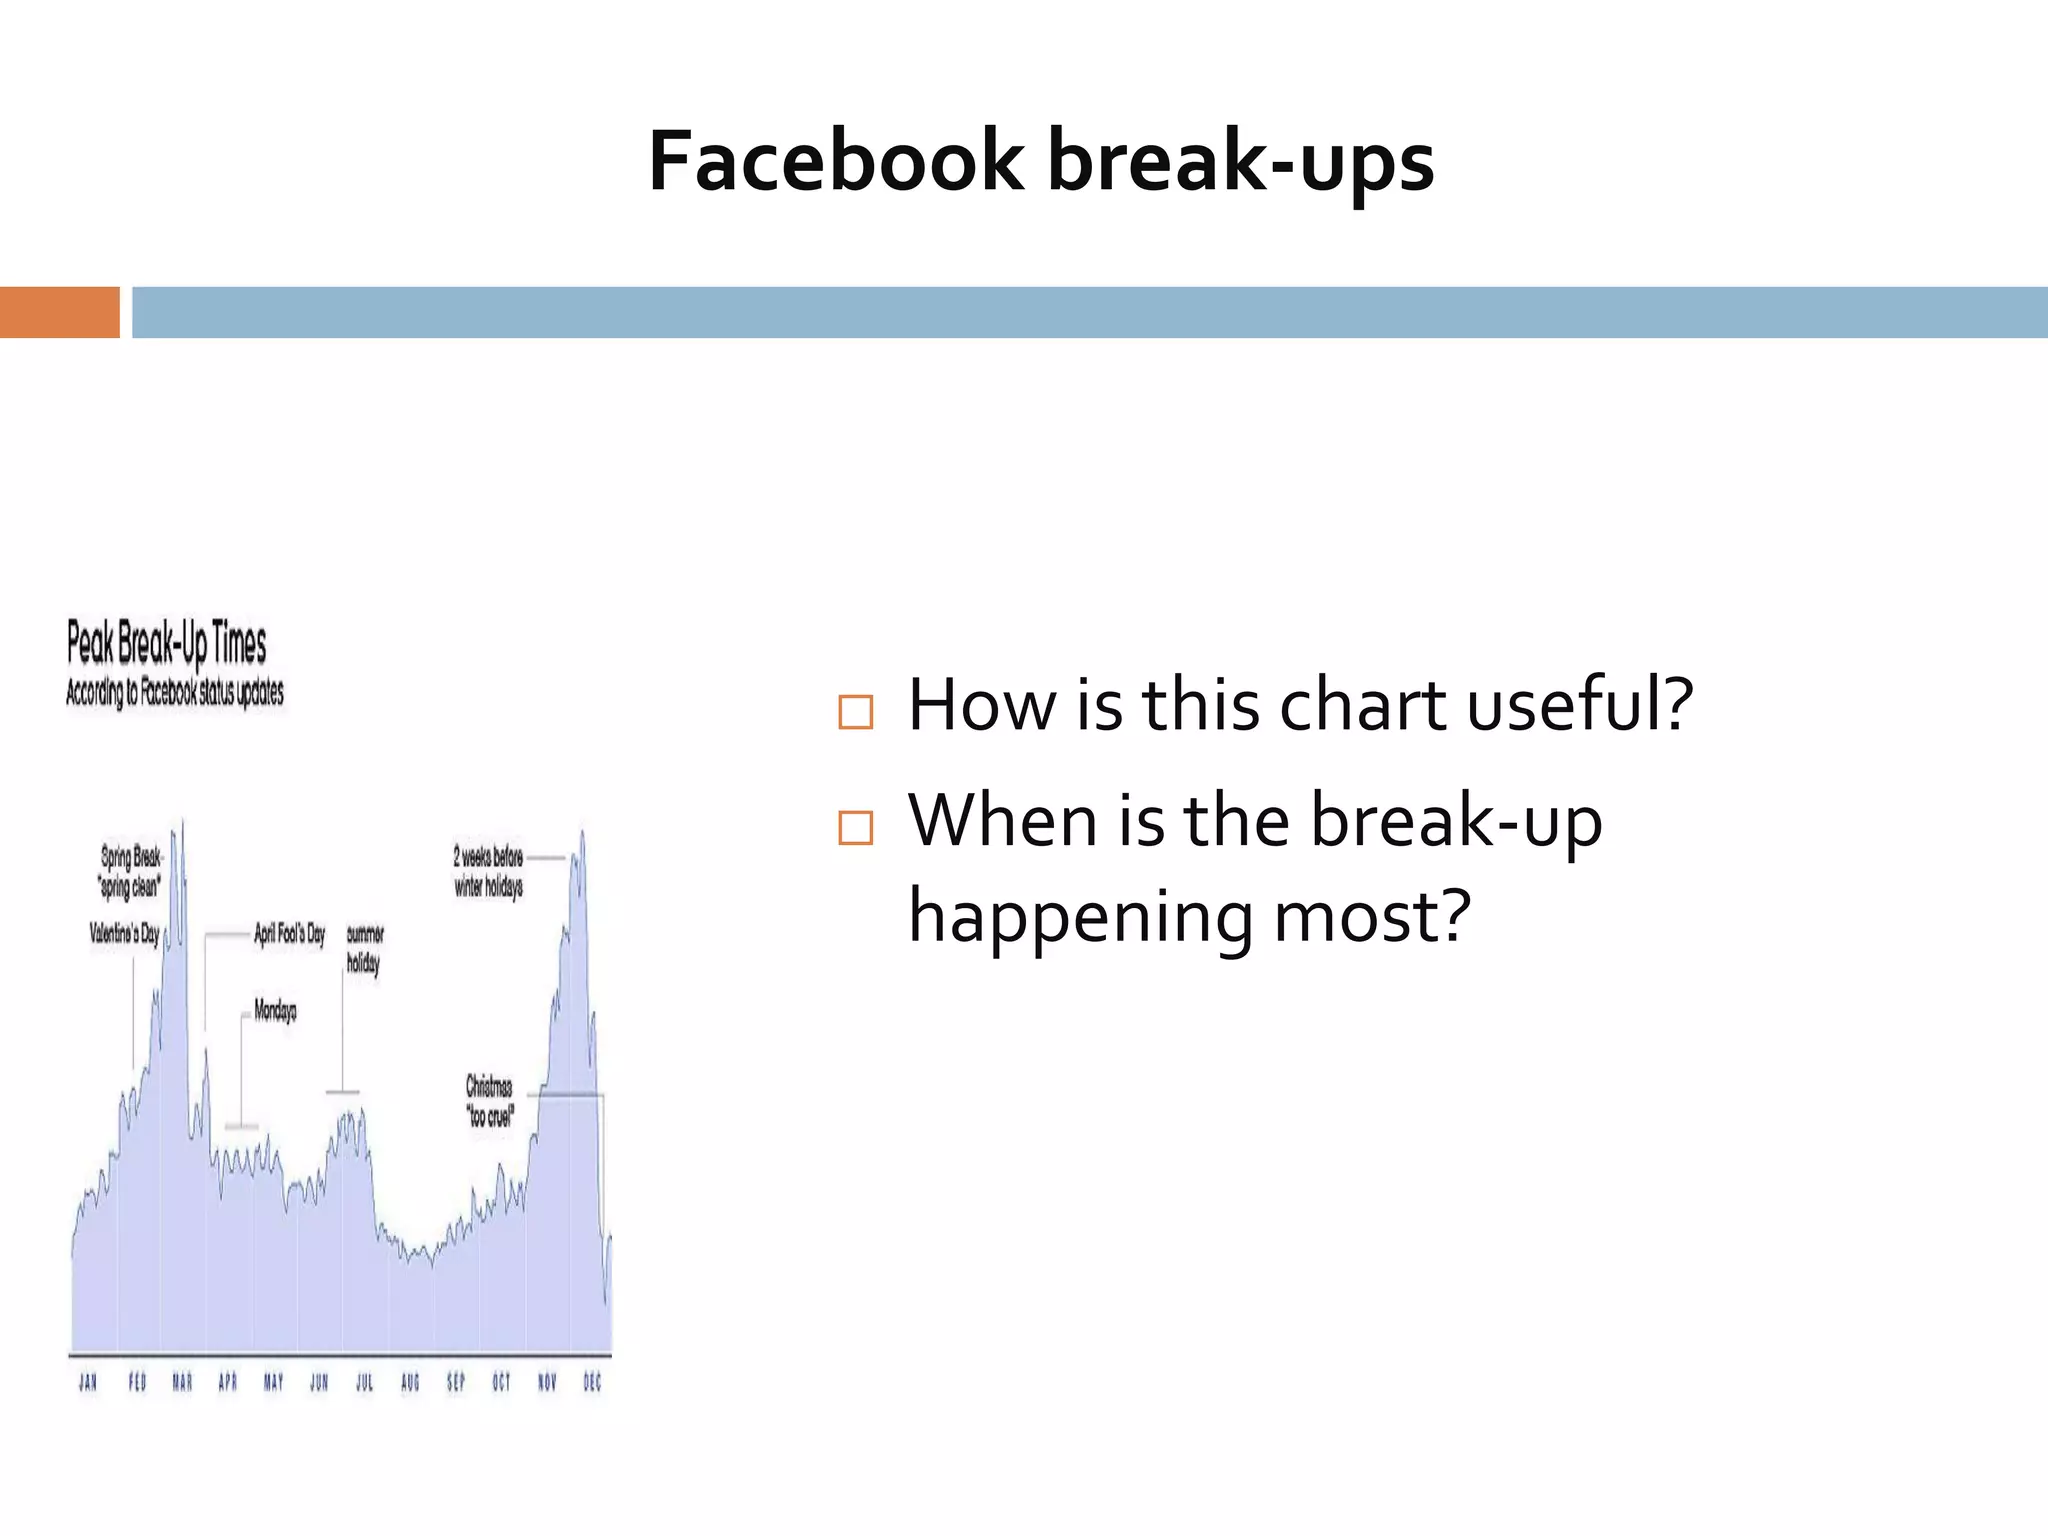
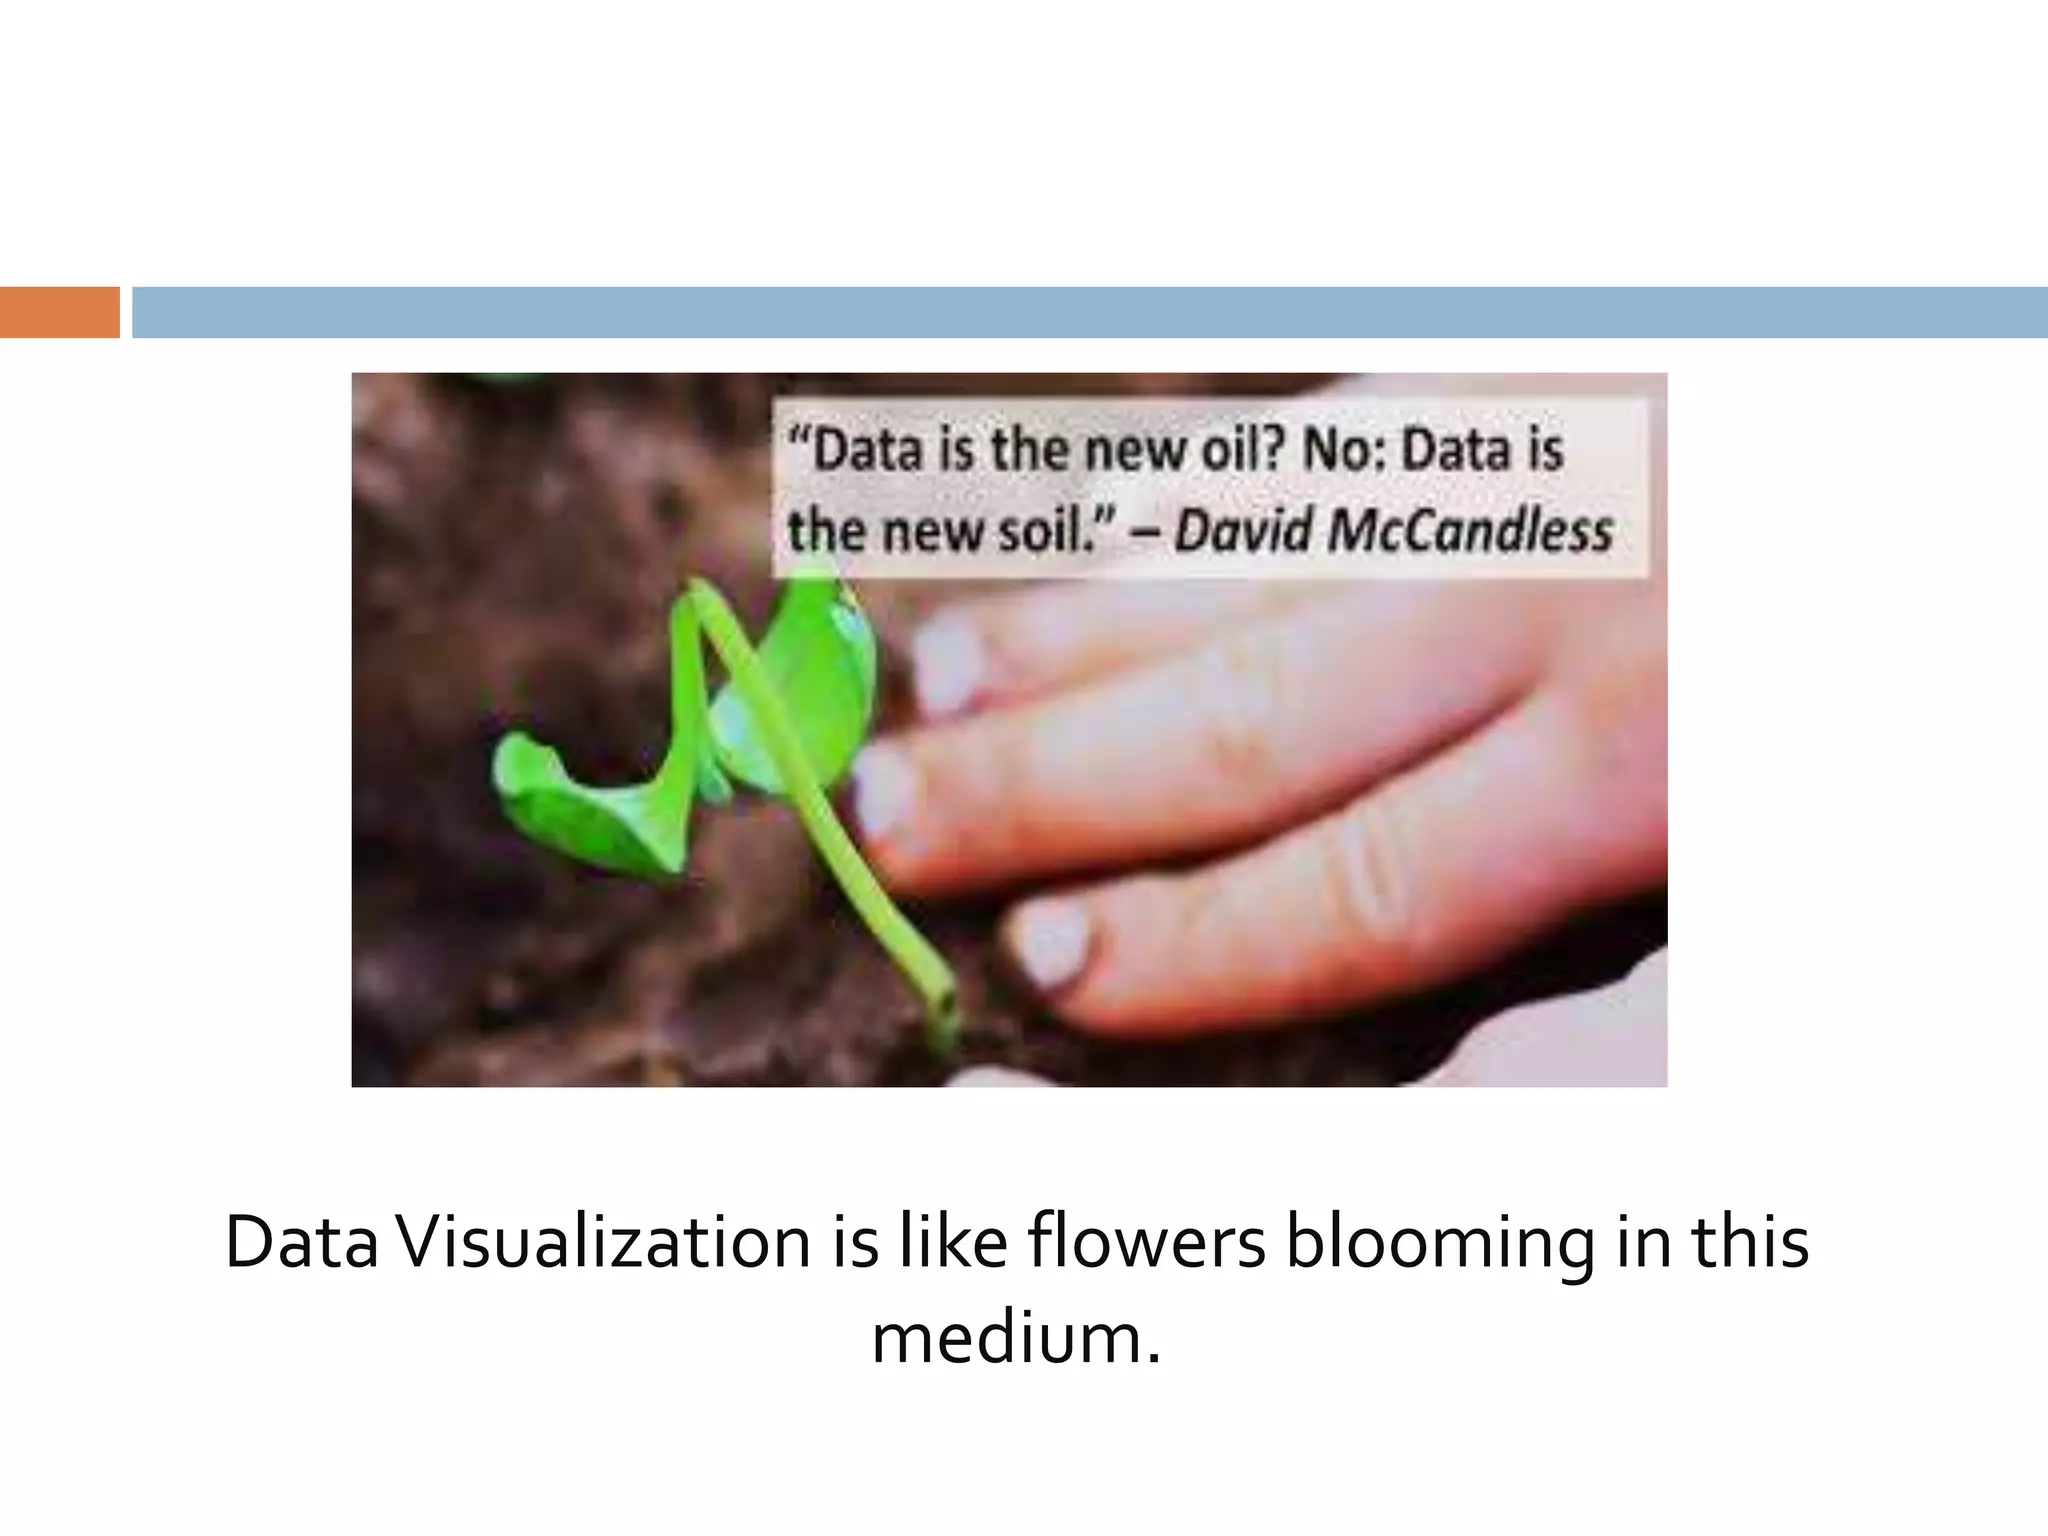
Data visualization is a set of processes that uses visual representations of data to help people understand patterns and insights more easily than textual data. It has several benefits, such as turning information into a visual landscape to focus on important details, helping new insights and innovations emerge. Effective data visualization examples include charts that use the size and color of boxes to indicate values or timeframes when certain events commonly happen. Overall, data visualization can help managers make sense of large amounts of information and find elegant solutions by transforming data into beautiful and clarifying graphics.