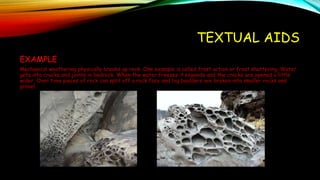
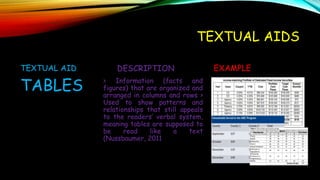
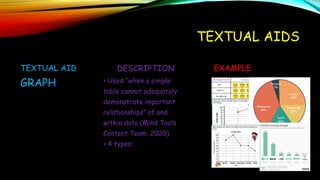
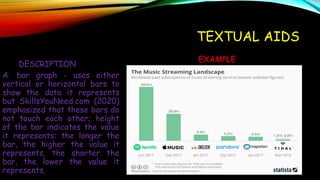
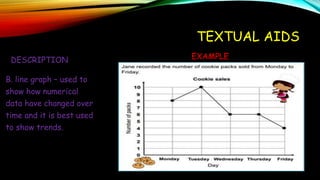
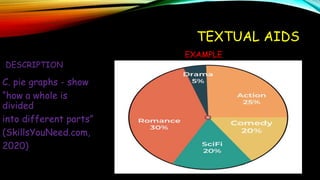
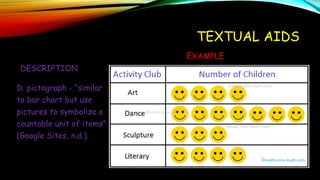
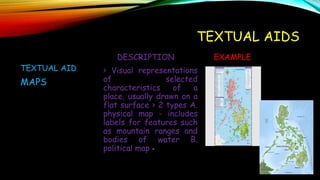
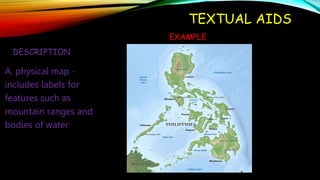
TEXTUAL AIDS
TEXTUAL AIDS
• - Textual aids refers to non-textual element that help readers
understand the content of the text. They also refer to
elements that stand-out from the main text such as titles and
subtitles, bold, italicized and underlined text. Non-textual
elements include illustrations, maps, tables, graph, and charts.
• -This aids have two main functions, namely first to direct the
reader’s attention to important ideas in text and second, to
provide more information as a supplement to what is already
written.
TEXTUAL AIDS
TEXTUAL AID
TITLES AND
SUBTITLES
DESCRIPTION
> Provide initial idea on what
the text is all about -
Activate prior knowledge on the
topic >
“Represent the key concepts
(title) and supporting ideas
(subtitles) in the paper” (Elite
Editing, 2015) -Layering or
positioning of these aids convey
the ideas’ level of importance
EXAMPLE
TEXTUAL AIDS
TEXTUAL AID
ILLUSTRATION
DESCRIPTION
> Visual representation
of a subject
> Facilitates better
retention of the
information presented
EXAMPLE
TEXTUAL AIDS
EXAMPLE
Mechanical weathering physically breaks up rock. One example is called frost action or frost shattering. Water
gets into cracks and joints in bedrock. When the water freezes it expands and the cracks are opened a little
wider. Over time pieces of rock can split off a rock face and big boulders are broken into smaller rocks and
gravel.
TEXTUAL AIDS
TEXTUAL AID
TABLES
DESCRIPTION
> Information (facts and
figures) that are organized and
arranged in columns and rows >
Used to show patterns and
relationships that still appeals
to the readers’ verbal system,
meaning tables are supposed to
be read like a text
(Nussbaumer, 2011
EXAMPLE
TEXTUAL AIDS
DESCRIPTION
> Column headings -
found on top of the
columns; used to
identify the contents of
a specific column
> Row headings - used
to define or identify the
contents of a specific row.
EXAMPLES
TEXTUAL AIDS
TEXTUAL AID
GRAPH
DESCRIPTION
> Used “when a simple
table cannot adequately
demonstrate important
relationships” of and
within data (Mind Tools
Content Team, 2020)
> 4 types:
EXAMPLE
TEXTUAL AIDS
DESCRIPTION
A. bar graph - uses either
vertical or horizontal bars to
show the data it represents
but SkillsYouNeed.com (2020)
emphasized that these bars do
not touch each other; height
of the bar indicates the value
it represents: the longer the
bar, the higher the value it
represents, the shorter the
bar, the lower the value it
represents.
EXAMPLE
TEXTUAL AIDS
DESCRIPTION
B. line graph – used to
show how numerical
data have changed over
time and it is best used
to show trends.
EXAMPLE
TEXTUAL AIDS
DESCRIPTION
EXAMPLE
C. pie graphs - show
“how a whole is
divided
into different parts”
(SkillsYouNeed.com,
2020)
TEXTUAL AIDS
DESCRIPTION
EXAMPLE
D. pictograph - “similar
to bar chart but use
pictures to symbolize a
countable unit of items”
(Google Sites, n.d.).
TEXTUAL AIDS
TEXTUAL AID
MAPS
DESCRIPTION
> Visual representations
of selected
characteristics of a
place, usually drawn on a
flat surface > 2 types A.
physical map - includes
labels for features such
as mountain ranges and
bodies of water B.
political map -
EXAMPLE
TEXTUAL AIDS
DESCRIPTION
A. physical map -
includes labels for
features such as
mountain ranges and
bodies of water
EXAMPLE
TEXTUAL AIDS
DESCRIPTION
B. political map - usually
includes labels for
features such as cities
and major towns, units
such as states or
provinces, and bodies of
water.
EXAMPLE

TEXTUAL_AIDS_G-10.pptx

  • 1.
  • 2.
    TEXTUAL AIDS • -Textual aids refers to non-textual element that help readers understand the content of the text. They also refer to elements that stand-out from the main text such as titles and subtitles, bold, italicized and underlined text. Non-textual elements include illustrations, maps, tables, graph, and charts. • -This aids have two main functions, namely first to direct the reader’s attention to important ideas in text and second, to provide more information as a supplement to what is already written.
  • 3.
    TEXTUAL AIDS TEXTUAL AID TITLESAND SUBTITLES DESCRIPTION > Provide initial idea on what the text is all about - Activate prior knowledge on the topic > “Represent the key concepts (title) and supporting ideas (subtitles) in the paper” (Elite Editing, 2015) -Layering or positioning of these aids convey the ideas’ level of importance EXAMPLE
  • 4.
    TEXTUAL AIDS TEXTUAL AID ILLUSTRATION DESCRIPTION >Visual representation of a subject > Facilitates better retention of the information presented EXAMPLE
  • 5.
    TEXTUAL AIDS EXAMPLE Mechanical weatheringphysically breaks up rock. One example is called frost action or frost shattering. Water gets into cracks and joints in bedrock. When the water freezes it expands and the cracks are opened a little wider. Over time pieces of rock can split off a rock face and big boulders are broken into smaller rocks and gravel.
  • 6.
    TEXTUAL AIDS TEXTUAL AID TABLES DESCRIPTION >Information (facts and figures) that are organized and arranged in columns and rows > Used to show patterns and relationships that still appeals to the readers’ verbal system, meaning tables are supposed to be read like a text (Nussbaumer, 2011 EXAMPLE
  • 7.
    TEXTUAL AIDS DESCRIPTION > Columnheadings - found on top of the columns; used to identify the contents of a specific column > Row headings - used to define or identify the contents of a specific row. EXAMPLES
  • 8.
    TEXTUAL AIDS TEXTUAL AID GRAPH DESCRIPTION >Used “when a simple table cannot adequately demonstrate important relationships” of and within data (Mind Tools Content Team, 2020) > 4 types: EXAMPLE
  • 9.
    TEXTUAL AIDS DESCRIPTION A. bargraph - uses either vertical or horizontal bars to show the data it represents but SkillsYouNeed.com (2020) emphasized that these bars do not touch each other; height of the bar indicates the value it represents: the longer the bar, the higher the value it represents, the shorter the bar, the lower the value it represents. EXAMPLE
  • 10.
    TEXTUAL AIDS DESCRIPTION B. linegraph – used to show how numerical data have changed over time and it is best used to show trends. EXAMPLE
  • 11.
    TEXTUAL AIDS DESCRIPTION EXAMPLE C. piegraphs - show “how a whole is divided into different parts” (SkillsYouNeed.com, 2020)
  • 12.
    TEXTUAL AIDS DESCRIPTION EXAMPLE D. pictograph- “similar to bar chart but use pictures to symbolize a countable unit of items” (Google Sites, n.d.).
  • 13.
    TEXTUAL AIDS TEXTUAL AID MAPS DESCRIPTION >Visual representations of selected characteristics of a place, usually drawn on a flat surface > 2 types A. physical map - includes labels for features such as mountain ranges and bodies of water B. political map - EXAMPLE
  • 14.
    TEXTUAL AIDS DESCRIPTION A. physicalmap - includes labels for features such as mountain ranges and bodies of water EXAMPLE
  • 15.
    TEXTUAL AIDS DESCRIPTION B. politicalmap - usually includes labels for features such as cities and major towns, units such as states or provinces, and bodies of water. EXAMPLE