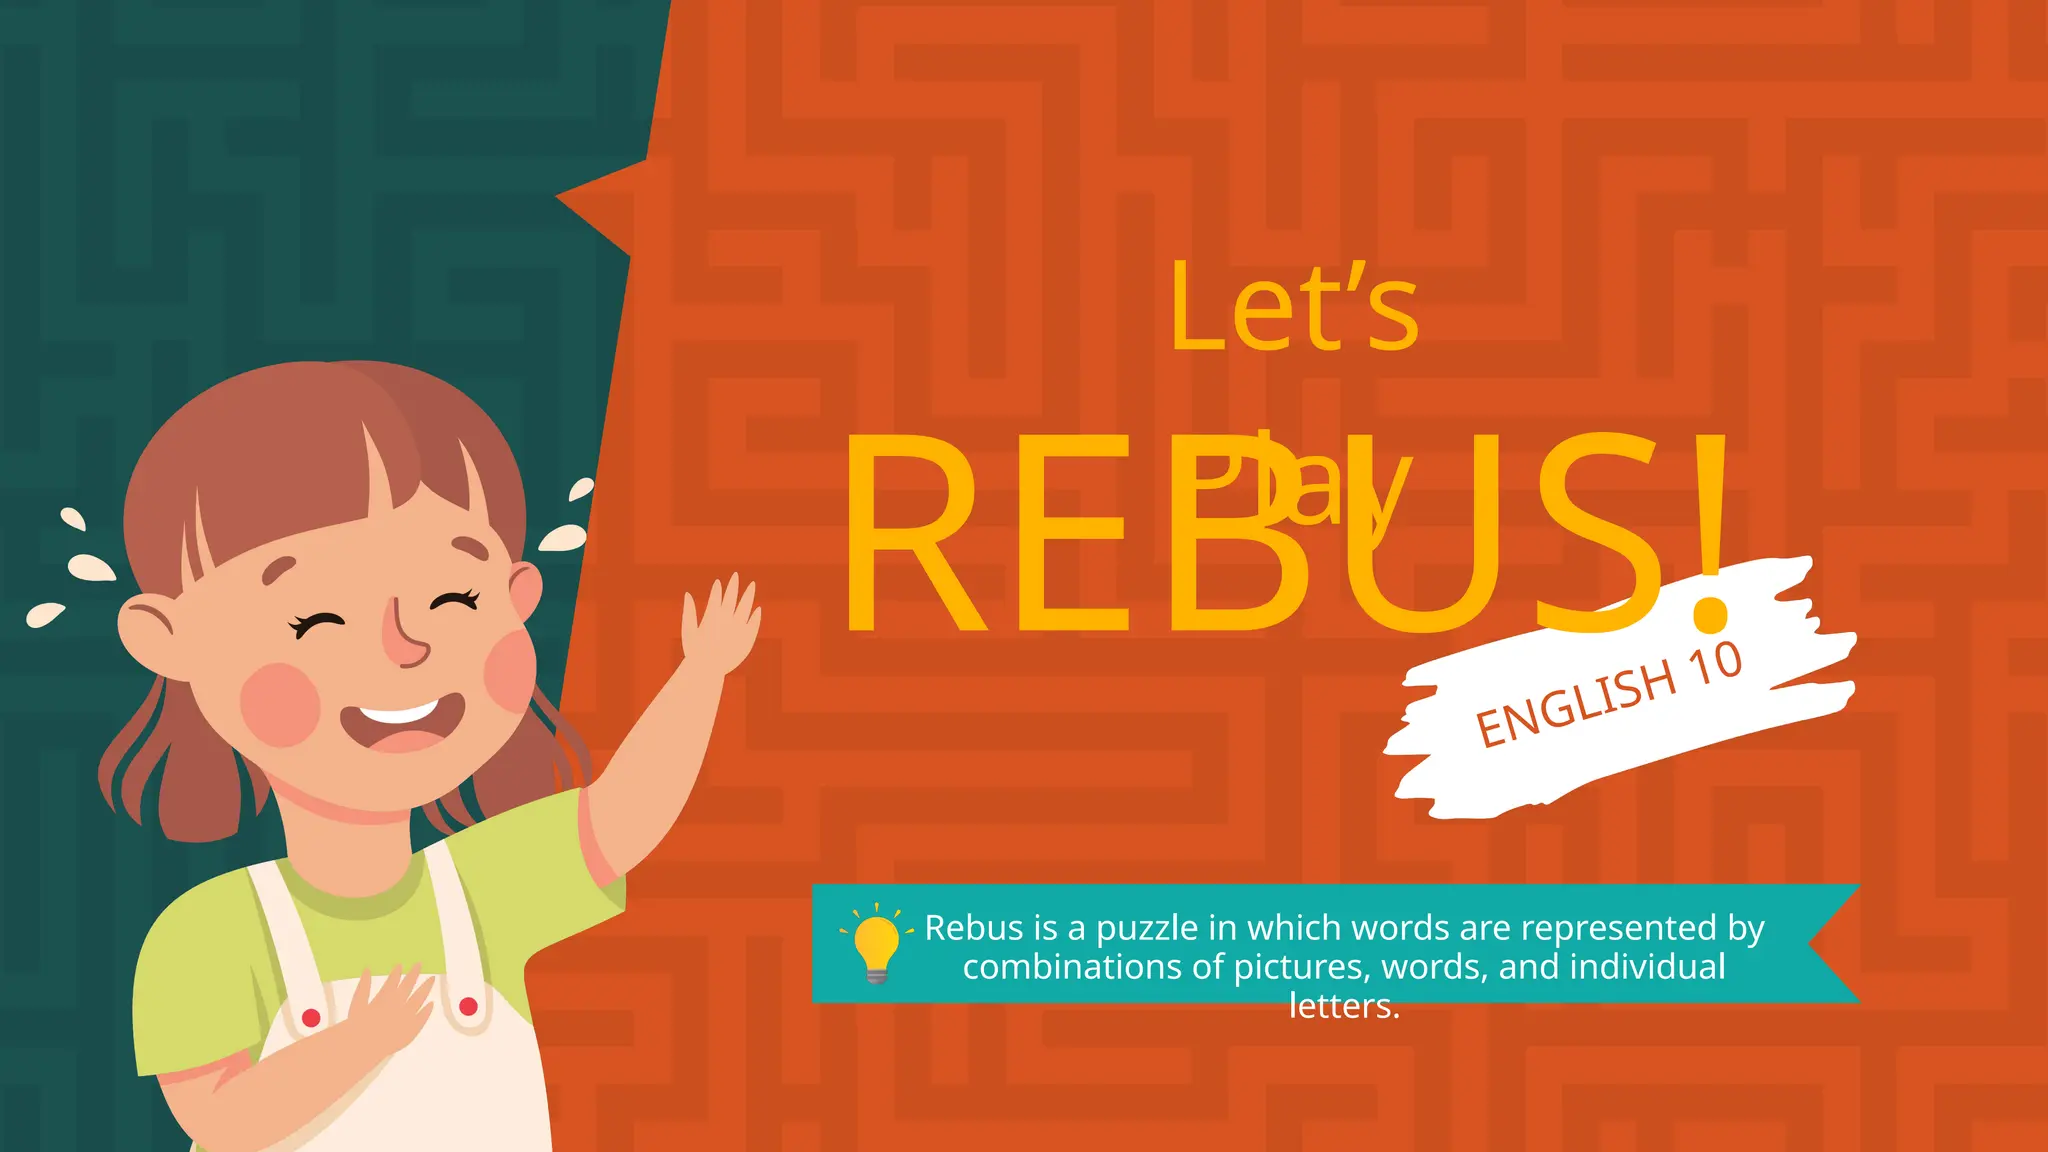
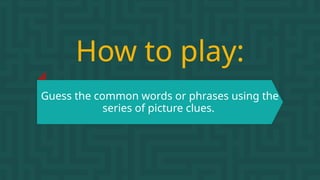
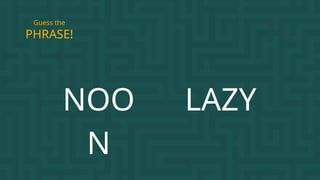
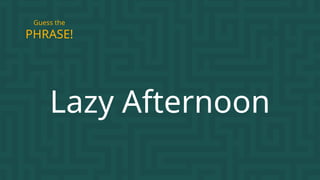
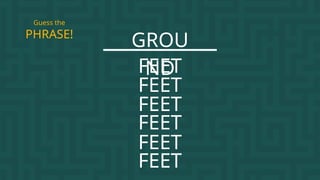
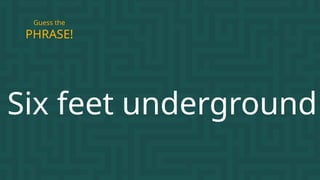
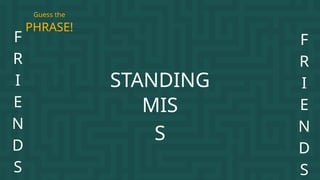
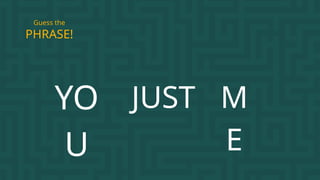
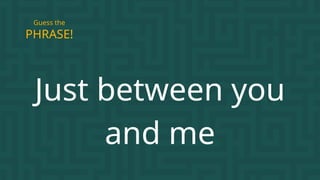
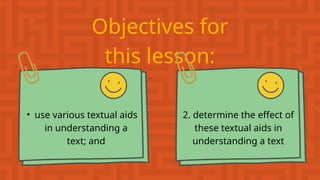
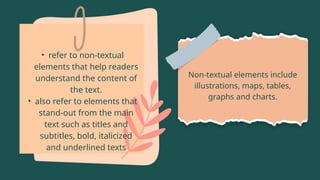
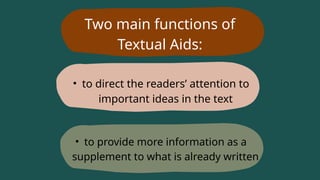
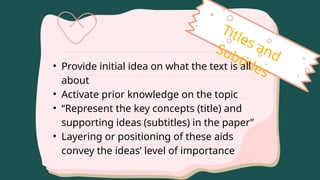
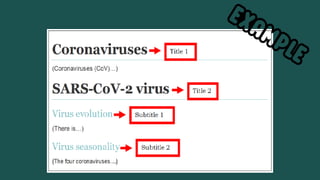
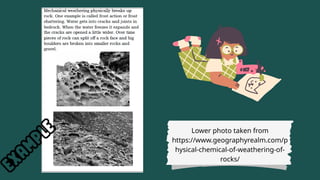
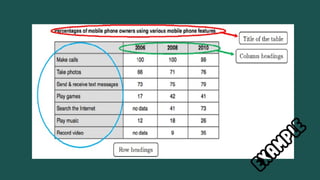
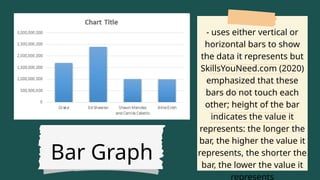
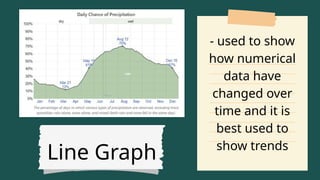
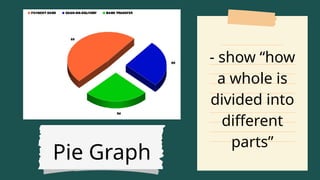
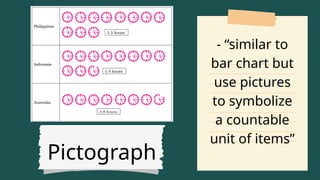
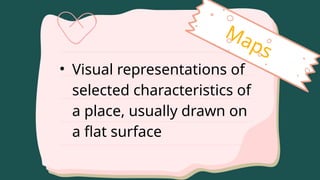
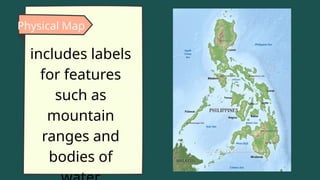
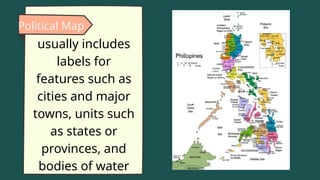
REBUS!
Let’s
Play
Rebus is a puzzle in which words are represented by
combinations of pictures, words, and individual
letters.
ENGLISH 10
How to play:
Guess the common words or phrases using the
series of picture clues.
Example
View
PHRASE!
Guess the
Let's Play!
NOO
N
LAZY
PHRASE!
Guess the
Lazy Afternoon
PHRASE!
Guess the
GROU
ND
PHRASE!
Guess the
FEET
FEET
FEET
FEET
FEET
FEET
Six feet underground
PHRASE!
Guess the
F
R
I
E
N
D
S
STANDING
MIS
S
PHRASE!
Guess the
F
R
I
E
N
D
S
Misunderstanding
between friends
PHRASE!
Guess the
PHRASE!
Guess the
YO
U
JUST M
E
Just between you
and me
PHRASE!
Guess the
DEAL
PHRASE!
Guess the
Big deal
PHRASE!
Guess the
PHRASE!
Guess the
X Q Q Q Q M
E
Excuse me
PHRASE!
Guess the
TEXTUAL AIDS
Objectives for
this lesson:
• use various textual aids
in understanding a
text; and
2. determine the effect of
these textual aids in
understanding a text
• refer to non-textual
elements that help readers
understand the content of
the text.
• also refer to elements that
stand-out from the main
text such as titles and
subtitles, bold, italicized
and underlined texts
Non-textual elements include
illustrations, maps, tables,
graphs and charts.
Two main functions of
Textual Aids:
• to direct the readers’ attention to
important ideas in the text
• to provide more information as a
supplement to what is already written
Titles and
Subtitles
• Provide initial idea on what the text is all
about
• Activate prior knowledge on the topic
• “Represent the key concepts (title) and
supporting ideas (subtitles) in the paper”
• Layering or positioning of these aids
convey the ideas’ level of importance
Illustration
• Visual representation of a
subject
• Facilitates better retention
of the information
presented
Lower photo taken from
https://www.geographyrealm.com/p
hysical-chemical-of-weathering-of-
rocks/
Tables
• Information (facts and figures) that are
organized and arranged in columns and
rows
• Used to show patterns and
relationships that still appeals to the
readers’ verbal system, meaning tables
are supposed to be read like a text
(Nussbaumer, 2011)
Tables
• Column headings - found on top of
the columns; used to identify the
contents of a specific column
• Row headings - used to define or
identify the contents of a specific
row
Graphs
• Used “when a simple table
cannot adequately
demonstrate important
relationships” of and within
data (Mind Tools Content
Team, 2020)
Bar Graph
- uses either vertical or
horizontal bars to show
the data it represents but
SkillsYouNeed.com (2020)
emphasized that these
bars do not touch each
other; height of the bar
indicates the value it
represents: the longer the
bar, the higher the value it
represents, the shorter the
bar, the lower the value it
represents
Line Graph
- used to show
how numerical
data have
changed over
time and it is
best used to
show trends
Pie Graph
- show “how
a whole is
divided into
different
parts”
Pictograph
- “similar to
bar chart but
use pictures
to symbolize
a countable
unit of items”
Maps
• Visual representations of
selected characteristics of
a place, usually drawn on
a flat surface
Physical Map
includes labels
for features
such as
mountain
ranges and
bodies of
Political Map
usually includes
labels for
features such as
cities and major
towns, units such
as states or
provinces, and
bodies of water
Questions?
Textual aids help a
lot in
understanding
information in a
text.
These aids
have two
functions.
There are several
examples of textual
aids.
• What's More
• What I have
learned

TEXTUAL AIDS GRADE10.pptx for teacher use