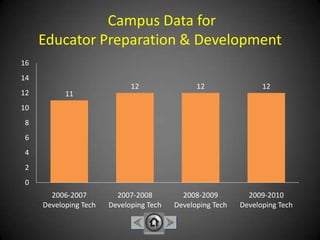
Texas STaR Chart Data ResultsforHurst Hills Elementary
AgendaWhat is the STaR Chart?Review each STaR Chart CategoryReview Campus DataPlan for ImprovementConclusion
School Technology and Readiness ChartAssessment of Technology Integration in the ClassroomAligns with Texas’ Long-Range Plan for Technology – “Vision 2020”Developed Around 4 Key Areas
“Teaching and Learning”Six Focus Areas to AddressTechnology Integration to Teach Concepts and SkillsAvailability of Technology for Classroom LearningTechnology TEKS Integrated into LearningWeb-based Lessons and Online Resources Used
Campus Data for Teaching and Learning
What Does the Data Show?What trends do you notice?How can you improve in this area?How can your grade level improve?How can Hurst Hills improve?
“Educator Preparation & Development”Six Focus Areas to AddressContent  & Availability of Professional DevelopmentEducator Capabilities – SBEC Technology Application StandardsUse of Online Learning and Teaching
 Campus Data for Educator Preparation & Development
What Does the Data Show?What trends do you notice?How can you improve in this area?How can your grade level improve?How can Hurst Hills improve?
“Leadership, Administration, and Instructional Support”Six Focus Areas to AddressShared Vision of Campus Technology IntegrationCampus Improvement Plan Aligns with SBEC Technology StandardsSupport and Funding for Technology and Professional Development Available
Campus Data for Leadership, Administration and Instructional Support
What Does the Data Show?What trends do you notice?How can you improve in this area?How can your grade level improve?How can Hurst Hills improve?
“Infrastructure For Technology”Six Focus Areas to AddressStudent and Educator Access to Technology Resources and InternetTechnical Support Staff AvailableOnline Learning Supported by Sufficient Bandwith and Local/Wide Area Networks (LAN/WAN)
Campus Data for Infrastructure for Technology
What Does the Data Show?What trends do you notice?How can you improve in this area?How can your grade level improve?How can Hurst Hills improve?
In ConclusionSTaR Chart Data is…A Guide for Campus Technology Decision-Making and Budget AllocationA Guide for Future Professional DevelopmentA Measurement of Progress towards   “Vision 2020”
Your Questions or Comments?

Texas STaR Chart Presentation

  • 1.
    Texas STaR ChartData ResultsforHurst Hills Elementary
  • 2.
    AgendaWhat is theSTaR Chart?Review each STaR Chart CategoryReview Campus DataPlan for ImprovementConclusion
  • 3.
    School Technology andReadiness ChartAssessment of Technology Integration in the ClassroomAligns with Texas’ Long-Range Plan for Technology – “Vision 2020”Developed Around 4 Key Areas
  • 4.
    “Teaching and Learning”SixFocus Areas to AddressTechnology Integration to Teach Concepts and SkillsAvailability of Technology for Classroom LearningTechnology TEKS Integrated into LearningWeb-based Lessons and Online Resources Used
  • 5.
    Campus Data forTeaching and Learning
  • 6.
    What Does theData Show?What trends do you notice?How can you improve in this area?How can your grade level improve?How can Hurst Hills improve?
  • 7.
    “Educator Preparation &Development”Six Focus Areas to AddressContent & Availability of Professional DevelopmentEducator Capabilities – SBEC Technology Application StandardsUse of Online Learning and Teaching
  • 8.
    Campus Datafor Educator Preparation & Development
  • 9.
    What Does theData Show?What trends do you notice?How can you improve in this area?How can your grade level improve?How can Hurst Hills improve?
  • 10.
    “Leadership, Administration, andInstructional Support”Six Focus Areas to AddressShared Vision of Campus Technology IntegrationCampus Improvement Plan Aligns with SBEC Technology StandardsSupport and Funding for Technology and Professional Development Available
  • 11.
    Campus Data forLeadership, Administration and Instructional Support
  • 12.
    What Does theData Show?What trends do you notice?How can you improve in this area?How can your grade level improve?How can Hurst Hills improve?
  • 13.
    “Infrastructure For Technology”SixFocus Areas to AddressStudent and Educator Access to Technology Resources and InternetTechnical Support Staff AvailableOnline Learning Supported by Sufficient Bandwith and Local/Wide Area Networks (LAN/WAN)
  • 14.
    Campus Data forInfrastructure for Technology
  • 15.
    What Does theData Show?What trends do you notice?How can you improve in this area?How can your grade level improve?How can Hurst Hills improve?
  • 16.
    In ConclusionSTaR ChartData is…A Guide for Campus Technology Decision-Making and Budget AllocationA Guide for Future Professional DevelopmentA Measurement of Progress towards “Vision 2020”
  • 17.