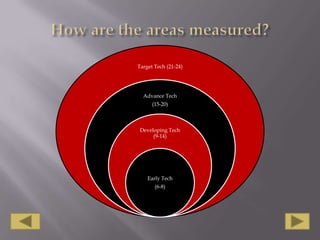
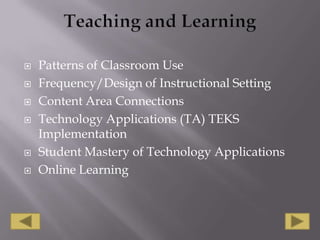
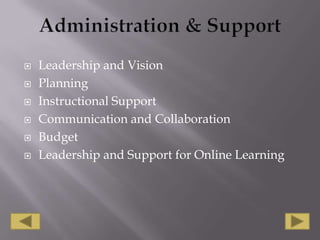
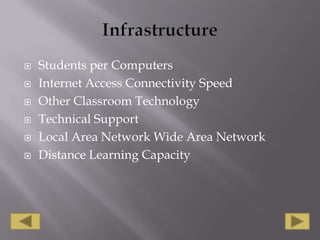
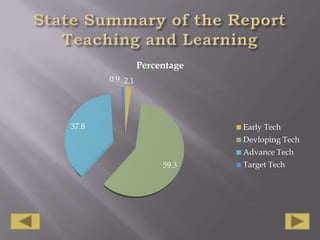
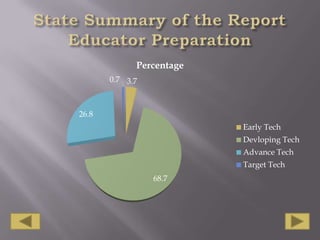
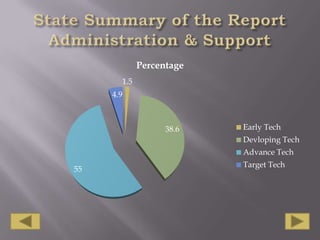
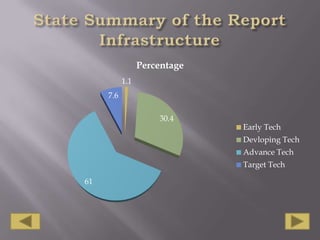
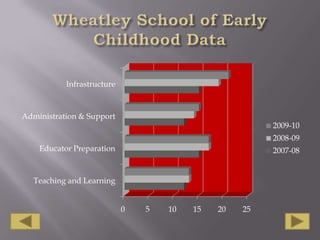
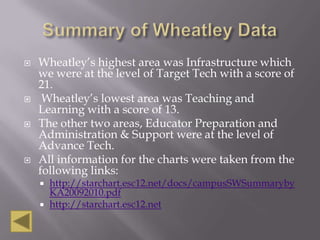
Texas Star Chart DataBy Pamela JonesEDLD 5352March 2011
AgendaWhat are is the Texas Star Chart?What are the four areas of the Texas Star Chart?How are the areas measured?Teaching and LearningEducator Preparation Administration & SupportInfrastructureTexas Star Chart DataWheatley School of Early Childhood DataSummary of the Report
What are is the Texas Star Chart?The STaR Chart is a Resource Tool used to evaluate school campuses progress towards the Long Range Plan for Technology, 2006-2020. It is also a Teacher Tool for Planning and Self-Assessing aligned with the  Long-Range Plan for Technology, 2006-2020.STaR stands for - School Technology and Readiness.
What are the four areas of the Texas Star Chart?
How are the areas measured?
Now let’s break down the four areas of the STaR Chart Assessments….
Teaching and LearningPatterns of Classroom UseFrequency/Design of Instructional SettingContent Area ConnectionsTechnology Applications (TA) TEKS ImplementationStudent Mastery of Technology ApplicationsOnline Learning
Educator Preparation Professional Development ExperiencesModels of Professional DevelopmentCapabilities of EducatorsAccess to ProfessionalDevelopmentLevels of Understanding and Patterns of UseProfessional DevelopmentforOnlineLearning
Administration & SupportLeadership and VisionPlanning Instructional SupportCommunication and CollaborationBudget Leadership and Support for Online Learning
InfrastructureStudents per ComputersInternet Access Connectivity SpeedOther Classroom TechnologyTechnical SupportLocal Area Network Wide Area NetworkDistance Learning Capacity
Now lets take a look at the state’s overall percentages in the four areas….
State Summary of the Report Teaching and Learning
State Summary of the Report Educator Preparation
State Summary of the Report Administration & Support
State Summary of the Report Infrastructure
Now about Wheatley…….
Wheatley School of Early Childhood Data
Summary of Wheatley DataWheatley’s highest area was Infrastructure which we were at the level of Target Tech with a score of 21. Wheatley’s lowest area was Teaching and Learning with a score of 13.The other two areas, Educator Preparation and Administration & Support were at the level of Advance Tech. All information for the charts were taken from the following links:http://starchart.esc12.net/docs/campusSWSummarybyKA20092010.pdfhttp://starchart.esc12.net

Texas star chart data presentation

  • 1.
    Texas Star ChartDataBy Pamela JonesEDLD 5352March 2011
  • 2.
    AgendaWhat are isthe Texas Star Chart?What are the four areas of the Texas Star Chart?How are the areas measured?Teaching and LearningEducator Preparation Administration & SupportInfrastructureTexas Star Chart DataWheatley School of Early Childhood DataSummary of the Report
  • 3.
    What are isthe Texas Star Chart?The STaR Chart is a Resource Tool used to evaluate school campuses progress towards the Long Range Plan for Technology, 2006-2020. It is also a Teacher Tool for Planning and Self-Assessing aligned with the  Long-Range Plan for Technology, 2006-2020.STaR stands for - School Technology and Readiness.
  • 4.
    What are thefour areas of the Texas Star Chart?
  • 5.
    How are theareas measured?
  • 6.
    Now let’s breakdown the four areas of the STaR Chart Assessments….
  • 7.
    Teaching and LearningPatternsof Classroom UseFrequency/Design of Instructional SettingContent Area ConnectionsTechnology Applications (TA) TEKS ImplementationStudent Mastery of Technology ApplicationsOnline Learning
  • 8.
    Educator Preparation ProfessionalDevelopment ExperiencesModels of Professional DevelopmentCapabilities of EducatorsAccess to ProfessionalDevelopmentLevels of Understanding and Patterns of UseProfessional DevelopmentforOnlineLearning
  • 9.
    Administration & SupportLeadershipand VisionPlanning Instructional SupportCommunication and CollaborationBudget Leadership and Support for Online Learning
  • 10.
    InfrastructureStudents per ComputersInternetAccess Connectivity SpeedOther Classroom TechnologyTechnical SupportLocal Area Network Wide Area NetworkDistance Learning Capacity
  • 11.
    Now lets takea look at the state’s overall percentages in the four areas….
  • 12.
    State Summary ofthe Report Teaching and Learning
  • 13.
    State Summary ofthe Report Educator Preparation
  • 14.
    State Summary ofthe Report Administration & Support
  • 15.
    State Summary ofthe Report Infrastructure
  • 16.
  • 17.
    Wheatley School ofEarly Childhood Data
  • 18.
    Summary of WheatleyDataWheatley’s highest area was Infrastructure which we were at the level of Target Tech with a score of 21. Wheatley’s lowest area was Teaching and Learning with a score of 13.The other two areas, Educator Preparation and Administration & Support were at the level of Advance Tech. All information for the charts were taken from the following links:http://starchart.esc12.net/docs/campusSWSummarybyKA20092010.pdfhttp://starchart.esc12.net