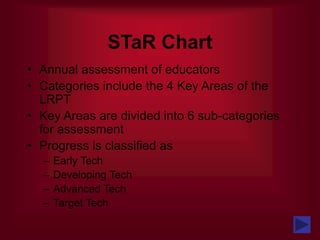
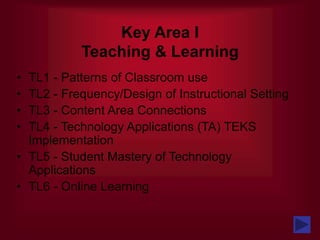
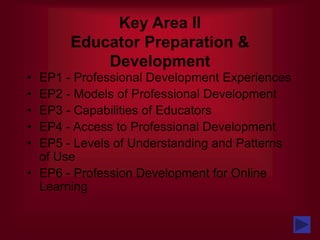
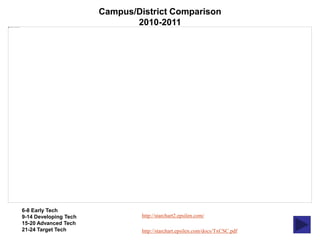
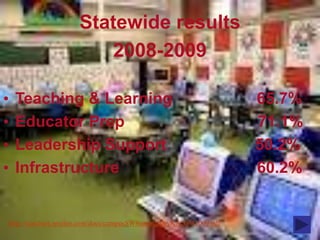
Texas STaR Chart
Campus Summary
2008-2011
• Texas Long Range Plan for Technology 2006-2020
– Teaching and Learning
– Educator Preparation and Development
– Leadership, Administration and Instructional Support
– Infrastructure for Technology
• Texas STaR Chart Key Areas
- 6 categories compose each Key Area
- Annual assessment of educators
• Campus/District Comparison
• STaR Classification
- Early Tech
- Developing Tech
- Advanced Tech
- Target Tech
STaR Chart
• Annual assessment of educators
• Categories include the 4 Key Areas of the
LRPT
• Key Areas are divided into 6 sub-categories
for assessment
• Progress is classified as
– Early Tech
– Developing Tech
– Advanced Tech
– Target Tech
Key Area I
Teaching & Learning
• TL1 - Patterns of Classroom use
• TL2 - Frequency/Design of Instructional Setting
• TL3 - Content Area Connections
• TL4 - Technology Applications (TA) TEKS
Implementation
• TL5 - Student Mastery of Technology
Applications
• TL6 - Online Learning
Key Area II
Educator Preparation &
Development
• EP1 - Professional Development Experiences
• EP2 - Models of Professional Development
• EP3 - Capabilities of Educators
• EP4 - Access to Professional Development
• EP5 - Levels of Understanding and Patterns
of Use
• EP6 - Profession Development for Online
Learning
Key Area III
Leadership, Administration and
Instructional Support
• L1 - Leadership and Vision
• L2 - Planning
• L3 - Instructional Support
• L4 - Communication and Collaboration
• L5 - Budget
• L6 - Leadership and Support for Online
Learning
Key Area IV
Infrastructure for Technology
• INF1 - Students per Computers
• INF2 - Internet Access Connectivity Speed
• INF3 - Other Classroom Technology
• INF4 - Technical Support
• INF5 - Local Area Network Wide Area
Network
• INF6 - Distance Learning Capacity
Campus/District Comparison
2010-2011
6-8 Early Tech
9-14 Developing Tech
15-20 Advanced Tech
21-24 Target Tech
http://starchart2.epsilen.com/
http://starchart.epsilen.com/docs/TxCSC.pdf
Statewide results
2008-2009
• Teaching & Learning 65.7%
• Educator Prep 71.1%
• Leadership Support 50.2%
• Infrastructure 60.2%
http://starchart.epsilen.com/docs/campusSWSummarybyKA20082009.pdf
STaR Chart data, in alignment with the
Long Range Plan for Technology: 2006-2020,
assures Texas educators, parents and
community members that today’s youth are
being taught to 21st century standards.
Bibliography
http://starchart2.epsilen.com/
http://starchart.epsilen.com/docs/TxCSC.pdf
http://starchart.epsilen.com/docs/campusSWSummarybyKA20082009.pdf

Texas STaR Chart

  • 1.
    Texas STaR Chart CampusSummary 2008-2011
  • 2.
    • Texas LongRange Plan for Technology 2006-2020 – Teaching and Learning – Educator Preparation and Development – Leadership, Administration and Instructional Support – Infrastructure for Technology • Texas STaR Chart Key Areas - 6 categories compose each Key Area - Annual assessment of educators • Campus/District Comparison • STaR Classification - Early Tech - Developing Tech - Advanced Tech - Target Tech
  • 4.
    STaR Chart • Annualassessment of educators • Categories include the 4 Key Areas of the LRPT • Key Areas are divided into 6 sub-categories for assessment • Progress is classified as – Early Tech – Developing Tech – Advanced Tech – Target Tech
  • 5.
    Key Area I Teaching& Learning • TL1 - Patterns of Classroom use • TL2 - Frequency/Design of Instructional Setting • TL3 - Content Area Connections • TL4 - Technology Applications (TA) TEKS Implementation • TL5 - Student Mastery of Technology Applications • TL6 - Online Learning
  • 6.
    Key Area II EducatorPreparation & Development • EP1 - Professional Development Experiences • EP2 - Models of Professional Development • EP3 - Capabilities of Educators • EP4 - Access to Professional Development • EP5 - Levels of Understanding and Patterns of Use • EP6 - Profession Development for Online Learning
  • 7.
    Key Area III Leadership,Administration and Instructional Support • L1 - Leadership and Vision • L2 - Planning • L3 - Instructional Support • L4 - Communication and Collaboration • L5 - Budget • L6 - Leadership and Support for Online Learning
  • 8.
    Key Area IV Infrastructurefor Technology • INF1 - Students per Computers • INF2 - Internet Access Connectivity Speed • INF3 - Other Classroom Technology • INF4 - Technical Support • INF5 - Local Area Network Wide Area Network • INF6 - Distance Learning Capacity
  • 9.
    Campus/District Comparison 2010-2011 6-8 EarlyTech 9-14 Developing Tech 15-20 Advanced Tech 21-24 Target Tech http://starchart2.epsilen.com/ http://starchart.epsilen.com/docs/TxCSC.pdf
  • 10.
    Statewide results 2008-2009 • Teaching& Learning 65.7% • Educator Prep 71.1% • Leadership Support 50.2% • Infrastructure 60.2% http://starchart.epsilen.com/docs/campusSWSummarybyKA20082009.pdf
  • 11.
    STaR Chart data,in alignment with the Long Range Plan for Technology: 2006-2020, assures Texas educators, parents and community members that today’s youth are being taught to 21st century standards.
  • 12.