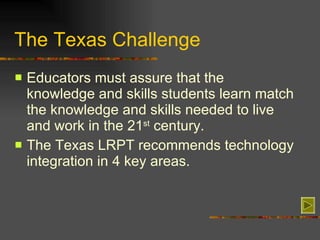
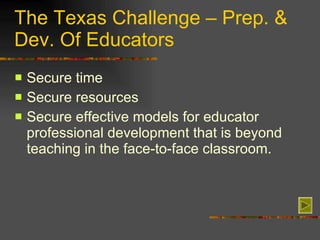
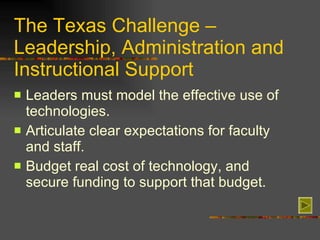
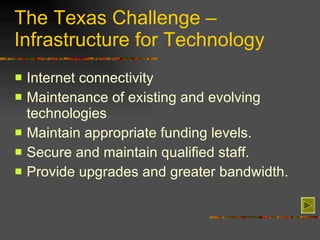
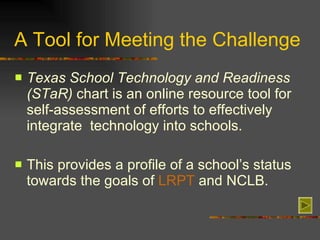
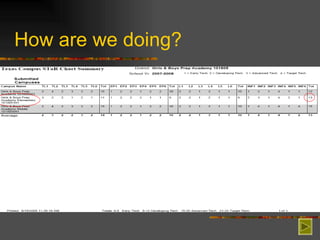
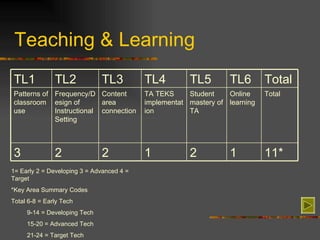
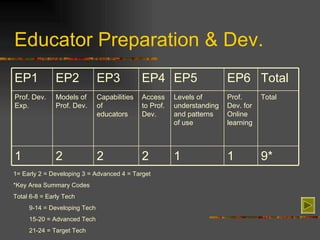
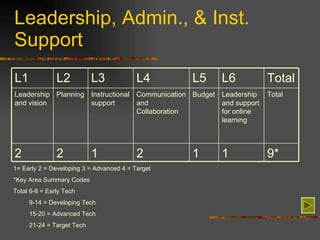
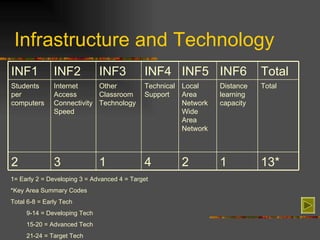
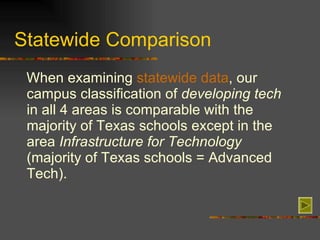
2007 –2008 Campus  STaR Chart Summary Girls & Boys Preparatory Academy Elementary Presented by Rosylyn West
The Texas Challenge Educators must assure that the knowledge and skills students learn match the knowledge and skills needed to live and work in the 21 st  century. The Texas LRPT recommends technology integration in 4 key areas.
The Texas Challenge – Teaching and Learning Move from traditional teacher-led learning model to a student-centered collaborative model in order to empower our young citizens to succeed in a global and digital world of information.
The Texas Challenge – Prep. & Dev. Of Educators Secure time  Secure resources  Secure effective models for educator professional development that is beyond teaching in the face-to-face classroom.
The Texas Challenge – Leadership, Administration and Instructional Support Leaders must model the effective use of technologies. Articulate clear expectations for faculty and staff. Budget real cost of technology, and secure funding to support that budget.
The Texas Challenge – Infrastructure for Technology Internet connectivity Maintenance of existing and evolving technologies Maintain appropriate funding levels. Secure and maintain qualified staff. Provide upgrades and greater bandwidth.
A Tool for Meeting the Challenge Texas School Technology and Readiness (STaR)  chart is an online resource tool for self-assessment of efforts to effectively integrate  technology into schools. This provides a profile of a school’s status towards the goals of  LRPT  and NCLB.
How are we doing?
Teaching & Learning 1= Early 2 = Developing 3 = Advanced 4 = Target *Key Area Summary Codes Total 6-8 = Early Tech 9-14 = Developing Tech 15-20 = Advanced Tech 21-24 = Target Tech 11* 1 2 1 2 2 3 Total Online learning Student mastery of TA TA TEKS implementation Content area connection Frequency/Design of Instructional Setting Patterns of classroom use Total TL6 TL5 TL4 TL3 TL2 TL1
Educator Preparation & Dev. 1= Early 2 = Developing 3 = Advanced 4 = Target *Key Area Summary Codes Total 6-8 = Early Tech 9-14 = Developing Tech 15-20 = Advanced Tech 21-24 = Target Tech 9* 1 1 2 2 2 1 Total Prof. Dev. for Online learning Levels of understanding and patterns of use Access to Prof. Dev. Capabilities of educators Models of Prof. Dev. Prof. Dev. Exp. Total EP6 EP5 EP4 EP3 EP2 EP1
Leadership, Admin., & Inst. Support 1= Early 2 = Developing 3 = Advanced 4 = Target *Key Area Summary Codes Total 6-8 = Early Tech 9-14 = Developing Tech 15-20 = Advanced Tech 21-24 = Target Tech 9* 1 1 2 1 2 2 Total Leadership and support for online learning Budget Communication and Collaboration Instructional support Planning Leadership and vision Total L6 L5 L4 L3 L2 L1
Infrastructure and Technology 1= Early 2 = Developing 3 = Advanced 4 = Target *Key Area Summary Codes Total 6-8 = Early Tech 9-14 = Developing Tech 15-20 = Advanced Tech 21-24 = Target Tech 13* 1 2 4 1 3 2 Total Distance learning capacity Local Area Network Wide Area Network Technical Support Other Classroom Technology Internet Access Connectivity Speed Students per computers Total INF6 INF5 INF4 INF3 INF2 INF1
Statewide Comparison When examining  statewide data , our  campus classification of  developing tech  in all 4 areas is comparable with the majority of Texas schools  except in the area  Infrastructure for Technology  (majority of Texas schools = Advanced Tech).
Conclusion If you would like more information on the STaR Chart or the 4 areas of recommended technology integration, visit  http://starchart.esc12.net/ .

S Ta R Chart Presentation R West2

  • 1.
    2007 –2008 Campus STaR Chart Summary Girls & Boys Preparatory Academy Elementary Presented by Rosylyn West
  • 2.
    The Texas ChallengeEducators must assure that the knowledge and skills students learn match the knowledge and skills needed to live and work in the 21 st century. The Texas LRPT recommends technology integration in 4 key areas.
  • 3.
    The Texas Challenge– Teaching and Learning Move from traditional teacher-led learning model to a student-centered collaborative model in order to empower our young citizens to succeed in a global and digital world of information.
  • 4.
    The Texas Challenge– Prep. & Dev. Of Educators Secure time Secure resources Secure effective models for educator professional development that is beyond teaching in the face-to-face classroom.
  • 5.
    The Texas Challenge– Leadership, Administration and Instructional Support Leaders must model the effective use of technologies. Articulate clear expectations for faculty and staff. Budget real cost of technology, and secure funding to support that budget.
  • 6.
    The Texas Challenge– Infrastructure for Technology Internet connectivity Maintenance of existing and evolving technologies Maintain appropriate funding levels. Secure and maintain qualified staff. Provide upgrades and greater bandwidth.
  • 7.
    A Tool forMeeting the Challenge Texas School Technology and Readiness (STaR) chart is an online resource tool for self-assessment of efforts to effectively integrate technology into schools. This provides a profile of a school’s status towards the goals of LRPT and NCLB.
  • 8.
    How are wedoing?
  • 9.
    Teaching & Learning1= Early 2 = Developing 3 = Advanced 4 = Target *Key Area Summary Codes Total 6-8 = Early Tech 9-14 = Developing Tech 15-20 = Advanced Tech 21-24 = Target Tech 11* 1 2 1 2 2 3 Total Online learning Student mastery of TA TA TEKS implementation Content area connection Frequency/Design of Instructional Setting Patterns of classroom use Total TL6 TL5 TL4 TL3 TL2 TL1
  • 10.
    Educator Preparation &Dev. 1= Early 2 = Developing 3 = Advanced 4 = Target *Key Area Summary Codes Total 6-8 = Early Tech 9-14 = Developing Tech 15-20 = Advanced Tech 21-24 = Target Tech 9* 1 1 2 2 2 1 Total Prof. Dev. for Online learning Levels of understanding and patterns of use Access to Prof. Dev. Capabilities of educators Models of Prof. Dev. Prof. Dev. Exp. Total EP6 EP5 EP4 EP3 EP2 EP1
  • 11.
    Leadership, Admin., &Inst. Support 1= Early 2 = Developing 3 = Advanced 4 = Target *Key Area Summary Codes Total 6-8 = Early Tech 9-14 = Developing Tech 15-20 = Advanced Tech 21-24 = Target Tech 9* 1 1 2 1 2 2 Total Leadership and support for online learning Budget Communication and Collaboration Instructional support Planning Leadership and vision Total L6 L5 L4 L3 L2 L1
  • 12.
    Infrastructure and Technology1= Early 2 = Developing 3 = Advanced 4 = Target *Key Area Summary Codes Total 6-8 = Early Tech 9-14 = Developing Tech 15-20 = Advanced Tech 21-24 = Target Tech 13* 1 2 4 1 3 2 Total Distance learning capacity Local Area Network Wide Area Network Technical Support Other Classroom Technology Internet Access Connectivity Speed Students per computers Total INF6 INF5 INF4 INF3 INF2 INF1
  • 13.
    Statewide Comparison Whenexamining statewide data , our campus classification of developing tech in all 4 areas is comparable with the majority of Texas schools except in the area Infrastructure for Technology (majority of Texas schools = Advanced Tech).
  • 14.
    Conclusion If youwould like more information on the STaR Chart or the 4 areas of recommended technology integration, visit http://starchart.esc12.net/ .