Downloaded 21 times
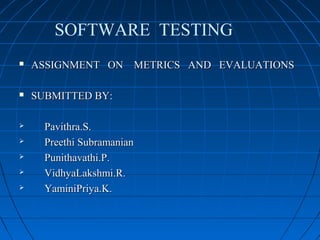


![ Effort Variance:Effort Variance:
Plotting baselined ,revised and actual efforts ,phase-wisePlotting baselined ,revised and actual efforts ,phase-wise
Substantial difference between Baselined and revise effort point toSubstantial difference between Baselined and revise effort point to
incorrect initial estimation.incorrect initial estimation.
Variance%=[(Actual effort – Revised estimate)/Revised estimate]*100Variance%=[(Actual effort – Revised estimate)/Revised estimate]*100
Schedule Variance:Schedule Variance:
Deviation of actual schedule from Estimated scheduleDeviation of actual schedule from Estimated schedule
Calculated at the end of every milestoneCalculated at the end of every milestone
Several phases could be active at the same time based on theSeveral phases could be active at the same time based on the
SDLC usedSDLC used](https://image.slidesharecdn.com/presentation1-130430044722-phpapp02/85/Presentation1-9-320.jpg)


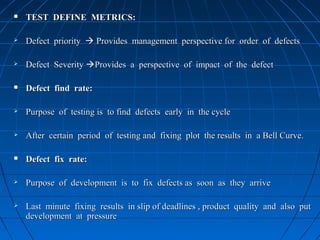

![ Defects classification trends:Defects classification trends:
How many are Extreme defectsHow many are Extreme defects
How many are CriticalHow many are Critical
How many are importantHow many are important
Weighted defects trend:Weighted defects trend:
Helps in quick analysis of defectsHelps in quick analysis of defects
Weighted defect =[Extreme*5+Critical*4+Important*3+Minor*2+Cosmetic]Weighted defect =[Extreme*5+Critical*4+Important*3+Minor*2+Cosmetic]
Defect cause distribution:Defect cause distribution:
Why defects occur and what are root causes of the defectWhy defects occur and what are root causes of the defect
What areas must be focused for getting more defects in testing.What areas must be focused for getting more defects in testing.](https://image.slidesharecdn.com/presentation1-130430044722-phpapp02/85/Presentation1-14-320.jpg)
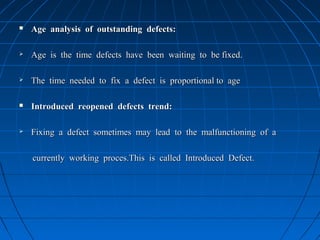
![Development defects metricsDevelopment defects metrics
Component wise defect distribution:Component wise defect distribution:
Important to map defects into different componentsImportant to map defects into different components
Knowing the component that produce more defects help in fixing them.Knowing the component that produce more defects help in fixing them.
Defect density and defect removal rate:Defect density and defect removal rate:
Defect density correlates source code and defectsDefect density correlates source code and defects
Defects per KLOC=[Total defects in the product]/[total executable lineDefects per KLOC=[Total defects in the product]/[total executable line
of codes in KLOC]of codes in KLOC]
Defect removal rate= (Defects found by verification activitiesDefect removal rate= (Defects found by verification activities
++
Defects found in unit testing) /(Defects found in test team)Defects found in unit testing) /(Defects found in test team)
**
100100](https://image.slidesharecdn.com/presentation1-130430044722-phpapp02/85/Presentation1-15-320.jpg)


The document discusses the importance of metrics and evaluations in software testing, focusing on how they derive insights from raw data to aid decision-making. It outlines steps for metrics analysis, types of metrics, and various calculations involved in tracking project performance, product quality, and defect management. Overall, it emphasizes the role of metrics in ensuring effective testing and timely product releases while highlighting essential metrics for measuring productivity and defects.