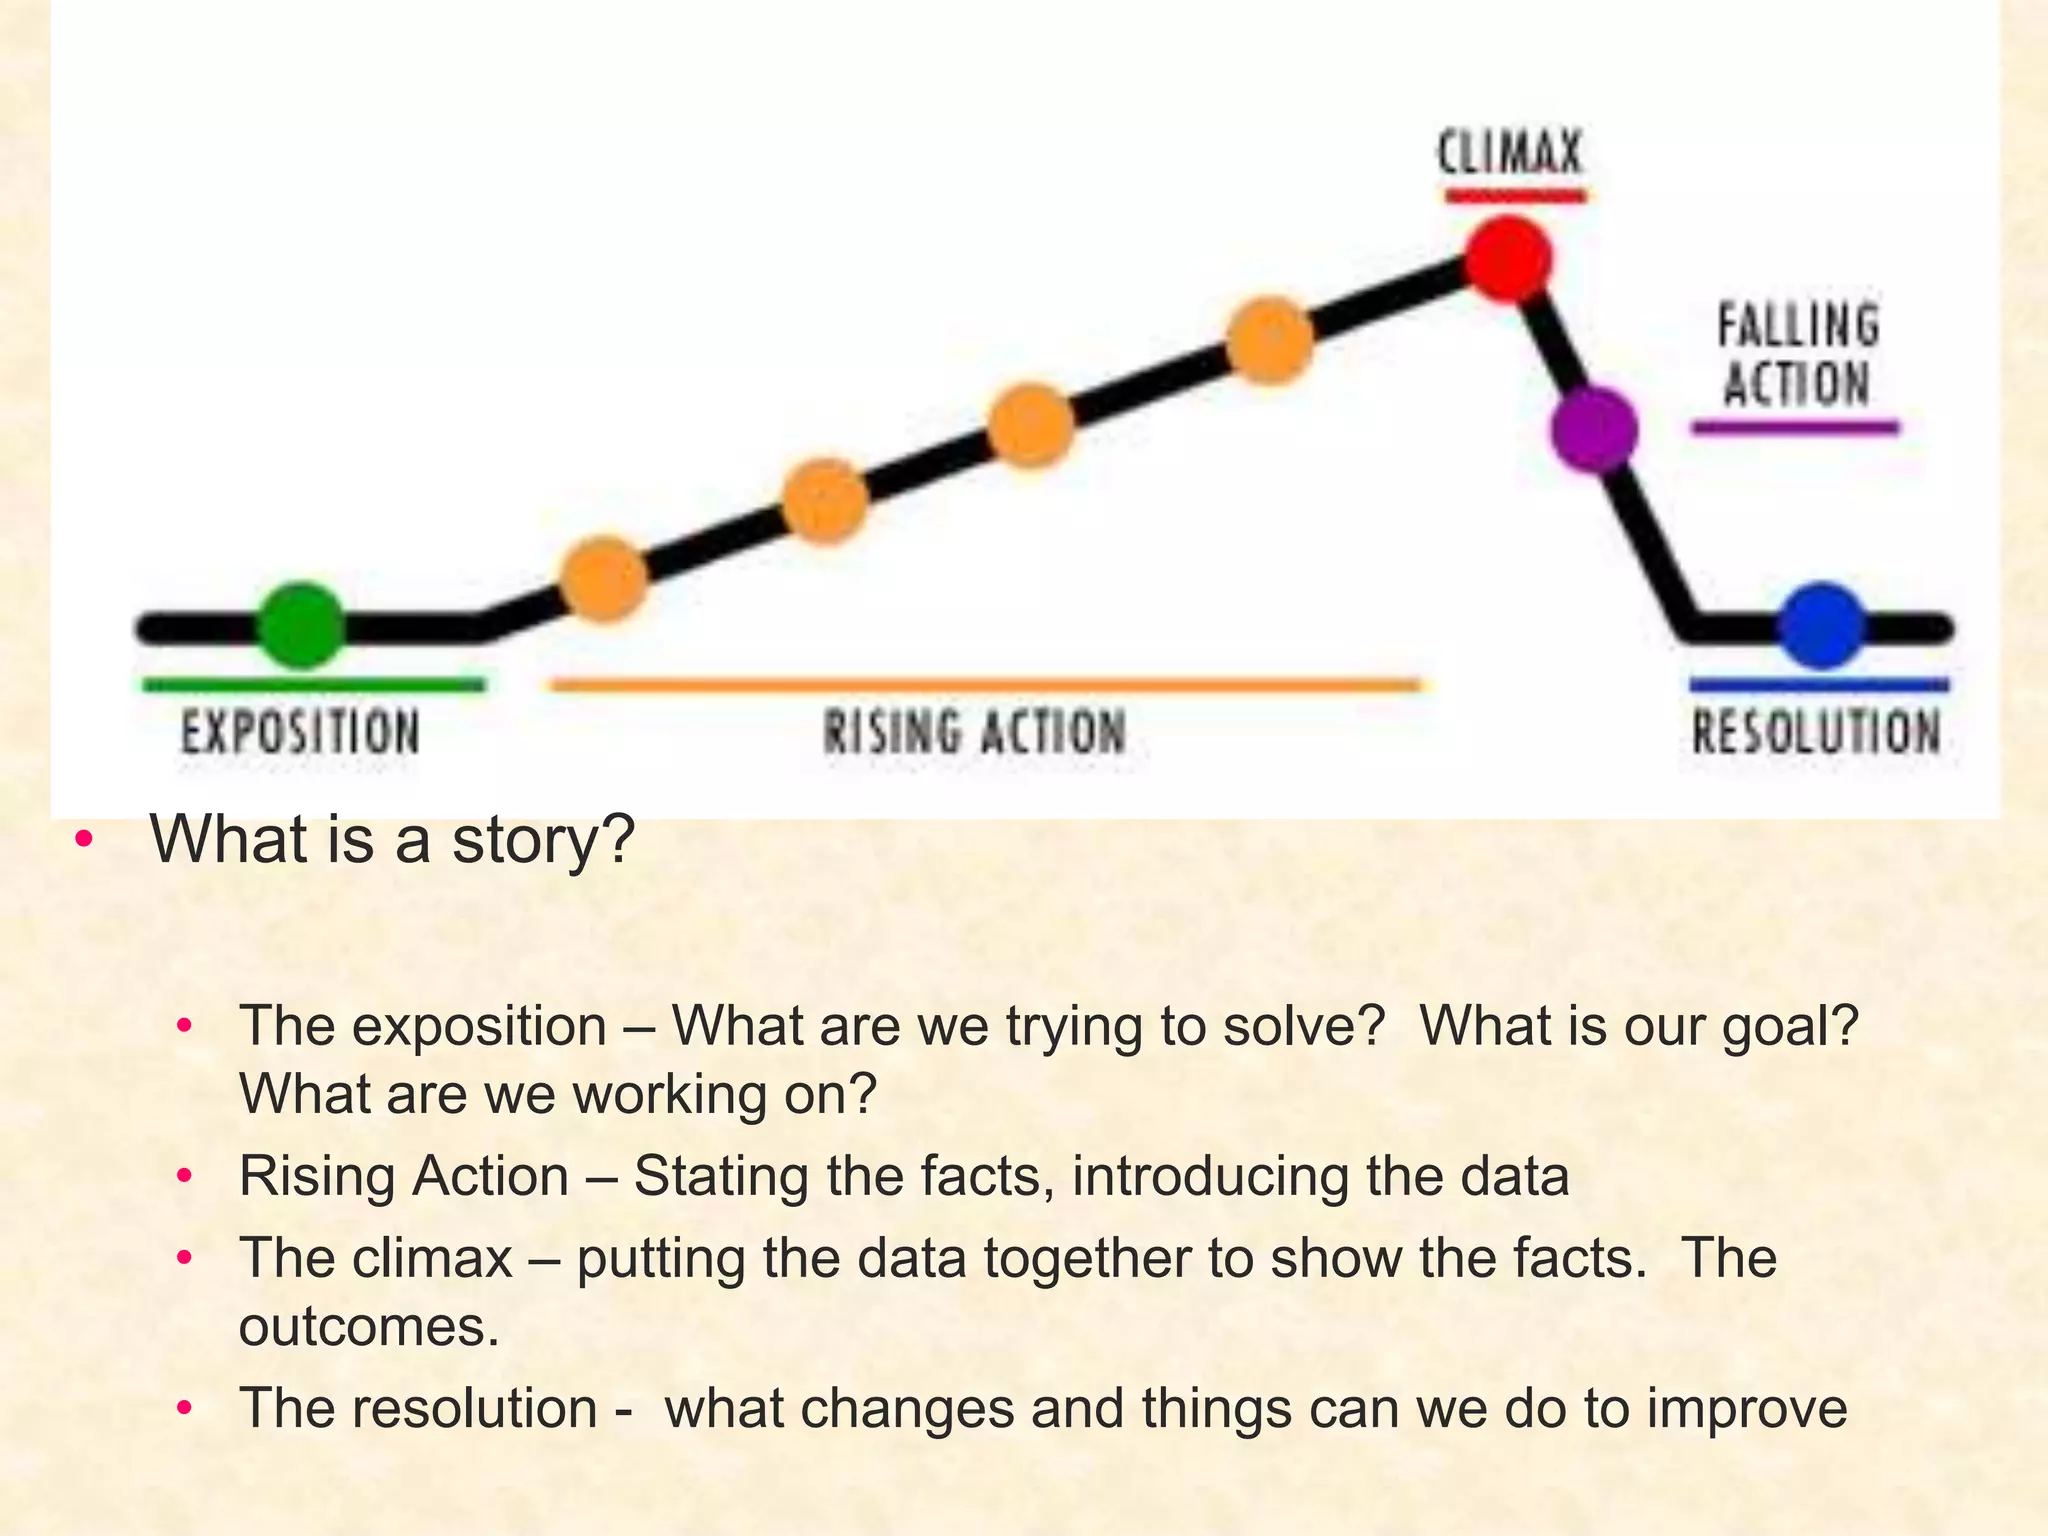
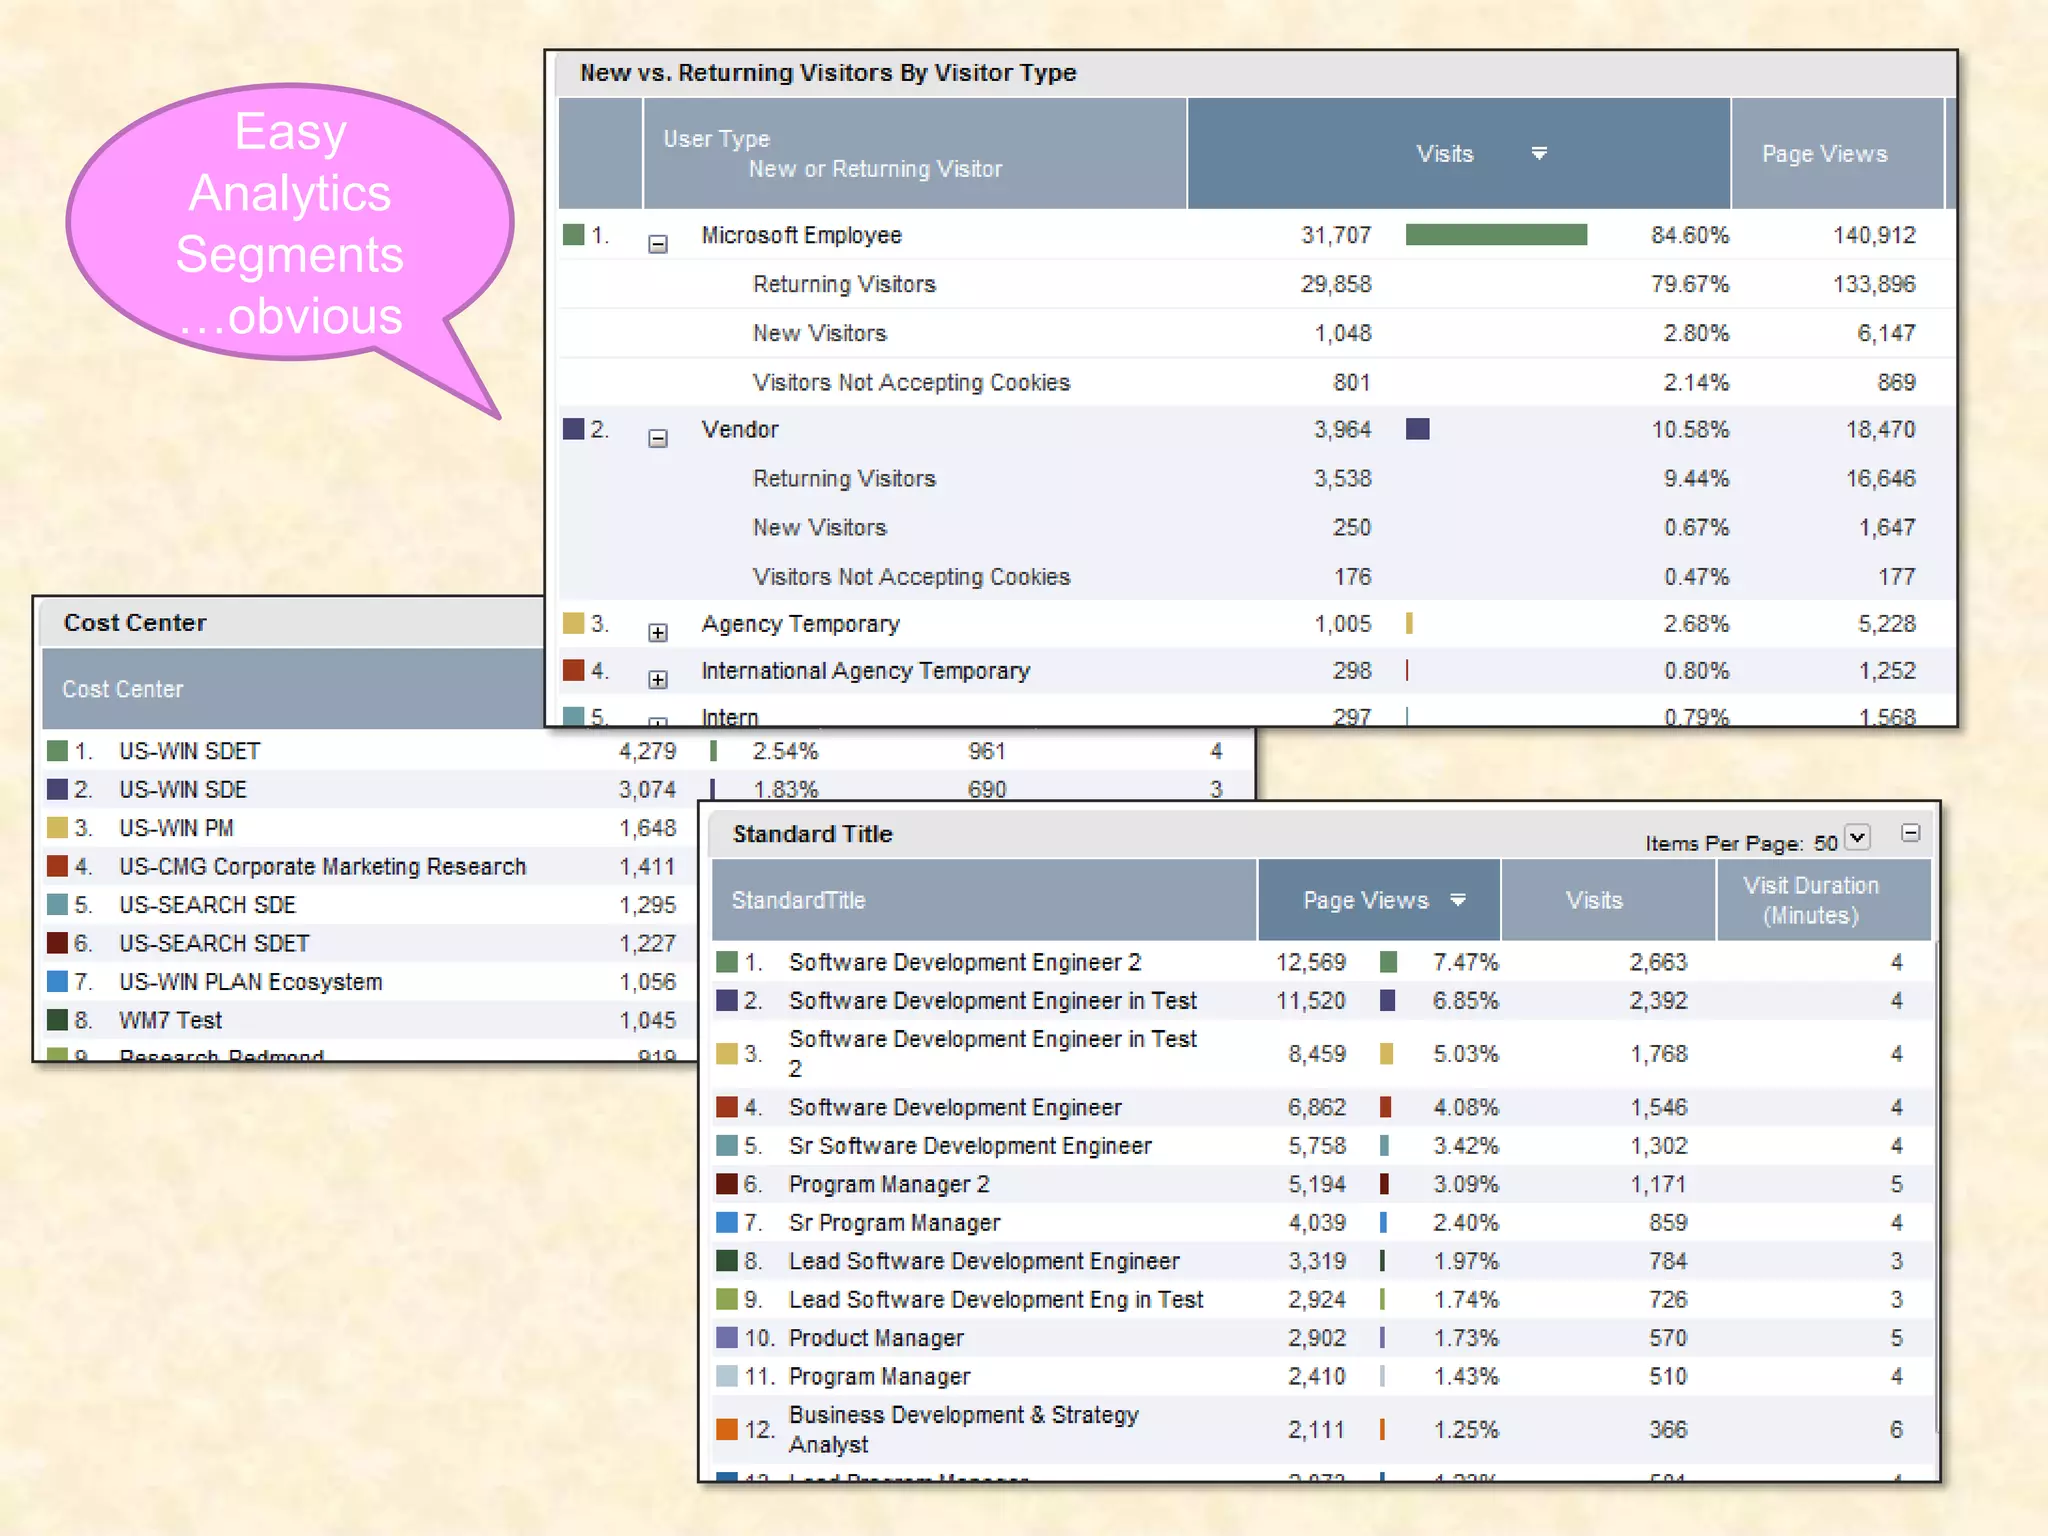
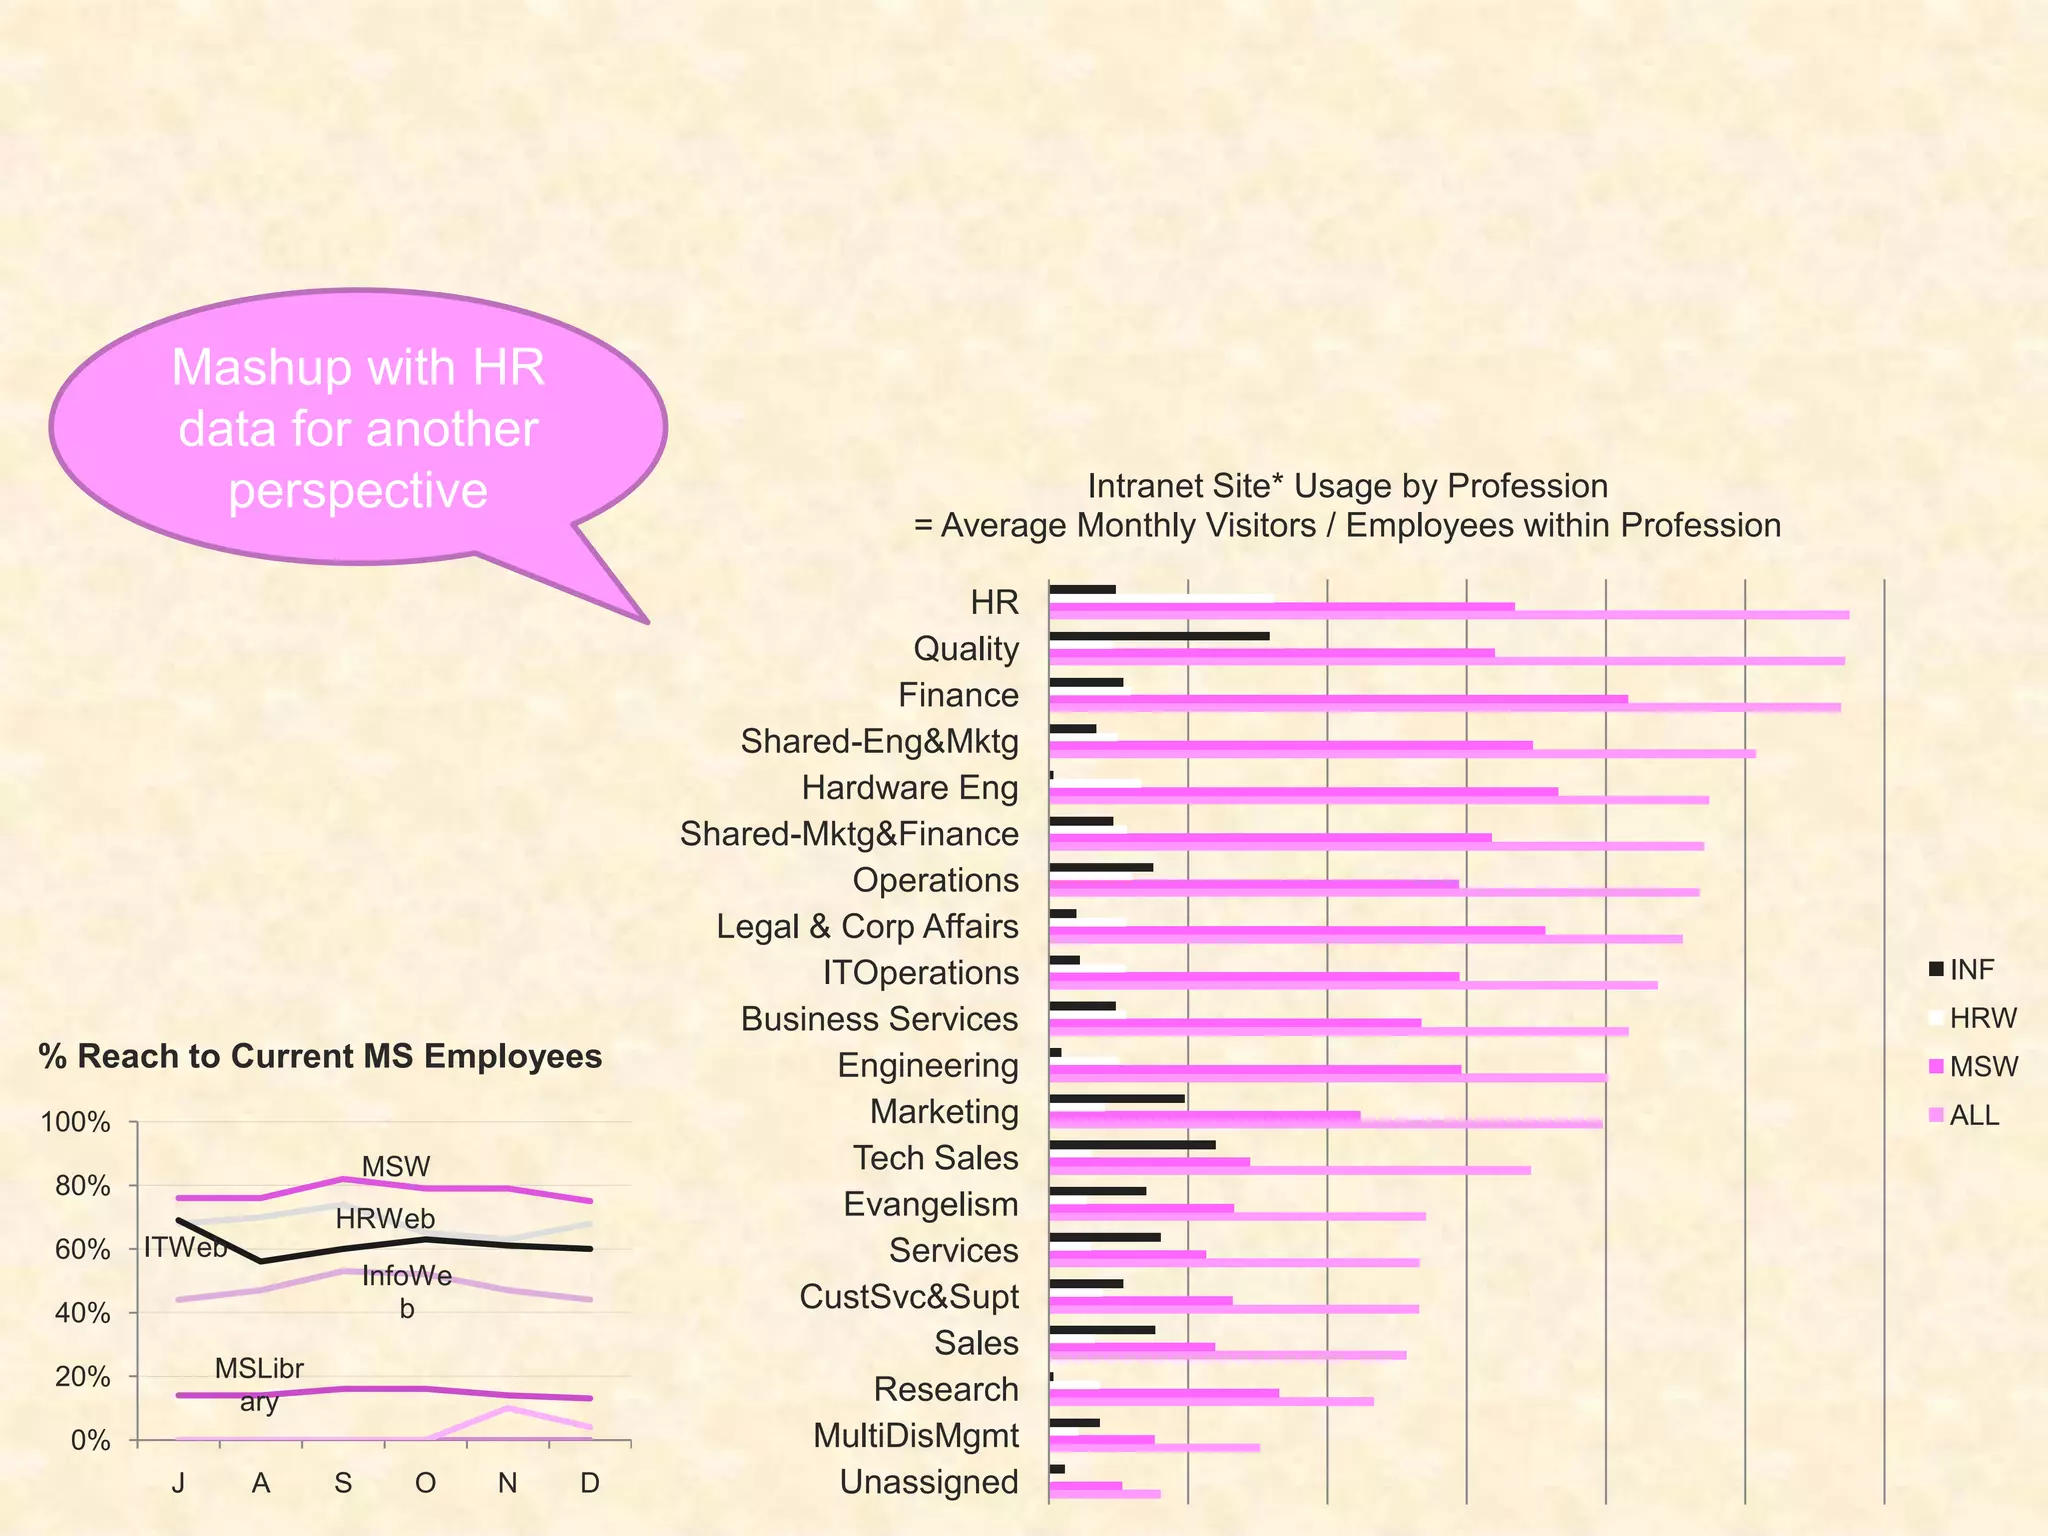
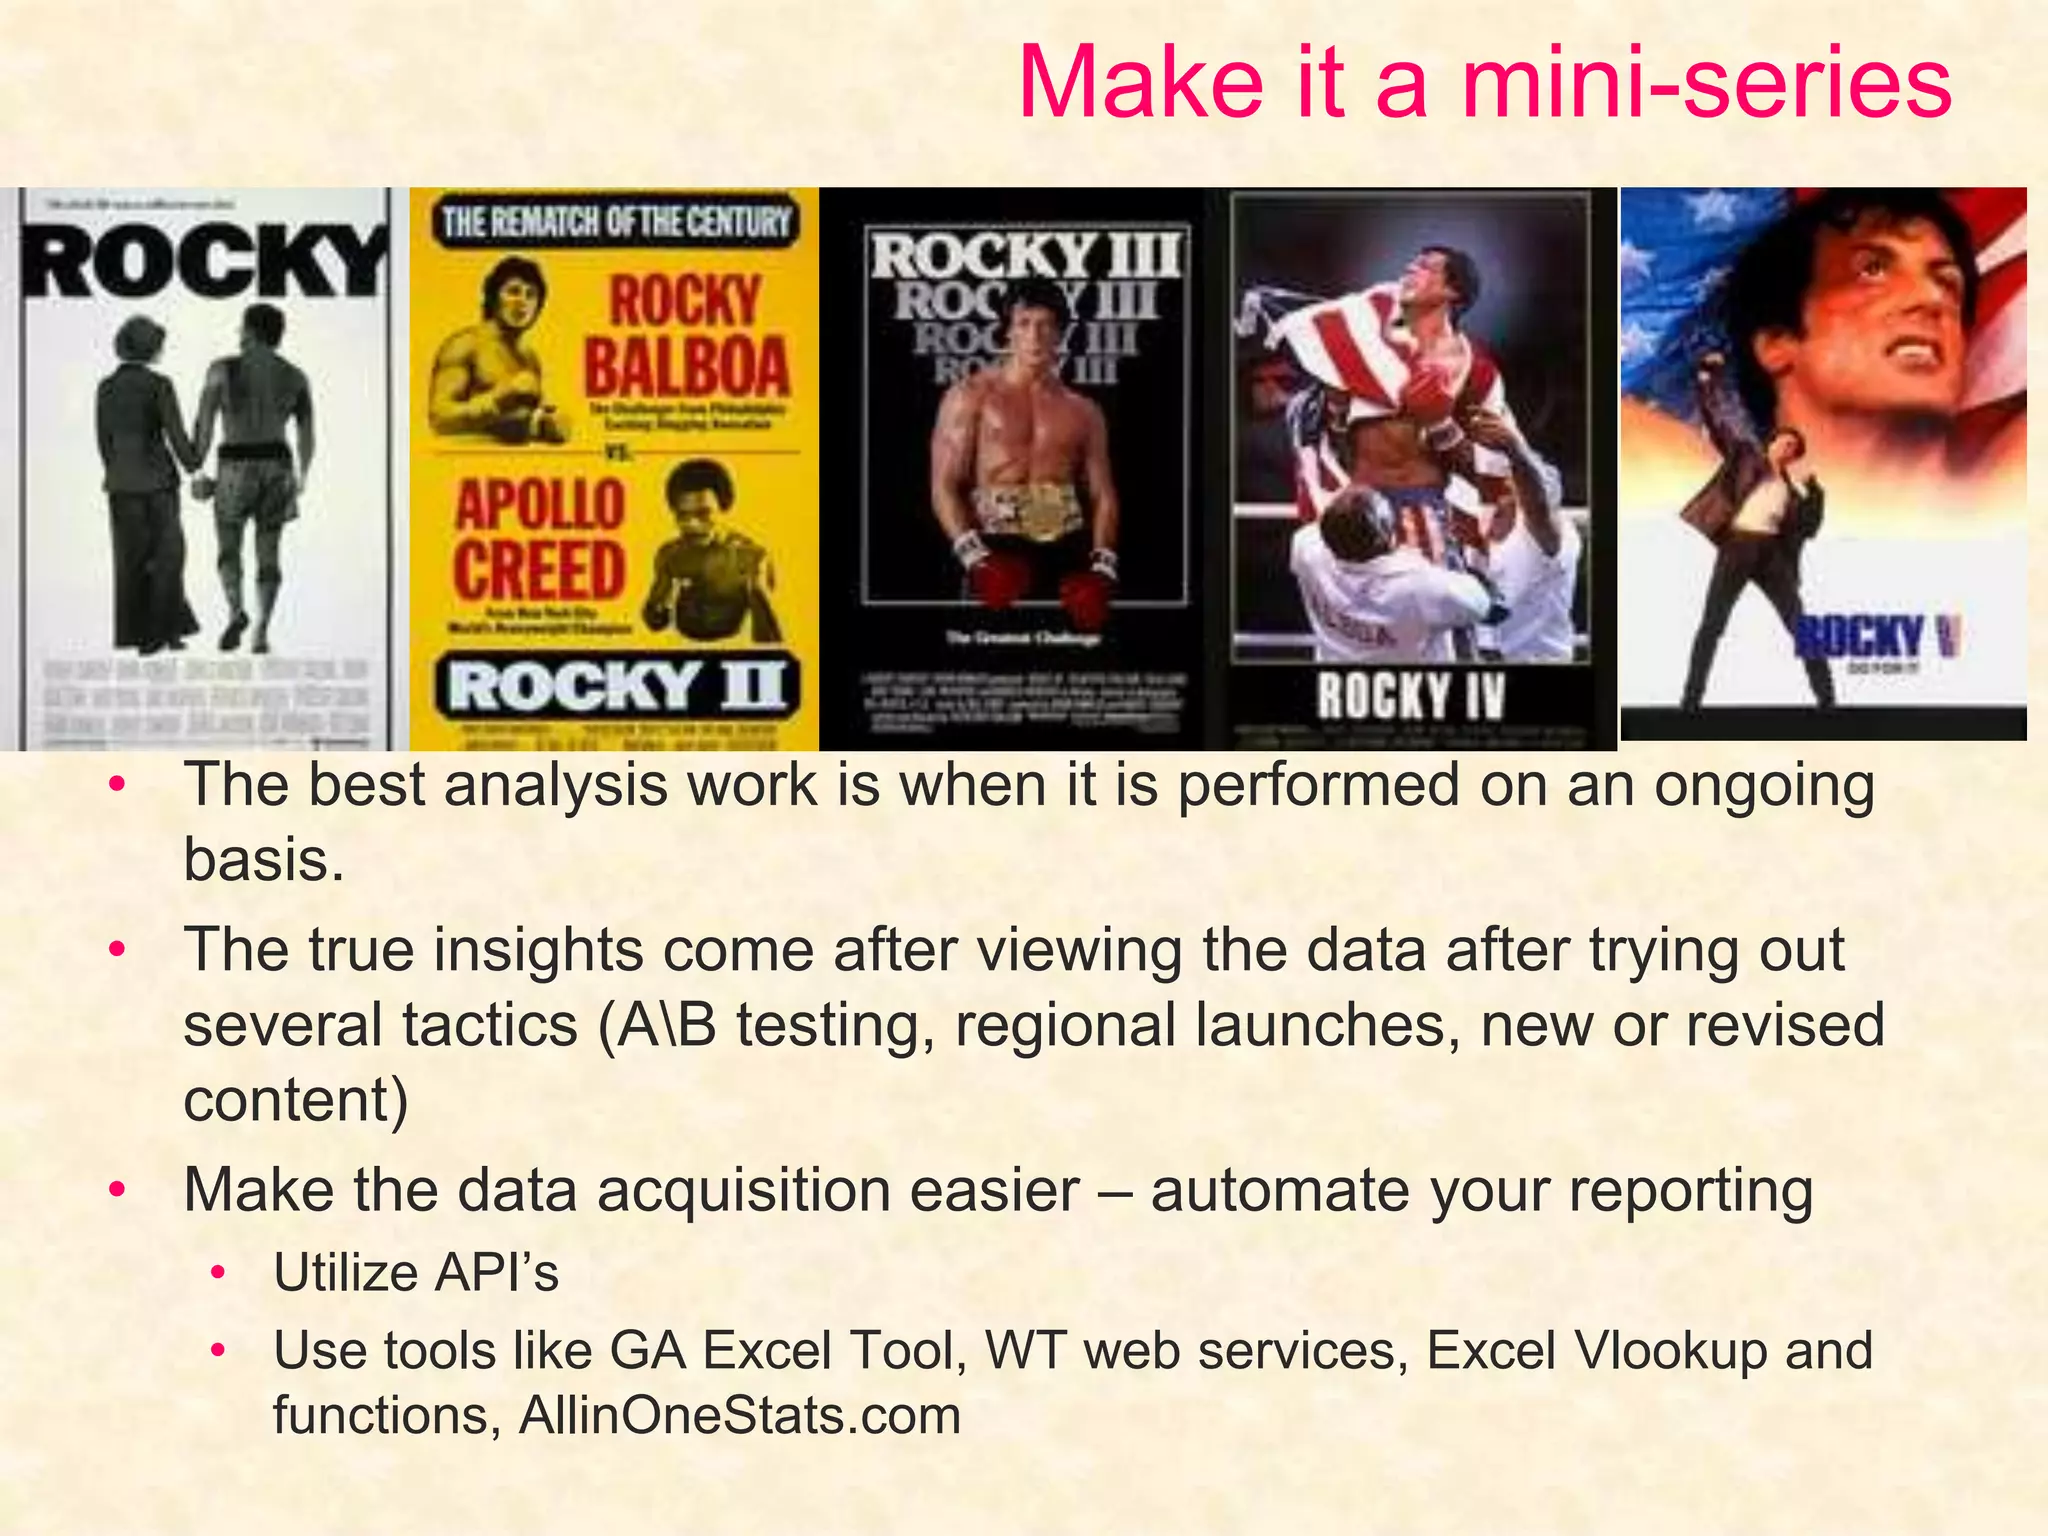
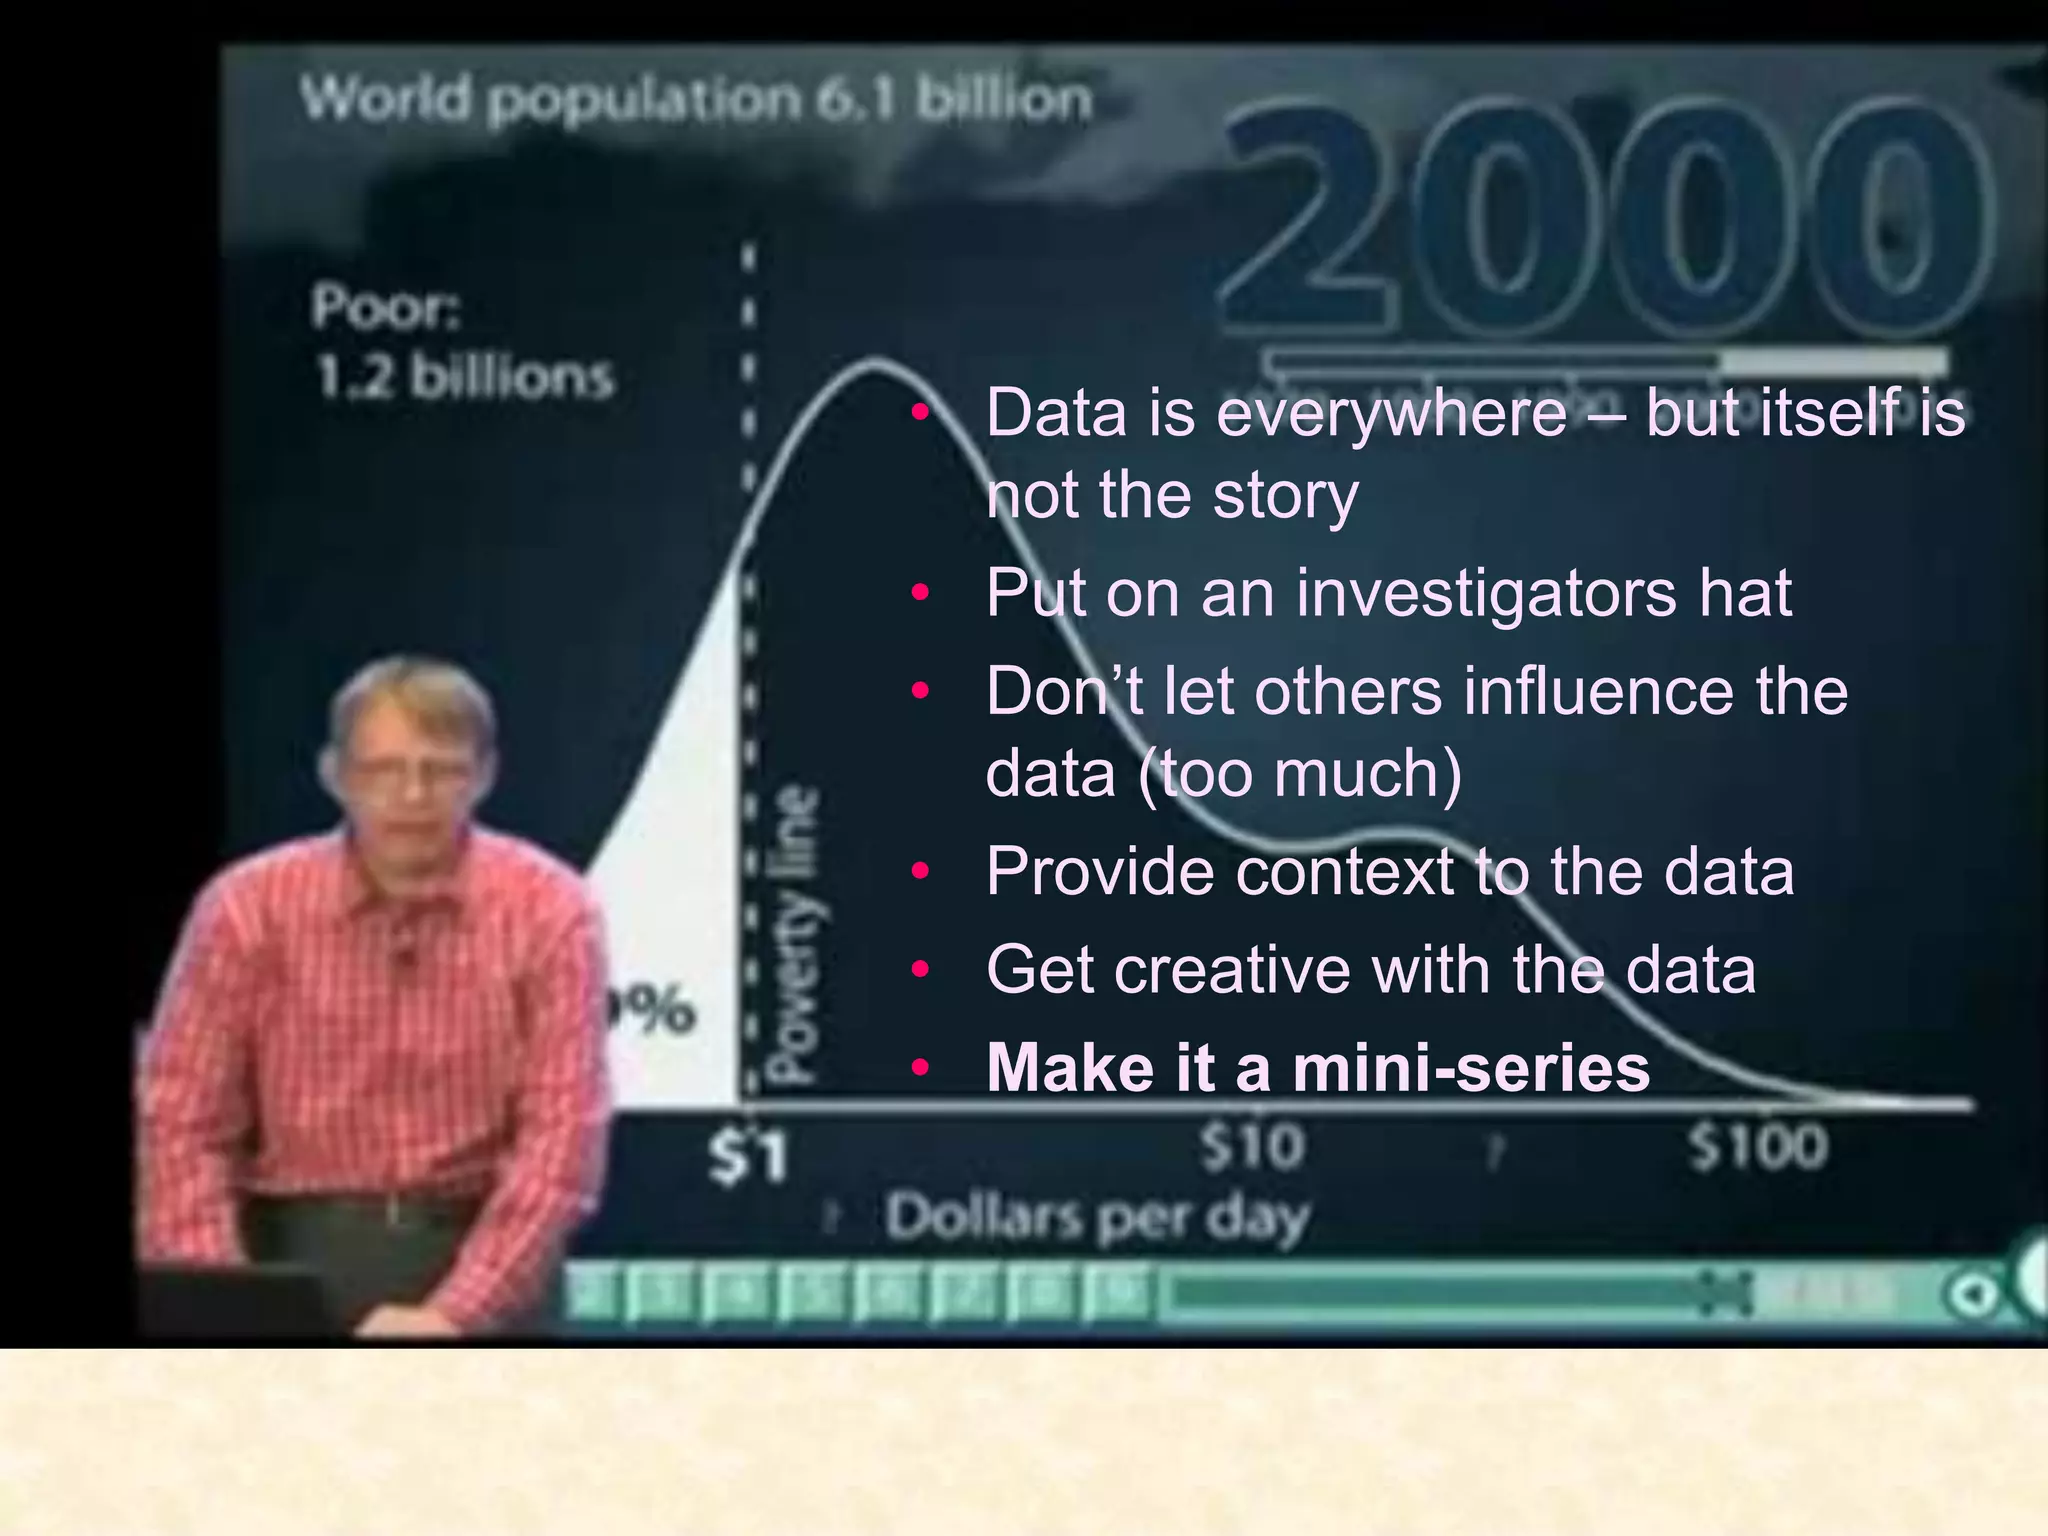
Telling a story with data- BosilyticsAre you going to show me a bunch of numbers…Telling a story with data- BosilyticsWe live in a world of dataIn this generation we have become immersed with anything that is measurable ….Hey, its my Last.fm stream History
We live in a world of data
We live in a world of dataWe have become quantifiers.  How much weight have I gained/lost?How many minutes do I have left on my phoneHow many channels does my cable haveWhat is my carbon footprint
We must stop presenting data … and become storytellers
Say no to reports, tell stories instead.The exposition – What are we trying to solve?  What is our goal?  What are we working on?Rising Action – Stating the facts, introducing the dataThe climax – putting the data together to show the facts.  The outcomes.The resolution -  what changes and things can we do to improve
What are people working on within the organization (different from Goals\Objectives)?What changes are being made to the website (now, soon, planned later)?How is traffic coming in?  Who, How, Where, WHAT?What are those URL’s below the Top 10?The conversion late is low …Was a new location introduced?Are you getting significantly higher traffic? New content? New message?Change of price, product location?Pretend you are an investigative reporter, or sherlockholmes
Always provide context … it makes the story relevantPeople may just ask for numbers, but, give them something to talk aboutShow similar PagesAdd previous days/weeks monthsUse Ratios not Totals: % of Change, % of Total
WHAT THE REPORT TELLS YOU:: Keyword traffic went up … TRUE ANALYSIS AND STORY TELLING::But compared to everyone else, we should of got more…With Volume and competition in Google AdWordsCombine keyword data in Google AnalyticsWith Google Trends data
Segment the traffic.Employee vs Associates..But don’t stop here!!  This is staticCost Center/Employee RoleCost Center/Employee Role
Mashup your “report” data with internal, external, competitive and other data in order to make it relevant to all users.% Reach to Current Employees
You may be asked to write a boring story ….
Challenge the Hippo’s statements:“More people is great”“This is a long term campaign – conversions are unimportant”“I don’t trust these numbers (when they are not in their favor)”“OK, so you got me…our goals are changing next Quarter thoughDon’t think like the marketing guy
Create the water-cooler momentDid you hear Mary’s campaign had the highest Average Revenue per Sale EVER?Did you know those sites with 5 visits a month add up to 5% of our traffic --- from mom and pop blogs?Oklahoma has the highest traffic (not including Virginia)… as measured by % of visits/Total population.  4% of the state has been to our site!
Make it a mini-seriesThe best analysis work is when it is performed on an ongoing basis.The true insights come after viewing the data after trying out several tactics (A\B testing, regional launches, new or revised content)Make the data acquisition easier – automate your reportingUtilize API’sUse tools like GA Excel Tool, WT web services, Excel Vlookup and functions, AllinOneStats.com
In summaryData is everywhere – but itself is not the storyPut on an investigators hatProvide context to the dataDon’t let others influence the data (too much)Get creative with the dataMake it a mini-series
Telling A Story With Data

Telling A Story With Data

  • 1.
    Telling a storywith data- BosilyticsAre you going to show me a bunch of numbers…Telling a story with data- BosilyticsWe live in a world of dataIn this generation we have become immersed with anything that is measurable ….Hey, its my Last.fm stream History
  • 2.
    We live ina world of data
  • 3.
    We live ina world of dataWe have become quantifiers. How much weight have I gained/lost?How many minutes do I have left on my phoneHow many channels does my cable haveWhat is my carbon footprint
  • 5.
    We must stoppresenting data … and become storytellers
  • 6.
    Say no toreports, tell stories instead.The exposition – What are we trying to solve? What is our goal? What are we working on?Rising Action – Stating the facts, introducing the dataThe climax – putting the data together to show the facts. The outcomes.The resolution - what changes and things can we do to improve
  • 7.
    What are peopleworking on within the organization (different from Goals\Objectives)?What changes are being made to the website (now, soon, planned later)?How is traffic coming in? Who, How, Where, WHAT?What are those URL’s below the Top 10?The conversion late is low …Was a new location introduced?Are you getting significantly higher traffic? New content? New message?Change of price, product location?Pretend you are an investigative reporter, or sherlockholmes
  • 8.
    Always provide context… it makes the story relevantPeople may just ask for numbers, but, give them something to talk aboutShow similar PagesAdd previous days/weeks monthsUse Ratios not Totals: % of Change, % of Total
  • 9.
    WHAT THE REPORTTELLS YOU:: Keyword traffic went up … TRUE ANALYSIS AND STORY TELLING::But compared to everyone else, we should of got more…With Volume and competition in Google AdWordsCombine keyword data in Google AnalyticsWith Google Trends data
  • 10.
    Segment the traffic.Employeevs Associates..But don’t stop here!! This is staticCost Center/Employee RoleCost Center/Employee Role
  • 11.
    Mashup your “report”data with internal, external, competitive and other data in order to make it relevant to all users.% Reach to Current Employees
  • 12.
    You may beasked to write a boring story ….
  • 13.
    Challenge the Hippo’sstatements:“More people is great”“This is a long term campaign – conversions are unimportant”“I don’t trust these numbers (when they are not in their favor)”“OK, so you got me…our goals are changing next Quarter thoughDon’t think like the marketing guy
  • 14.
    Create the water-coolermomentDid you hear Mary’s campaign had the highest Average Revenue per Sale EVER?Did you know those sites with 5 visits a month add up to 5% of our traffic --- from mom and pop blogs?Oklahoma has the highest traffic (not including Virginia)… as measured by % of visits/Total population. 4% of the state has been to our site!
  • 15.
    Make it amini-seriesThe best analysis work is when it is performed on an ongoing basis.The true insights come after viewing the data after trying out several tactics (A\B testing, regional launches, new or revised content)Make the data acquisition easier – automate your reportingUtilize API’sUse tools like GA Excel Tool, WT web services, Excel Vlookup and functions, AllinOneStats.com
  • 16.
    In summaryData iseverywhere – but itself is not the storyPut on an investigators hatProvide context to the dataDon’t let others influence the data (too much)Get creative with the dataMake it a mini-series

Editor's Notes

  • #4 In this generation we have become immersed with anything that is measurable ….We have become addicted to numbers and charts and graphs … We have started to create graphs about anything we encounter whether it be box office charts…
  • #5 In this generation we have become immersed with anything that is measurable ….We have become addicted to numbers and charts and graphs … We have started to create graphs about anything we encounter whether it be box office charts…NASDAQ index’s … fantasy football drafts at Starbucks on Sunday. Not for a job, but for a thrill.
  • #6 We have become quantifiers. The questions we ask ourselves are not if we are beautiful or successful … but how beautiful, how successful?In any major newspaper you can see infographics of anything from …How much weight have I gained/lost?How many minutes do I have left on my phoneHow many channels does my cable haveWhat is my carbon footprintHowever, if you still need a bit more proof that we are just a small bit stuck on ourselves look no further than …
  • #7 The social web. Full of popularity contests, friendship rings, FOLLOW ME stickers and more … The data stream is endless, but yet the applications still spit out, noncontexual, non actionable, nonexciting numbers.However with all the “quantification” and addiction to numbers…We have forgot about the real premise of what we use these for…
  • #8 In stead of taking these valuable metrics and reporting true recommendations, often time we take them for face value. We treat them like 5 second sound bites and use them to our best advantage. The story is lost. The meaning is incorrect.This can’t be avoided. It is the nature of statistics. Numbers can be fooled. That is why the best display…is a story.
  • #9 Any report that you have should include the key elements of a story. Often times, we focus on a single part. The body, the data. However without the exposition and the resolution, we are usually keep our audience stuck hanging.Start with what you are trying to solve. - Are visitors low? Has revenue hit the tank? Are you just not getting enough yield from those keywords anymore. Shoot, maybe everything is rosy, in which case what are people working on that you can test or define?The boring part is the data. It is a necessity. However, this is not the story look at it more as the substantiating facts or the research and use the data points as such. What people really want to know is how can this data relate to my business? What does it mean to ME. I have been bleeding these numbers for months but tell my what the heck I can do.And then finally …. Combine all that knowledge you have gaining cross-training in SEO, SEM, Display ads, design, copy writing …. And make some recommendations. (This might also be a good time to bring up testing!)
  • #10 So what SHOULD? you be focusing on?The best stories come out of deep investigative reporting. It is how Watergate was finally uncovered! Ask the general questions Who, How, What Where over and over again. This is how insights and areas of improvement are found. It takes moving a mountain to all of a sudden increase sales by 10% … but by recommending a change here and a change there … and avoiding that “redesign” and “gut feeling” you can get closer each time.Don’t be daunted by the data surrounding you. Utilize it to tell a better story.
  • #11 Use this data to provide context. Always, Always, Always provide context. Context is everywhere … use similar pages, previous time periods, ratios, percentages….
  • #12 Don’t just take a rise in traffic for granted. Look at how the industry is performing. Is this a key trend? Did we get lucky? Will this die tomorrow? Upon face value an increase of traffic from certain keywords could look great. But, look at the industry. Did that keyword jump in popularity. Did a chance new story give you an uptick?
  • #13 Segment your data as much as possible. Don’t take a visitor as face value, break them down into small chunks to show how each scenario is being represented. Then …
  • #14 Combine this with a completely different data source to provide more relevance. In this case, take those Visitors and display it as a percentage of reach. This may be the reach of a city, demographic, campaign, etc.
  • #15 In your career I mind you …. You will be asked to write a boring story, or at least a guided one. But urge the temptation and…
  • #16 Don’t think like the marketing guy. That is a general statement. The marketing guy might have been the person that hired you. But sometimes there is that person in the organization whom will consistently try to muck your story up…“Hey look at those Visitors flying up …. Man those campaigns are working” ---- when in reality the revenue from this new lift has tanked (refrence WT scorecard!)“I am not overly concerned with the poor conversions. This was a branding campaign and I am much more concerned with the long-term effects, and look …. Traffic is going up!” Don’t get upset with this statement, just start planning for this dude’s job. Accountability is key in these times and you are that key. Once you get this obstacle start to place context such as Cost per Visitor, the CPC cost in comparison to the CPM cost on top of the average display CPM.“I don’t trust these numbers”. Listen Jack, I can run the numbers all day and probably come up with something a bit different … but this figure and that figure ALWAYS go down. So, we can ignore the problem or create new ones? Seriously, data accuracy is an issue. You will lose credibility slowly if you fight this issue too much, however if you continue to focus on the STORY not the data itself, you might just avoid this issue.OK, my goals are changing …. Welcome to corporate america. At least this time you are around when the goals are created!
  • #17 End with something unexpected … or at least something that people can take away. You don’t have to show your work to get talked about. Sometimes it only takes a sentence (or a stupid 10sec comment on a national awards show).