Download as PDF, PPTX


![Define Project
4
Actual is less than or equal to 10% above Latest planned
Actual is between 10-30% above Latest planned
Actual is more than 30% above Latest planned
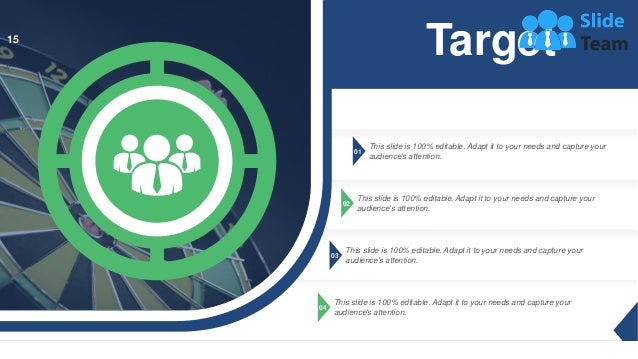
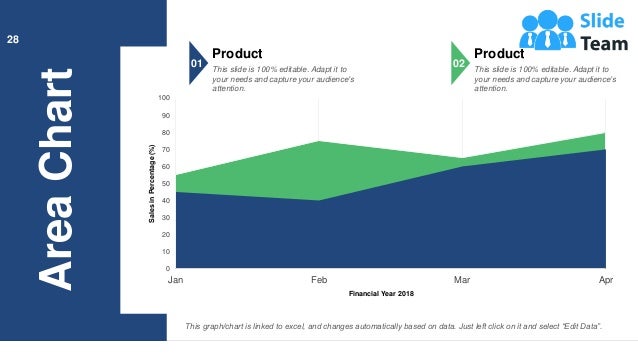
▪ This slide is 100% editable. Adapt it to your needs and capture your
audience's attention.
What
Who
Accomplishments
Assessment
Project Description:
▪ [1-2 sentence Description of Effort]
Actual Completion Date:
▪ [Date]
Stakeholders and team Members:
▪ PM Lead
▪ Sponsor
▪ Team Lead
▪ [Key deliverables / Results]
▪ Your Text Here
▪ Your Text Here
▪ Schedule------------
▪ Scope----------------
▪ Resources-----------
Overall Results------](https://image.slidesharecdn.com/statisticalanalysispowerpointpresentationslides-220329042856/95/Statistical-Analysis-Powerpoint-Presentation-Slides-4-638.jpg)
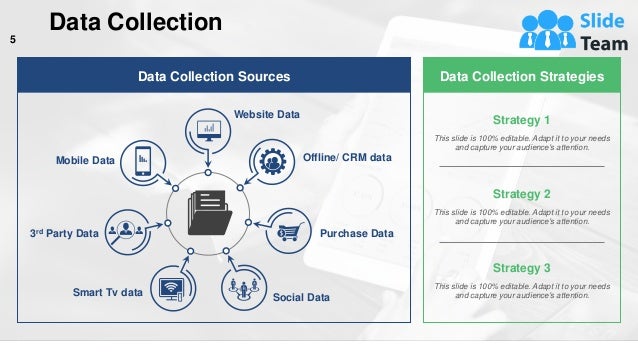
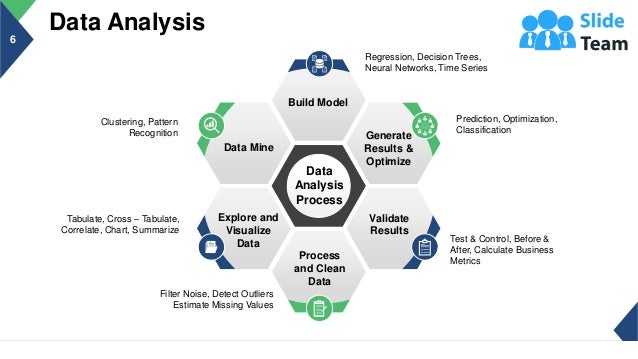
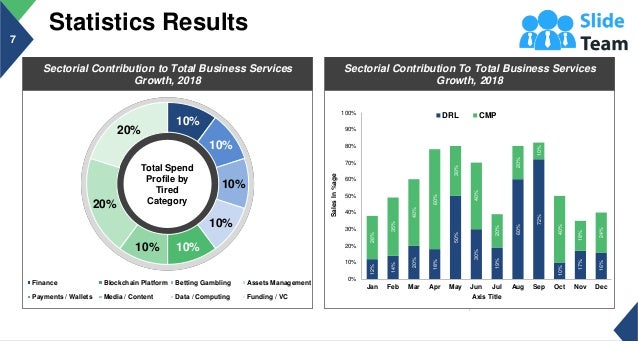


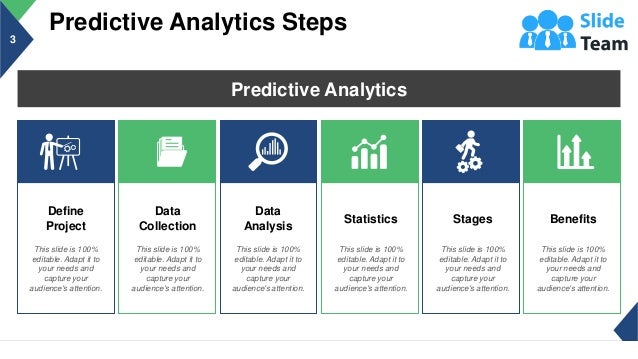
This document outlines a presentation agenda focused on statistical analysis, predictive analytics, and data collection strategies for a company. Key sections include an outline of the team, project definitions, data collection processes, analysis methods, and the benefits of predictive analytics. Additionally, it offers editable slides related to graphs, statistics, and visual aids to engage the audience.


