Download as PDF, PPTX

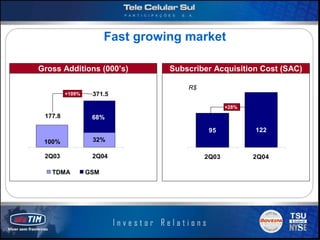
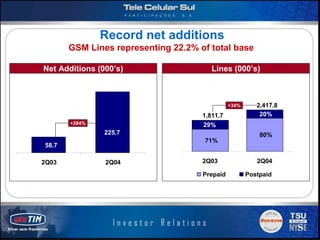


(1) Tele Celular Sul Participações S.A. (TIM Sul) reported strong 2Q04 results with its GSM network. (2) The company rapidly expanded GSM coverage to 82% of the population within 10 months through high site-sharing of 97%. (3) TIM Sul achieved record subscriber growth in 2Q04 with net additions up 284% and GSM lines now representing 22.2% of the total subscriber base.


