Download as PDF, PPTX
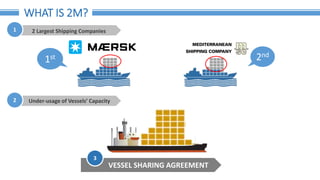


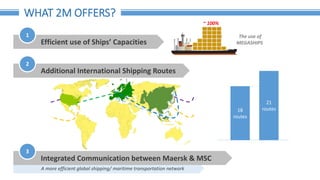

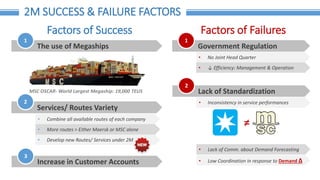

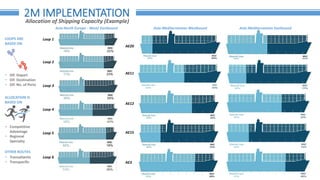


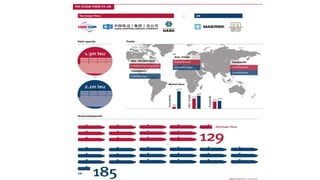

Team 8 presented information on 2M, a vessel sharing agreement between Maersk and MSC, the two largest shipping companies. Under 2M, they aim to make more efficient use of their vessels' capacities by integrating routes and communication. This is intended to save an estimated $350 million annually by reducing costs through improved fuel efficiency, port efficiency, and vessel utilization now that their combined 185 vessels service 21 routes. While opportunities include economies of scale and a more competitive service, challenges may include lack of standardization and potential regulation issues. The presentation outlined 2M's implementation process and initial outcomes after 6 months of operation.


