Download to read offline

![One delivery unit. Contains:
Java service
In a single executable fat-jar.
Installation script
[Re]installs service on the
machine, registers it in
/etc/init.d
Init.d script
Contains instructions to start,
stop, restart JVM and get quick
status.
Delivery](https://image.slidesharecdn.com/talk2-140317144932-phpapp02/75/Talkbits-service-architecture-and-deployment-5-2048.jpg)
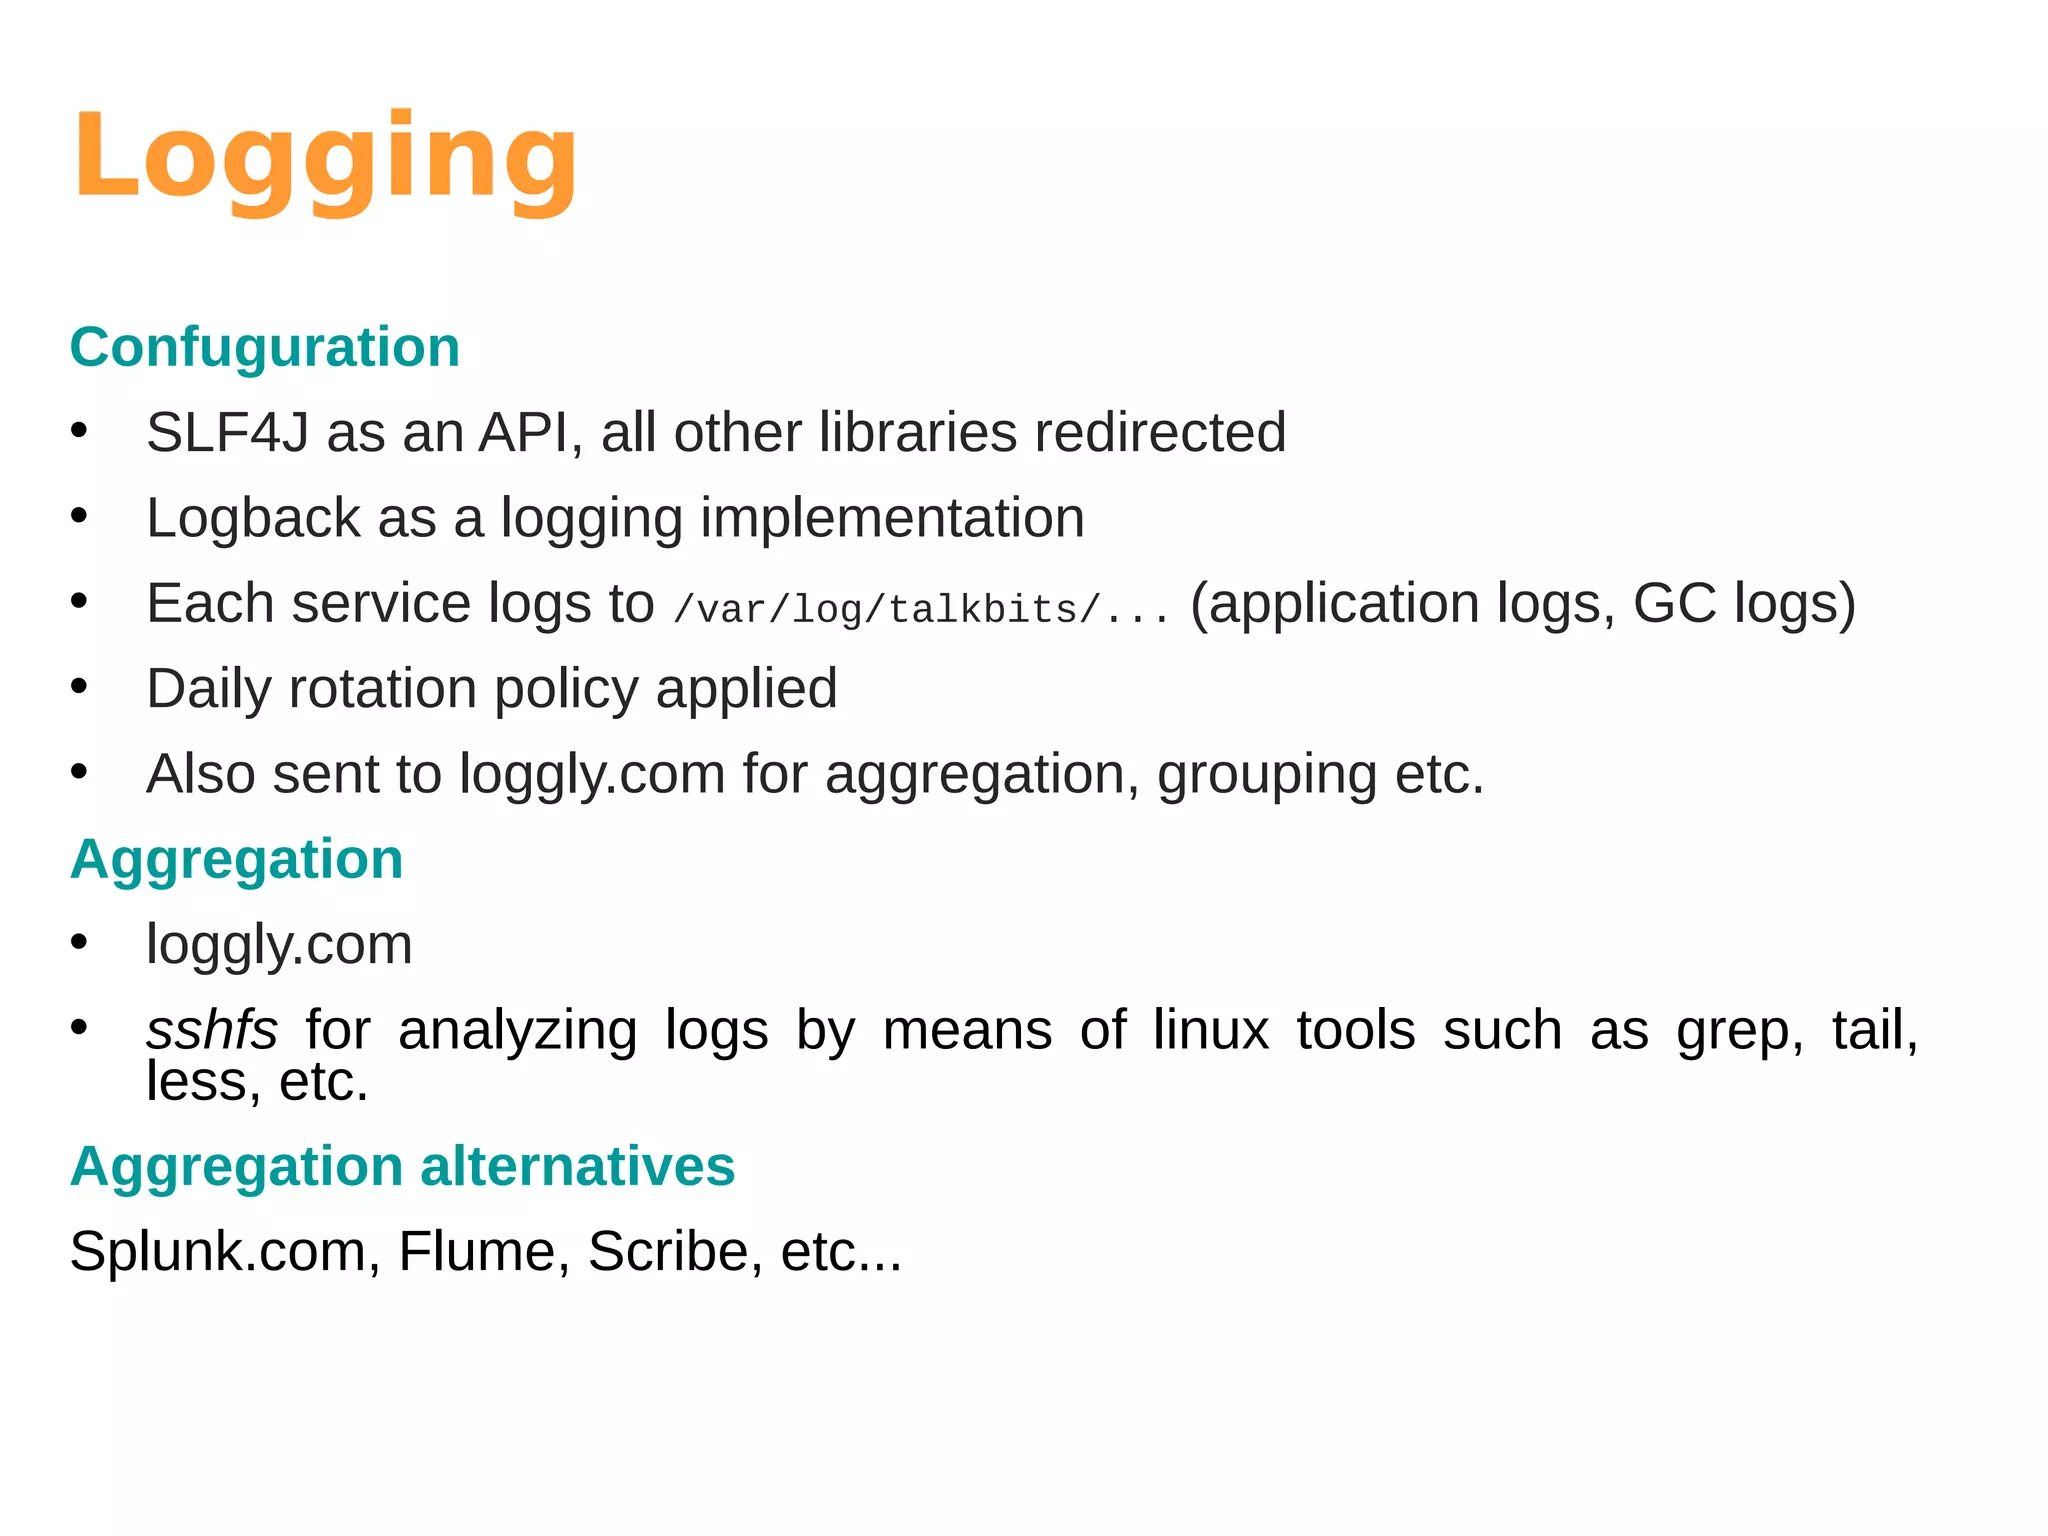
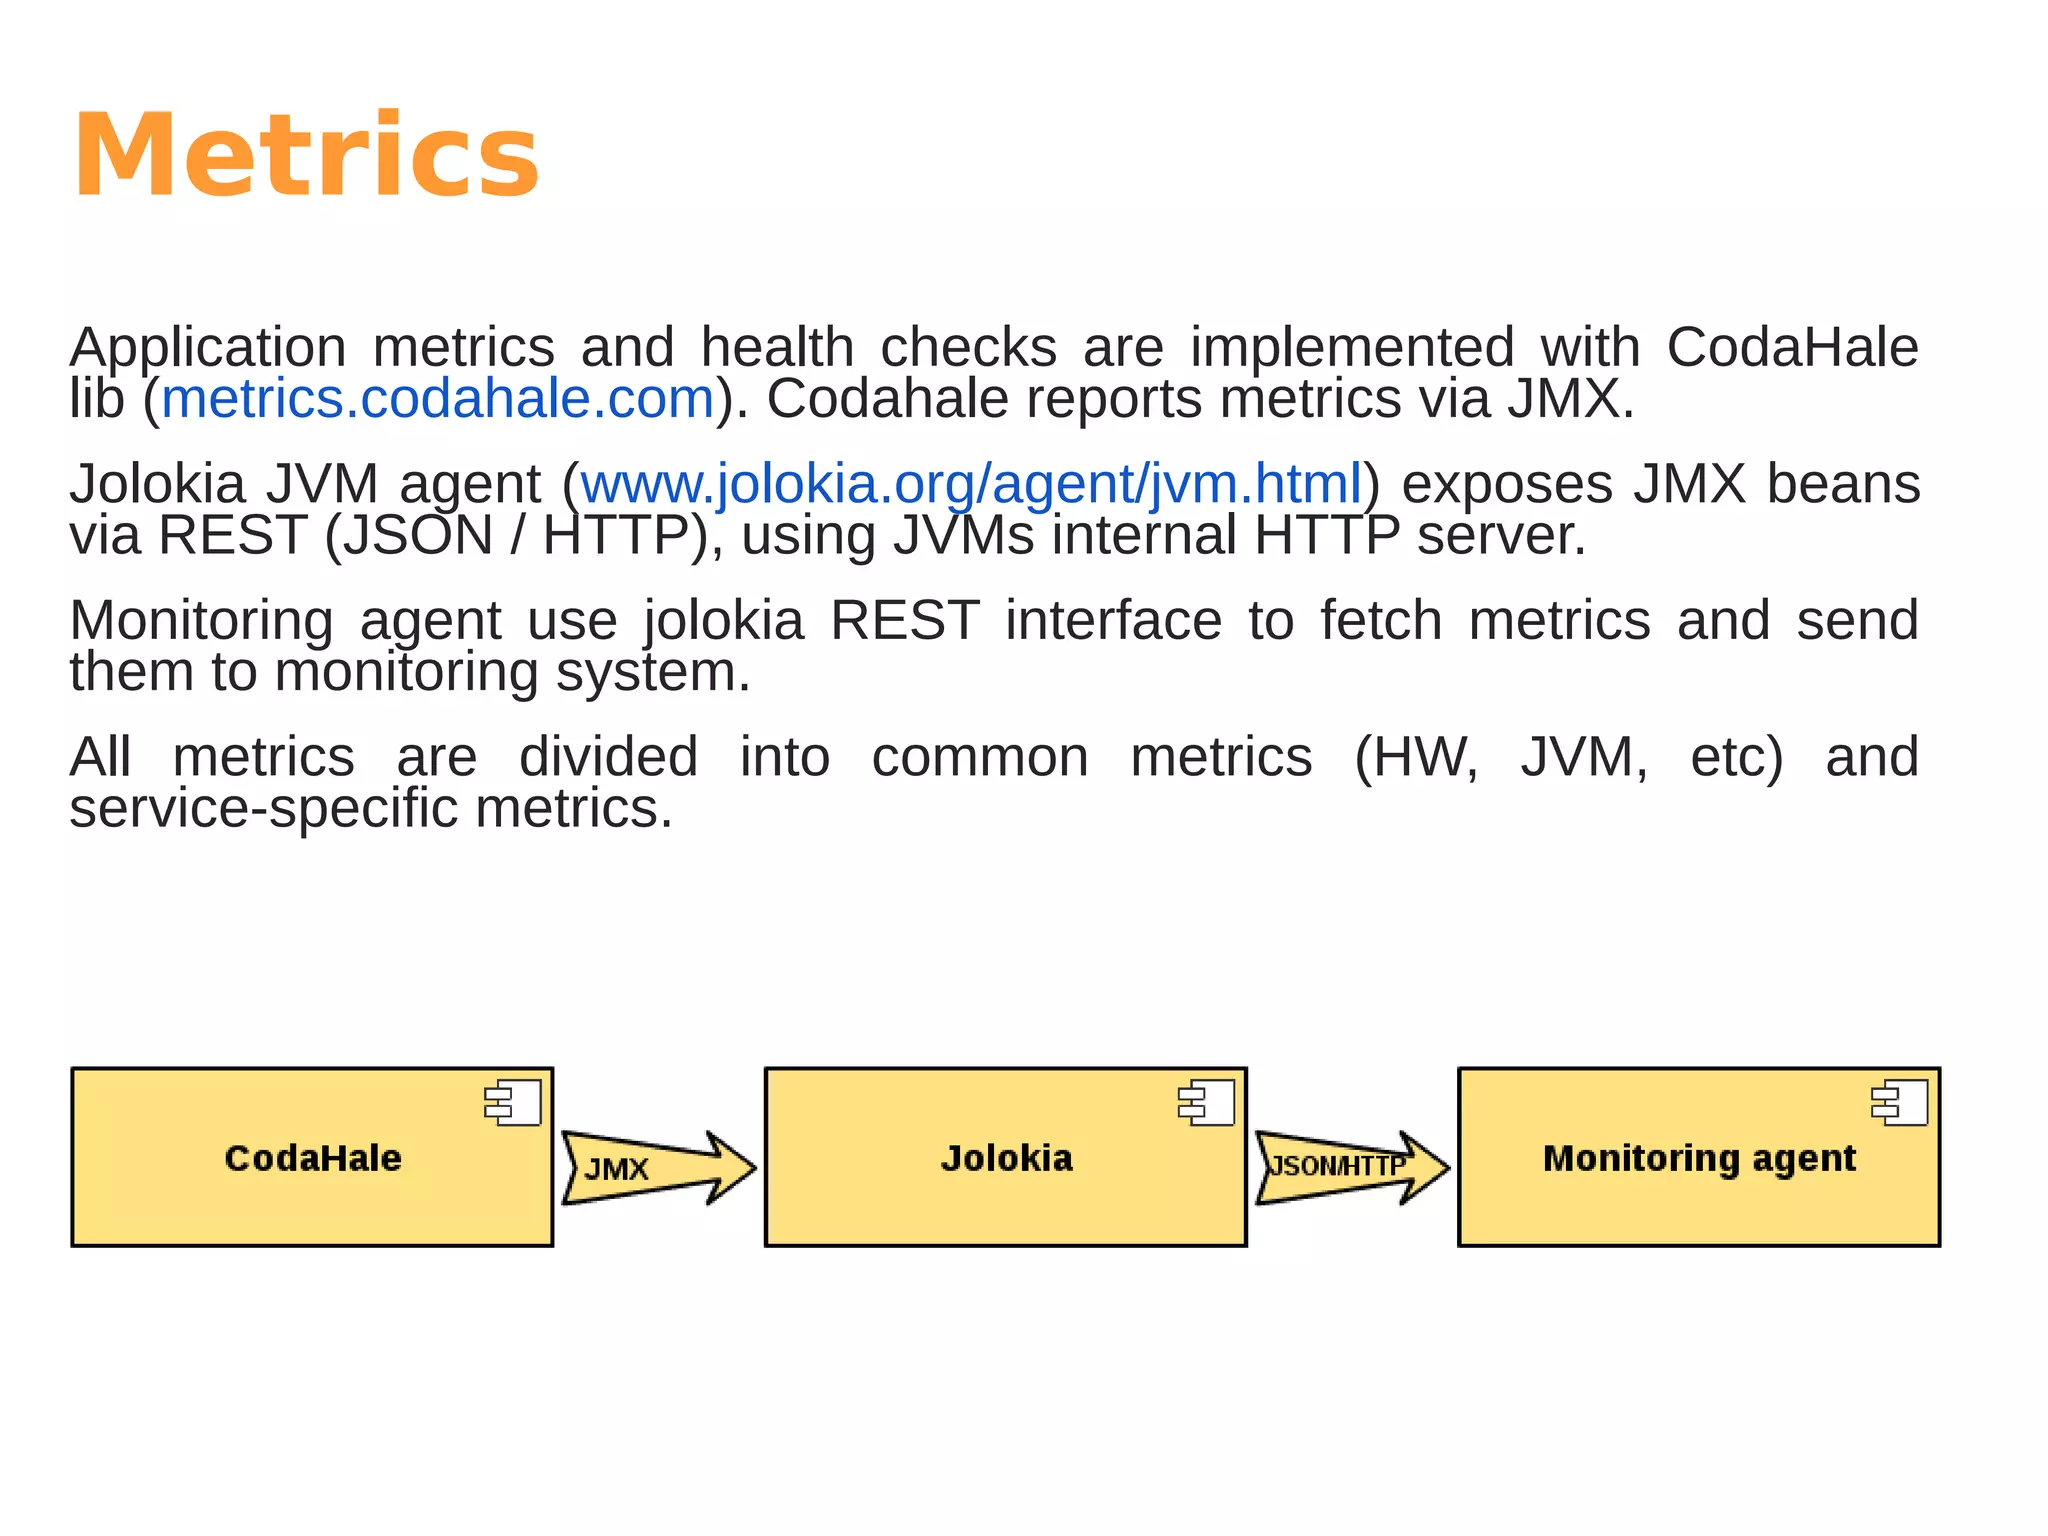
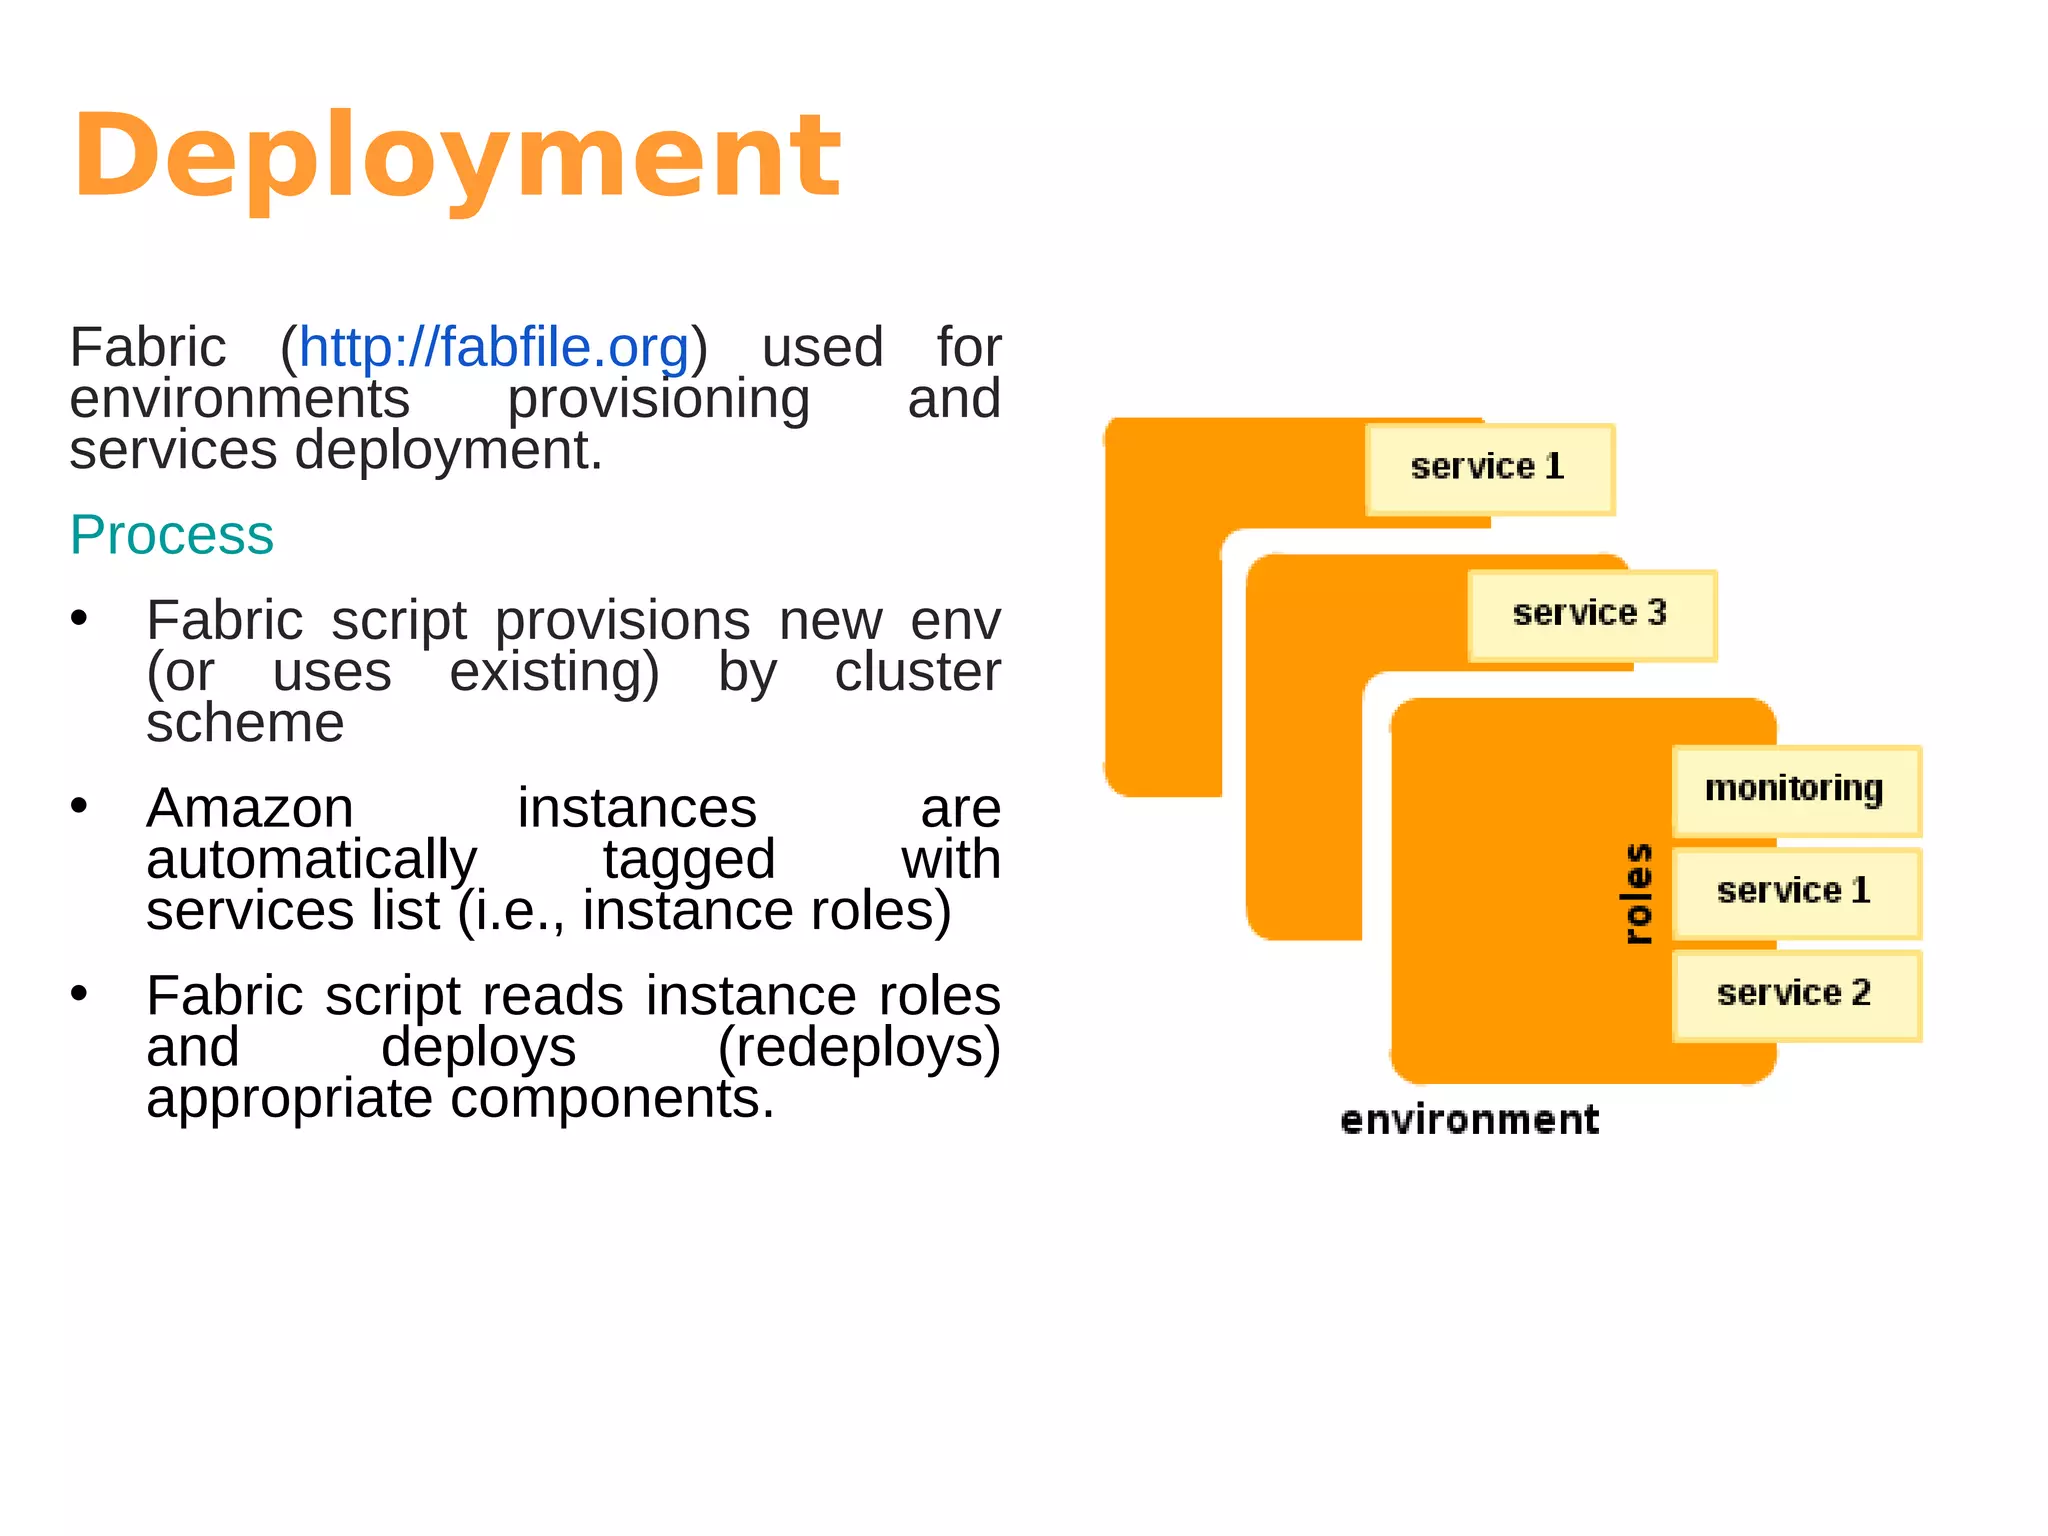
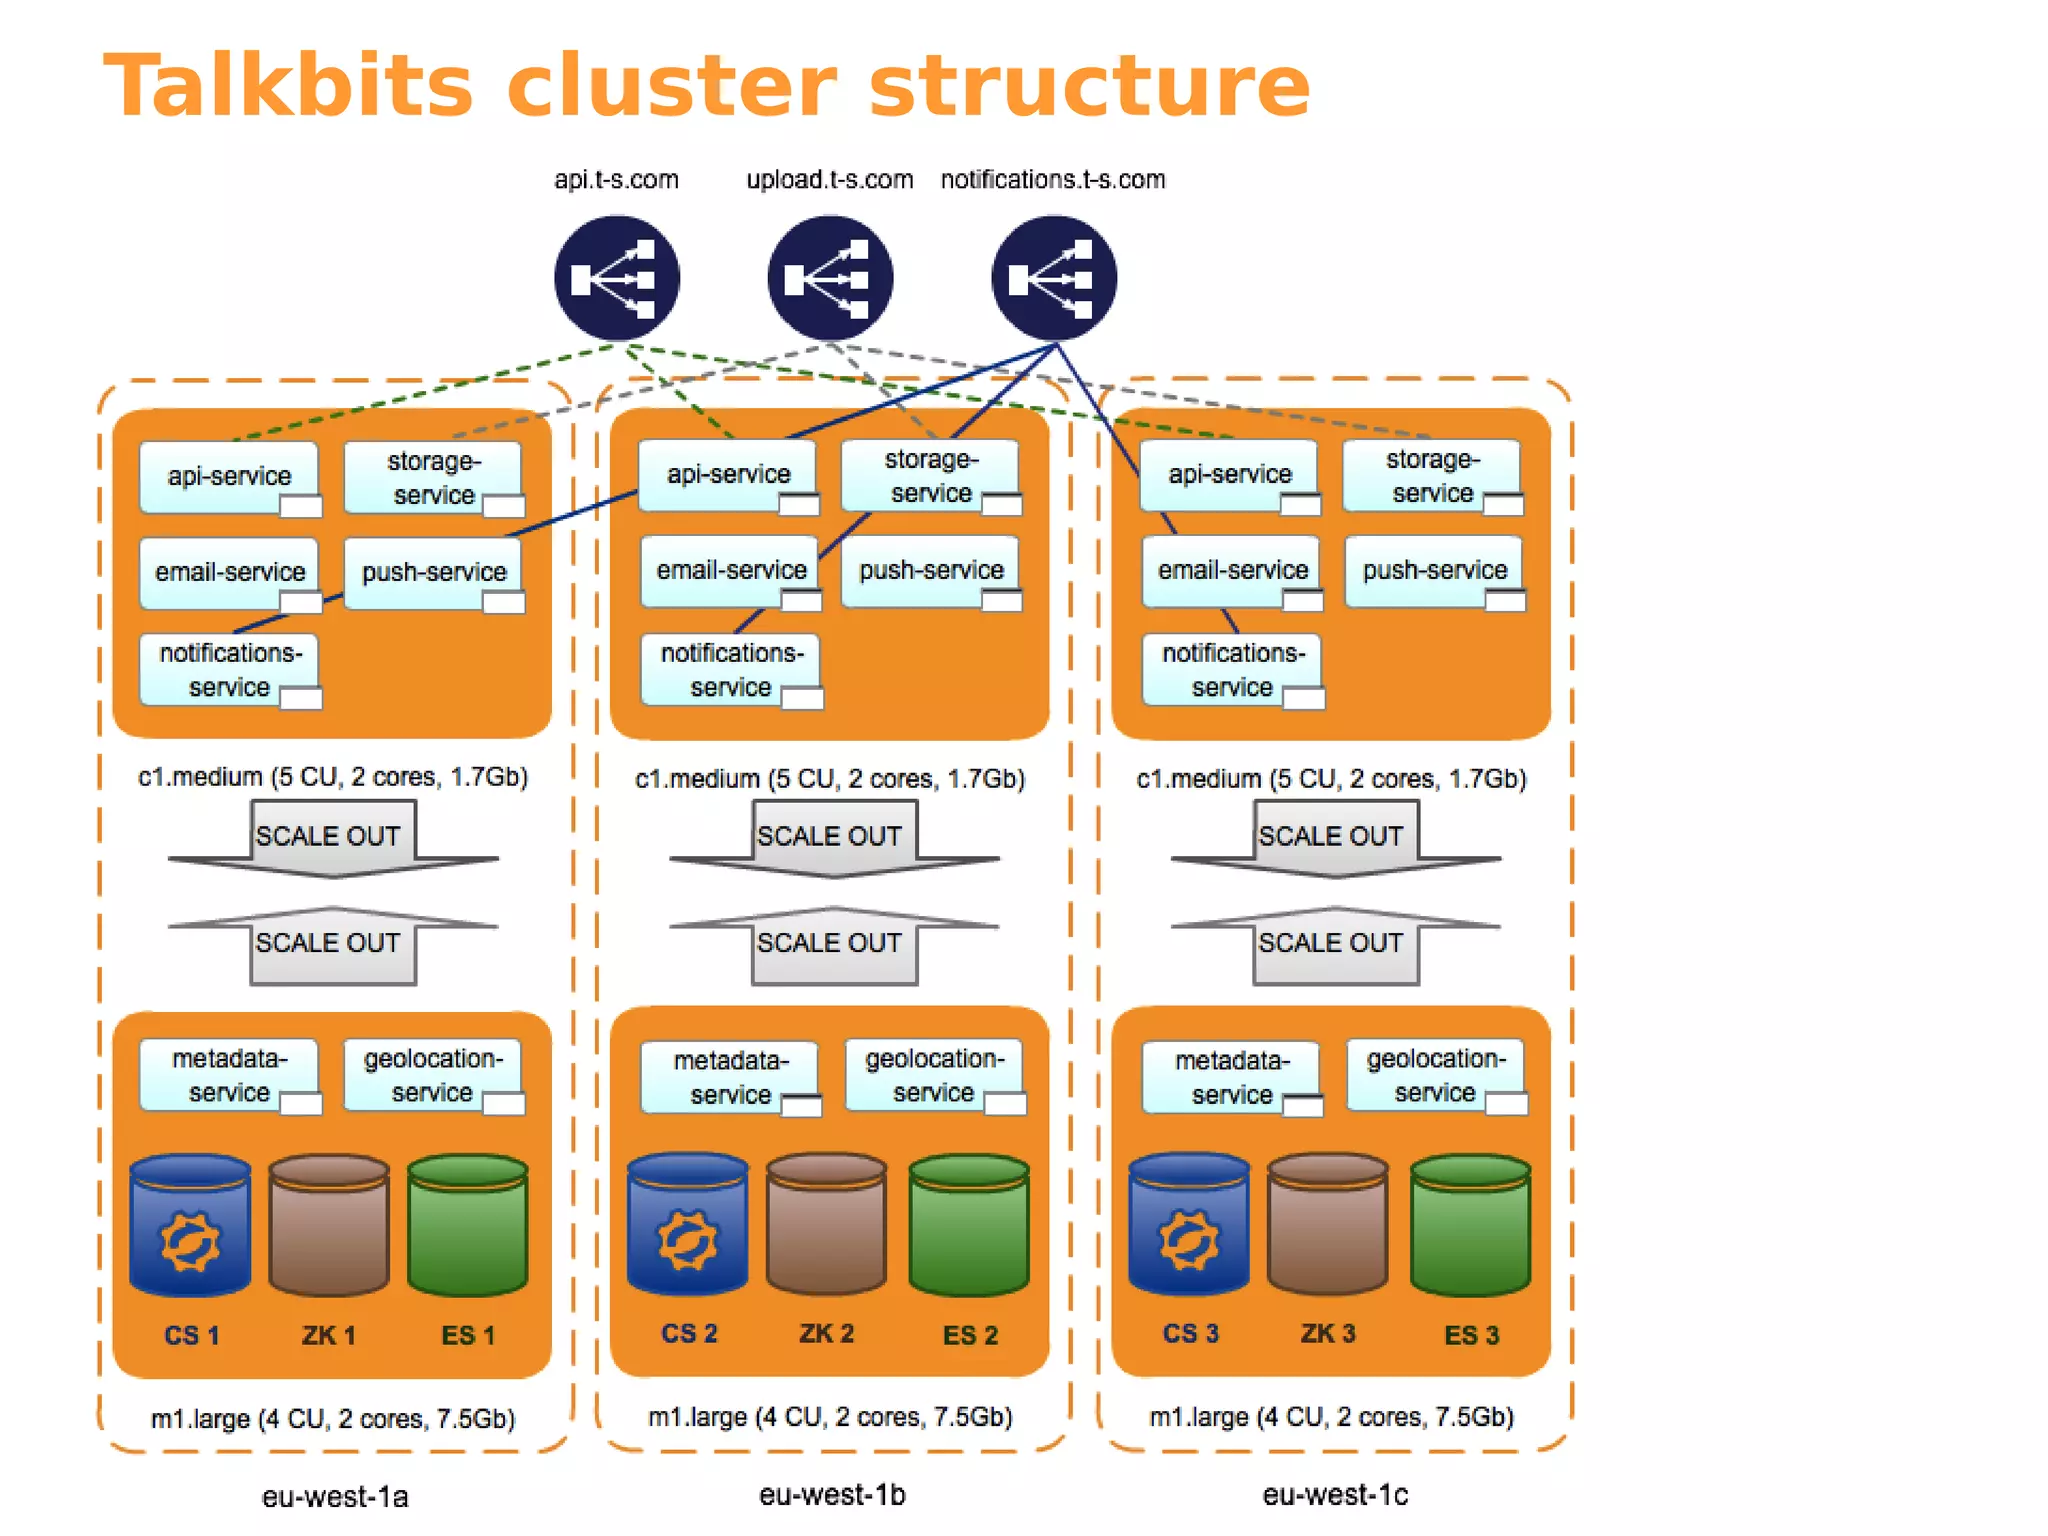


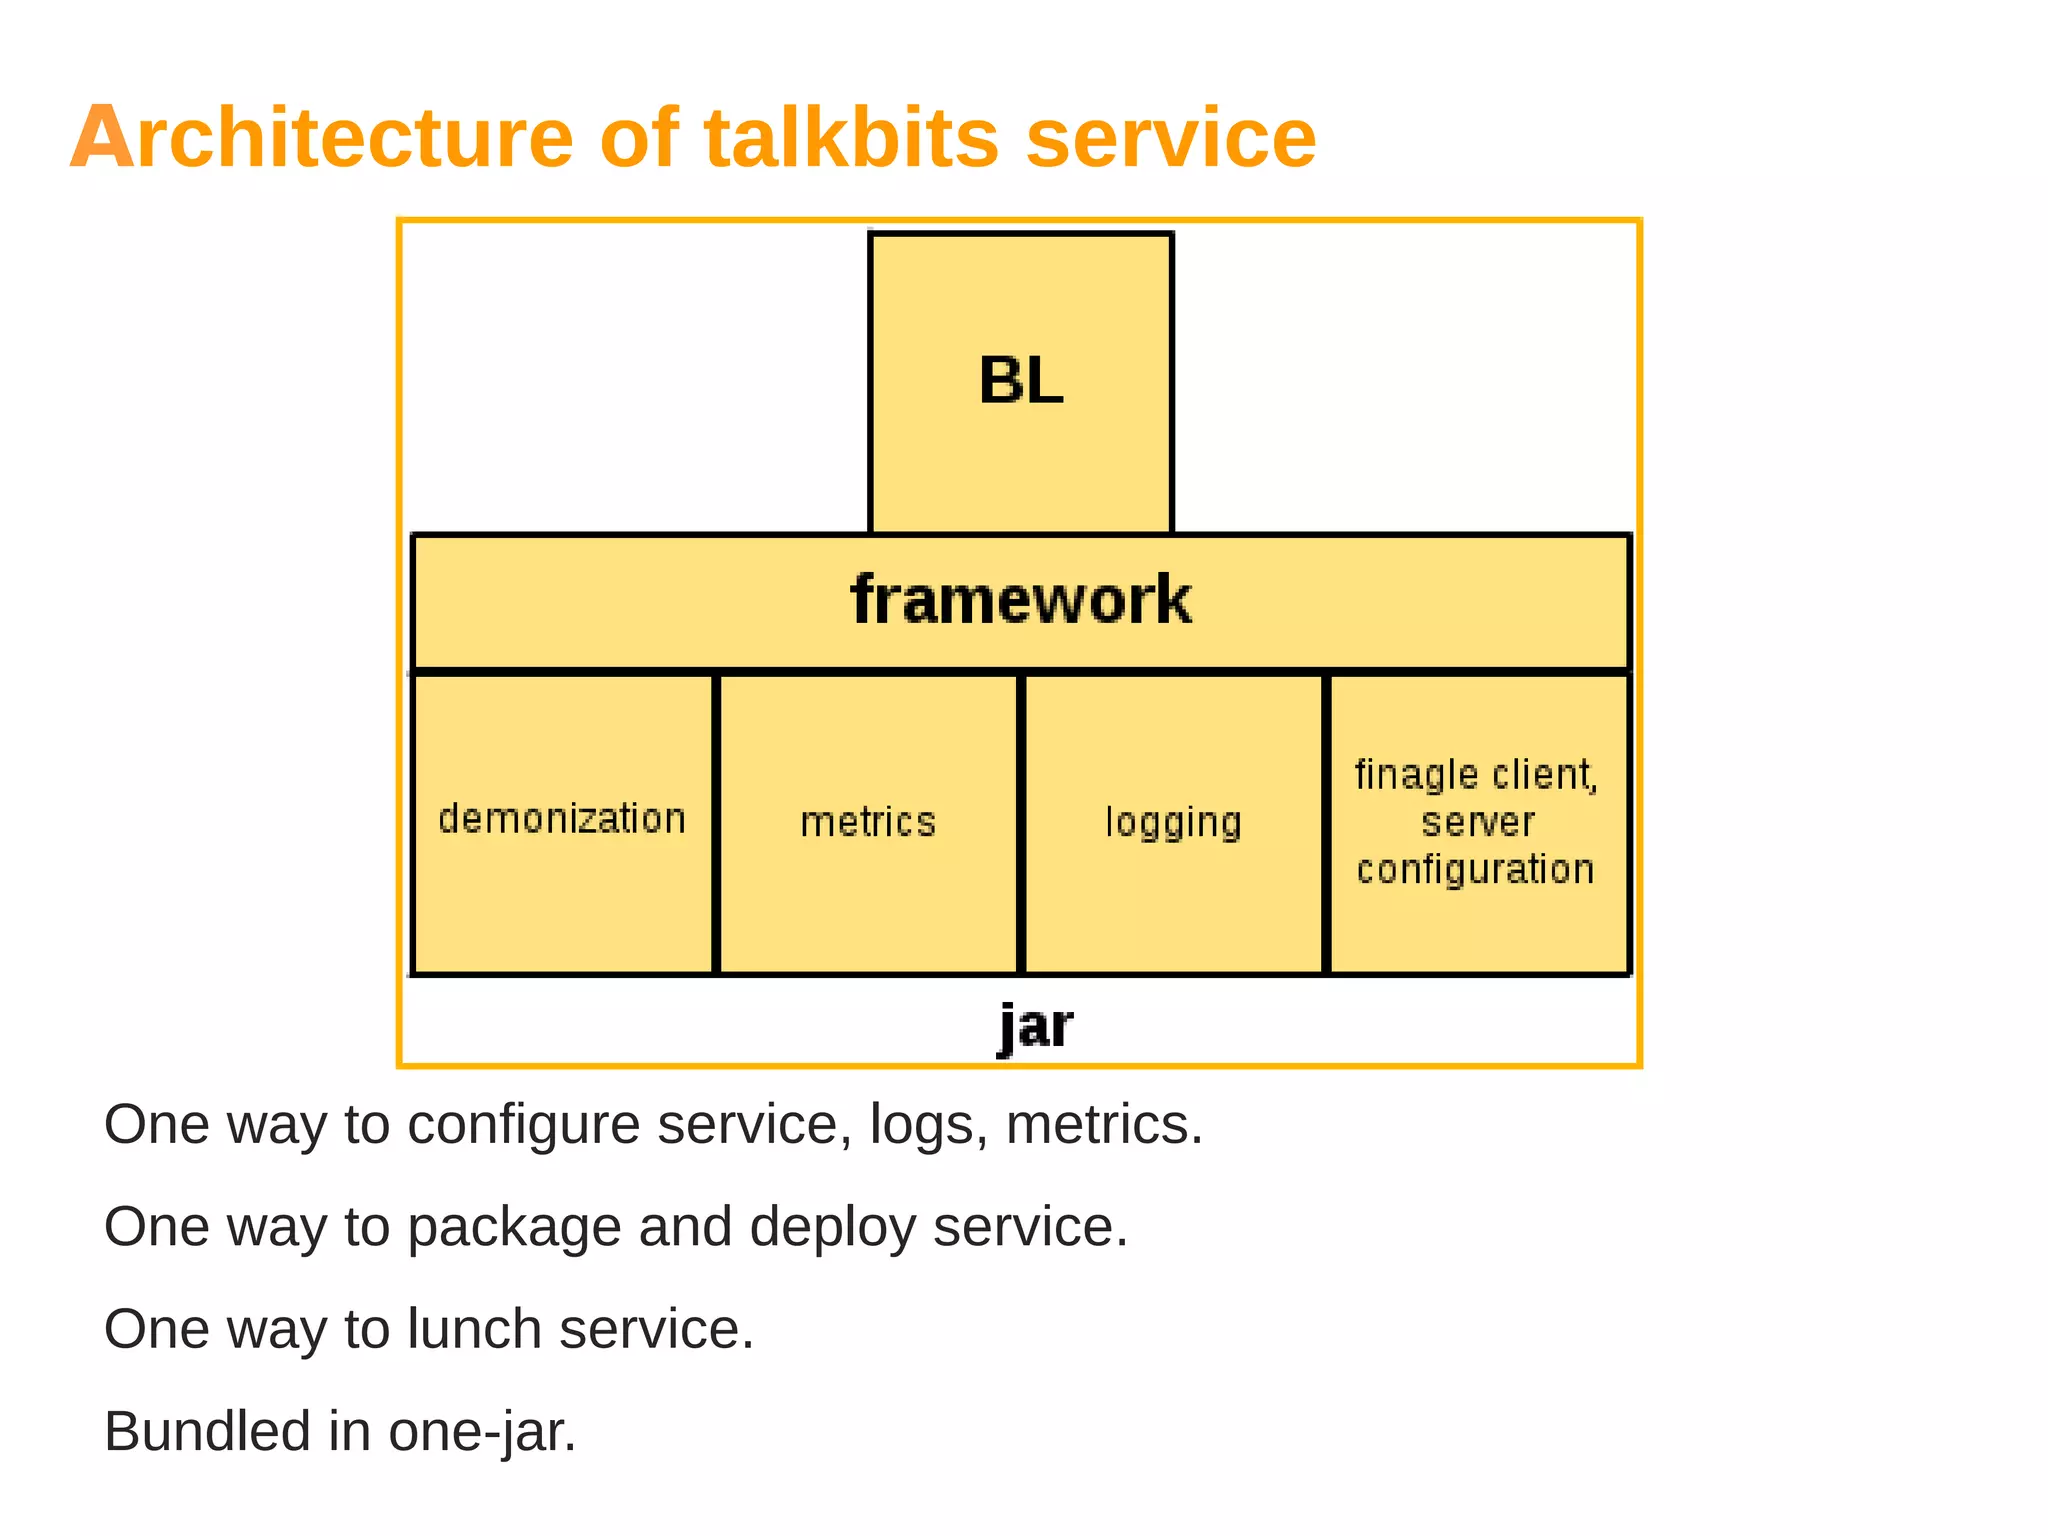
The document discusses the architecture and deployment of the Talkbits service. It describes how the service is packaged as a single executable JAR file along with installation and init scripts. It also covers how the service implements logging through SLF4J and Logback, sends logs to loggly for aggregation. Metrics are collected via CodaHale and exposed via Jolokia for monitoring. Fabric is used for environment provisioning and deployment across tagged Amazon instances. Monitoring is handled by Datadog which collects various metrics through its agent.