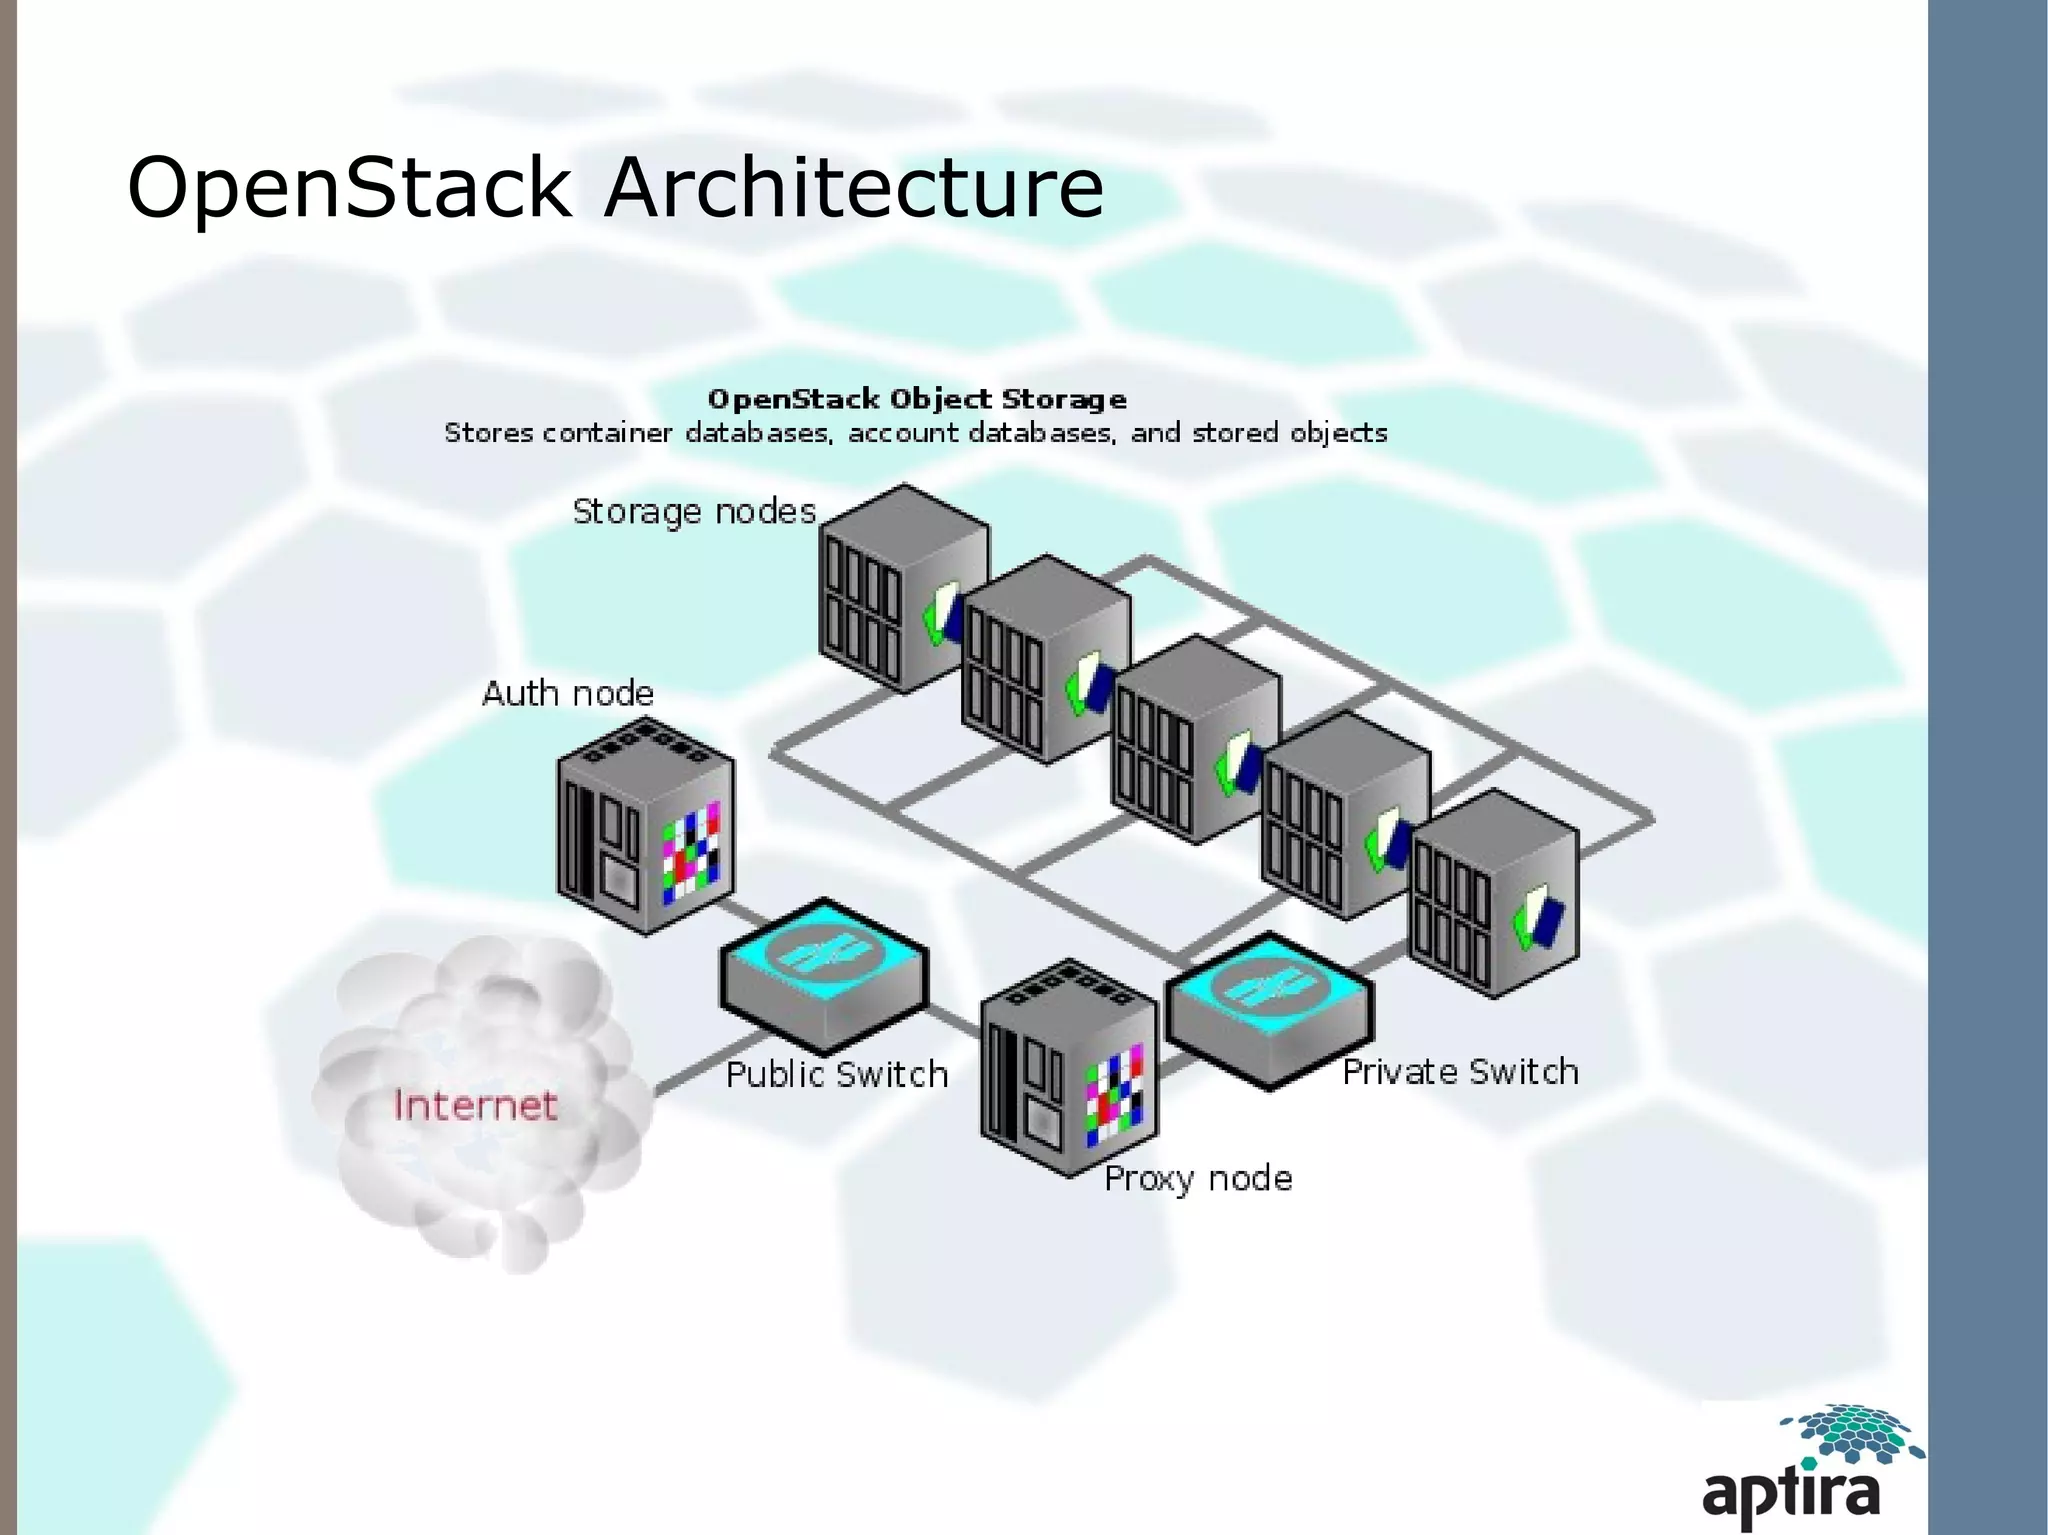
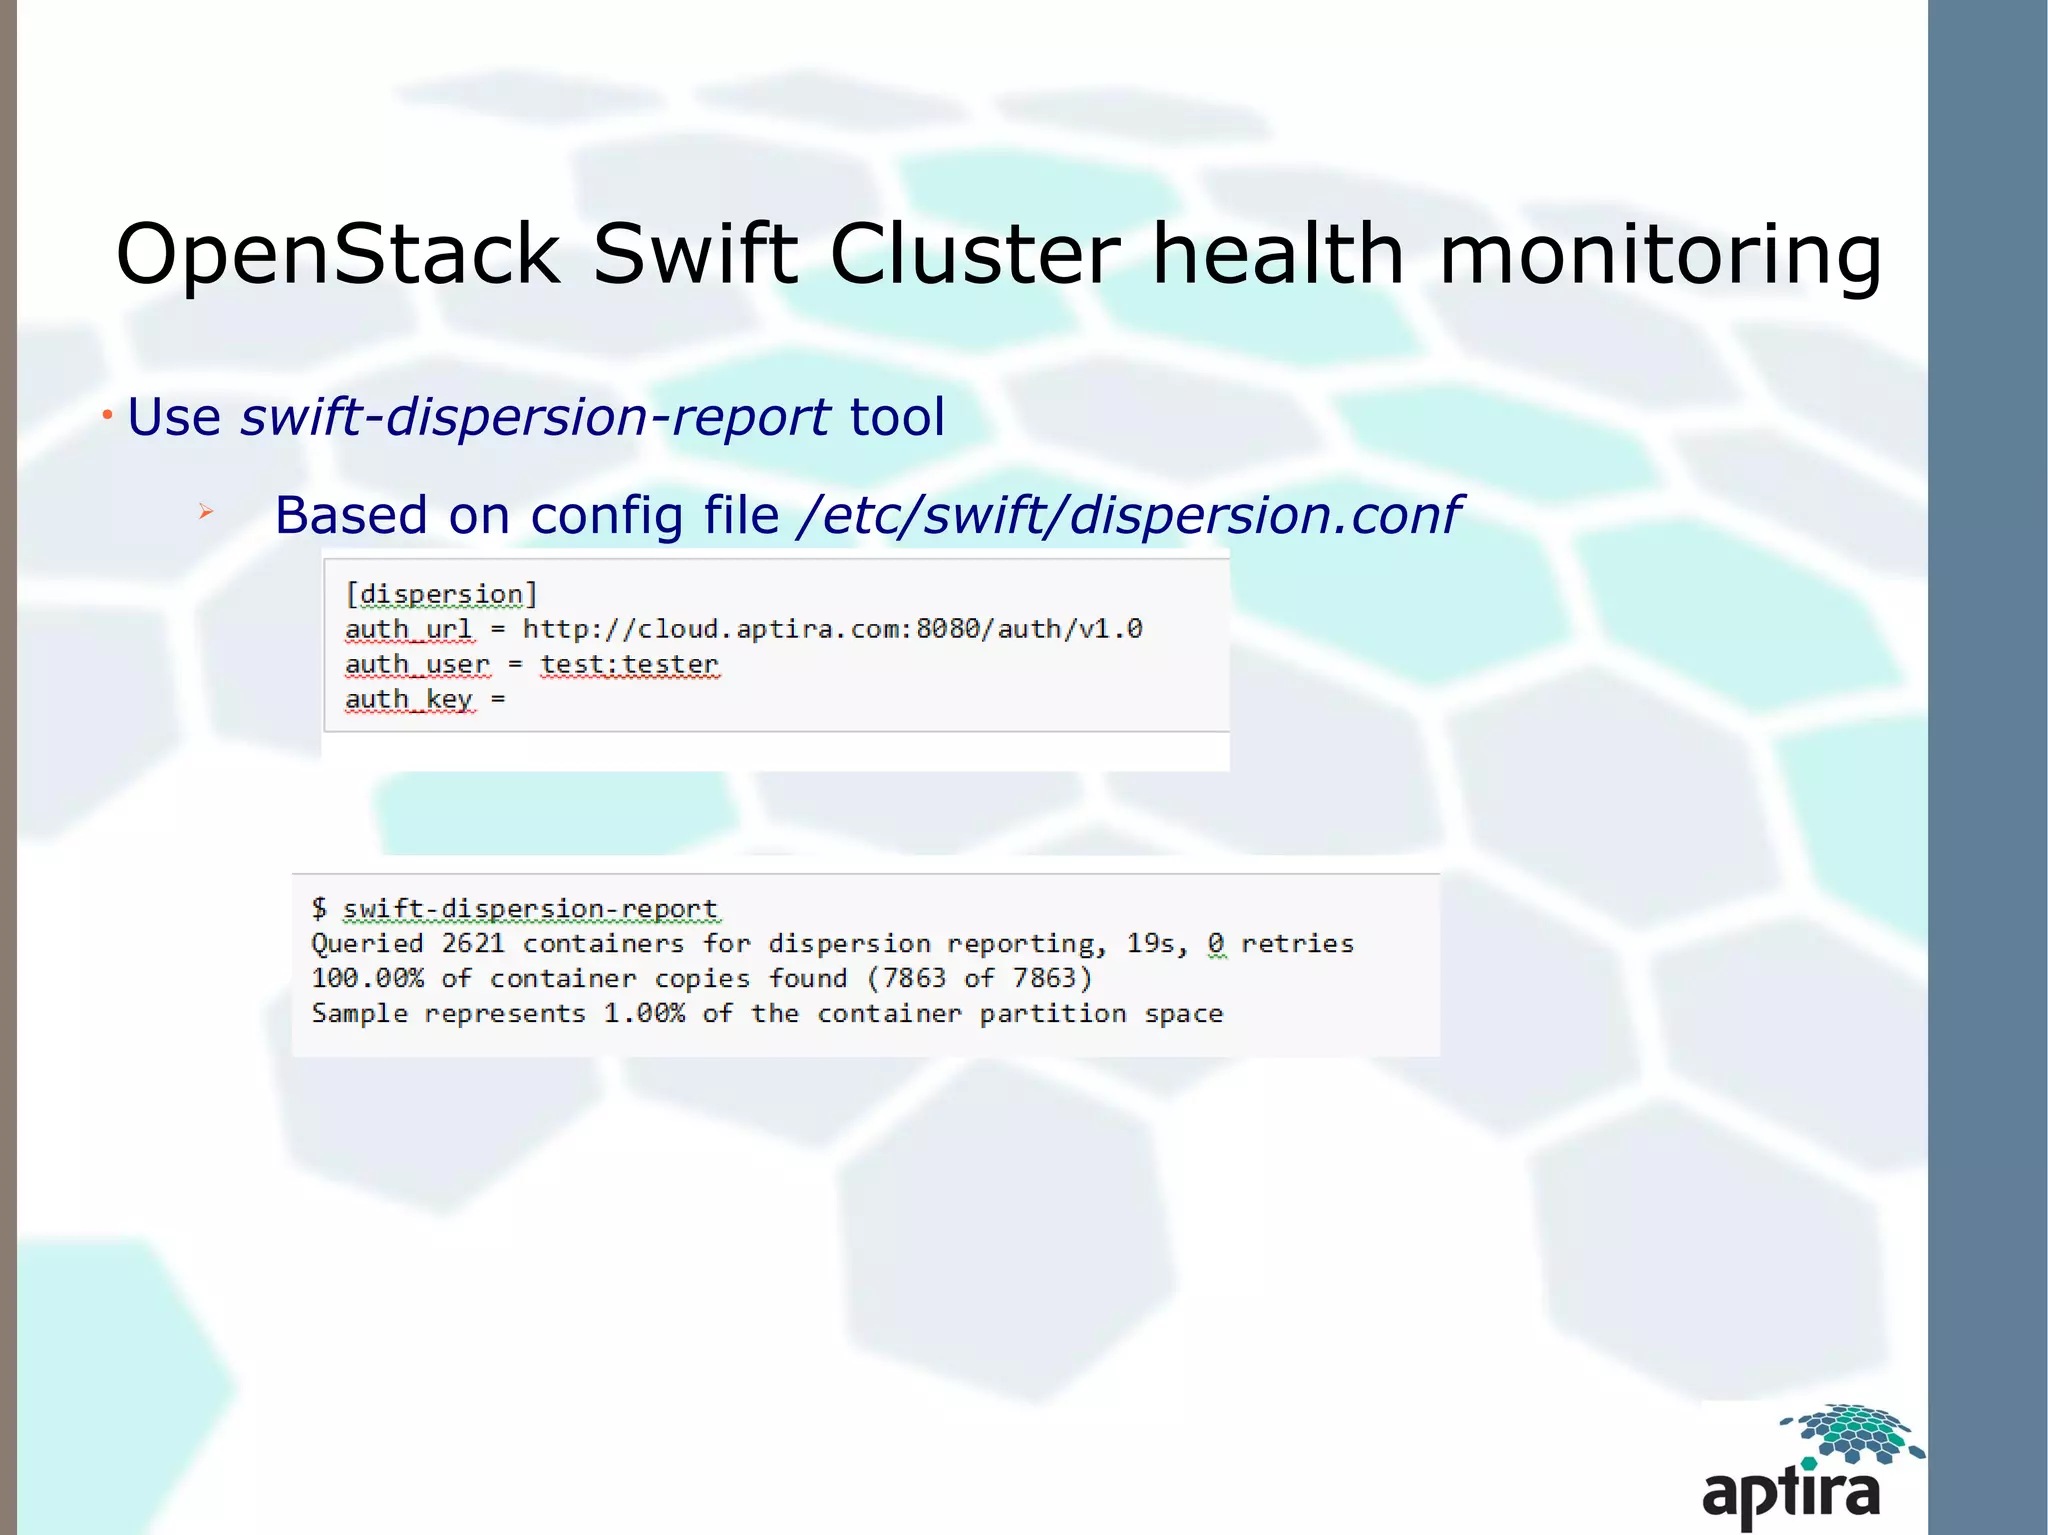
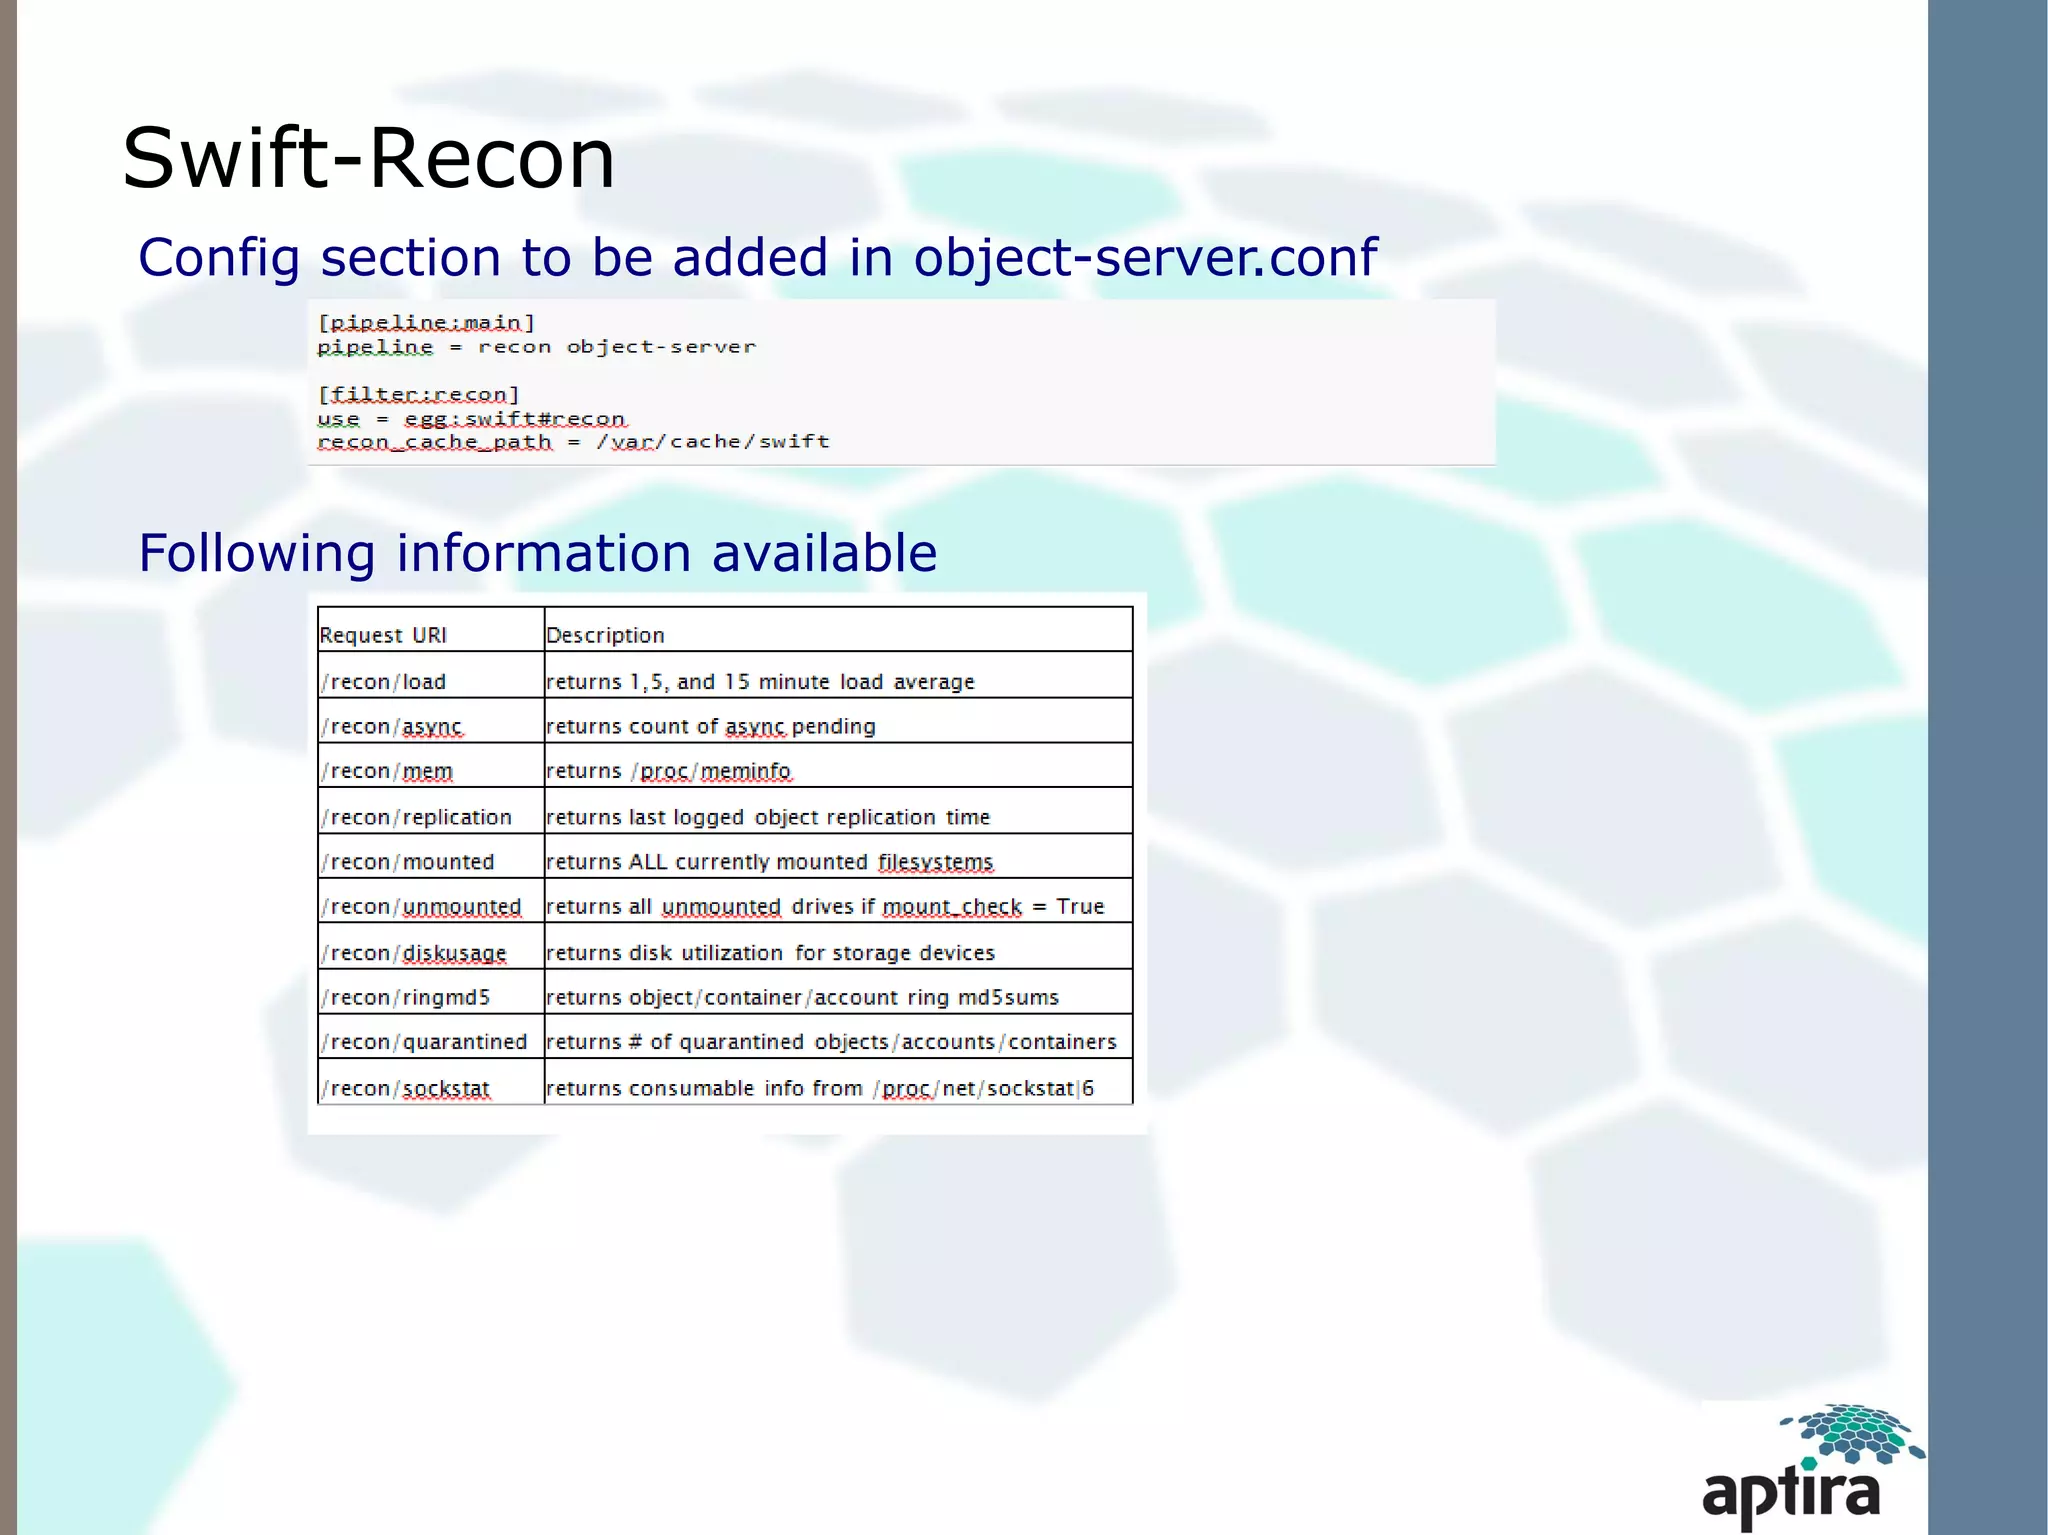
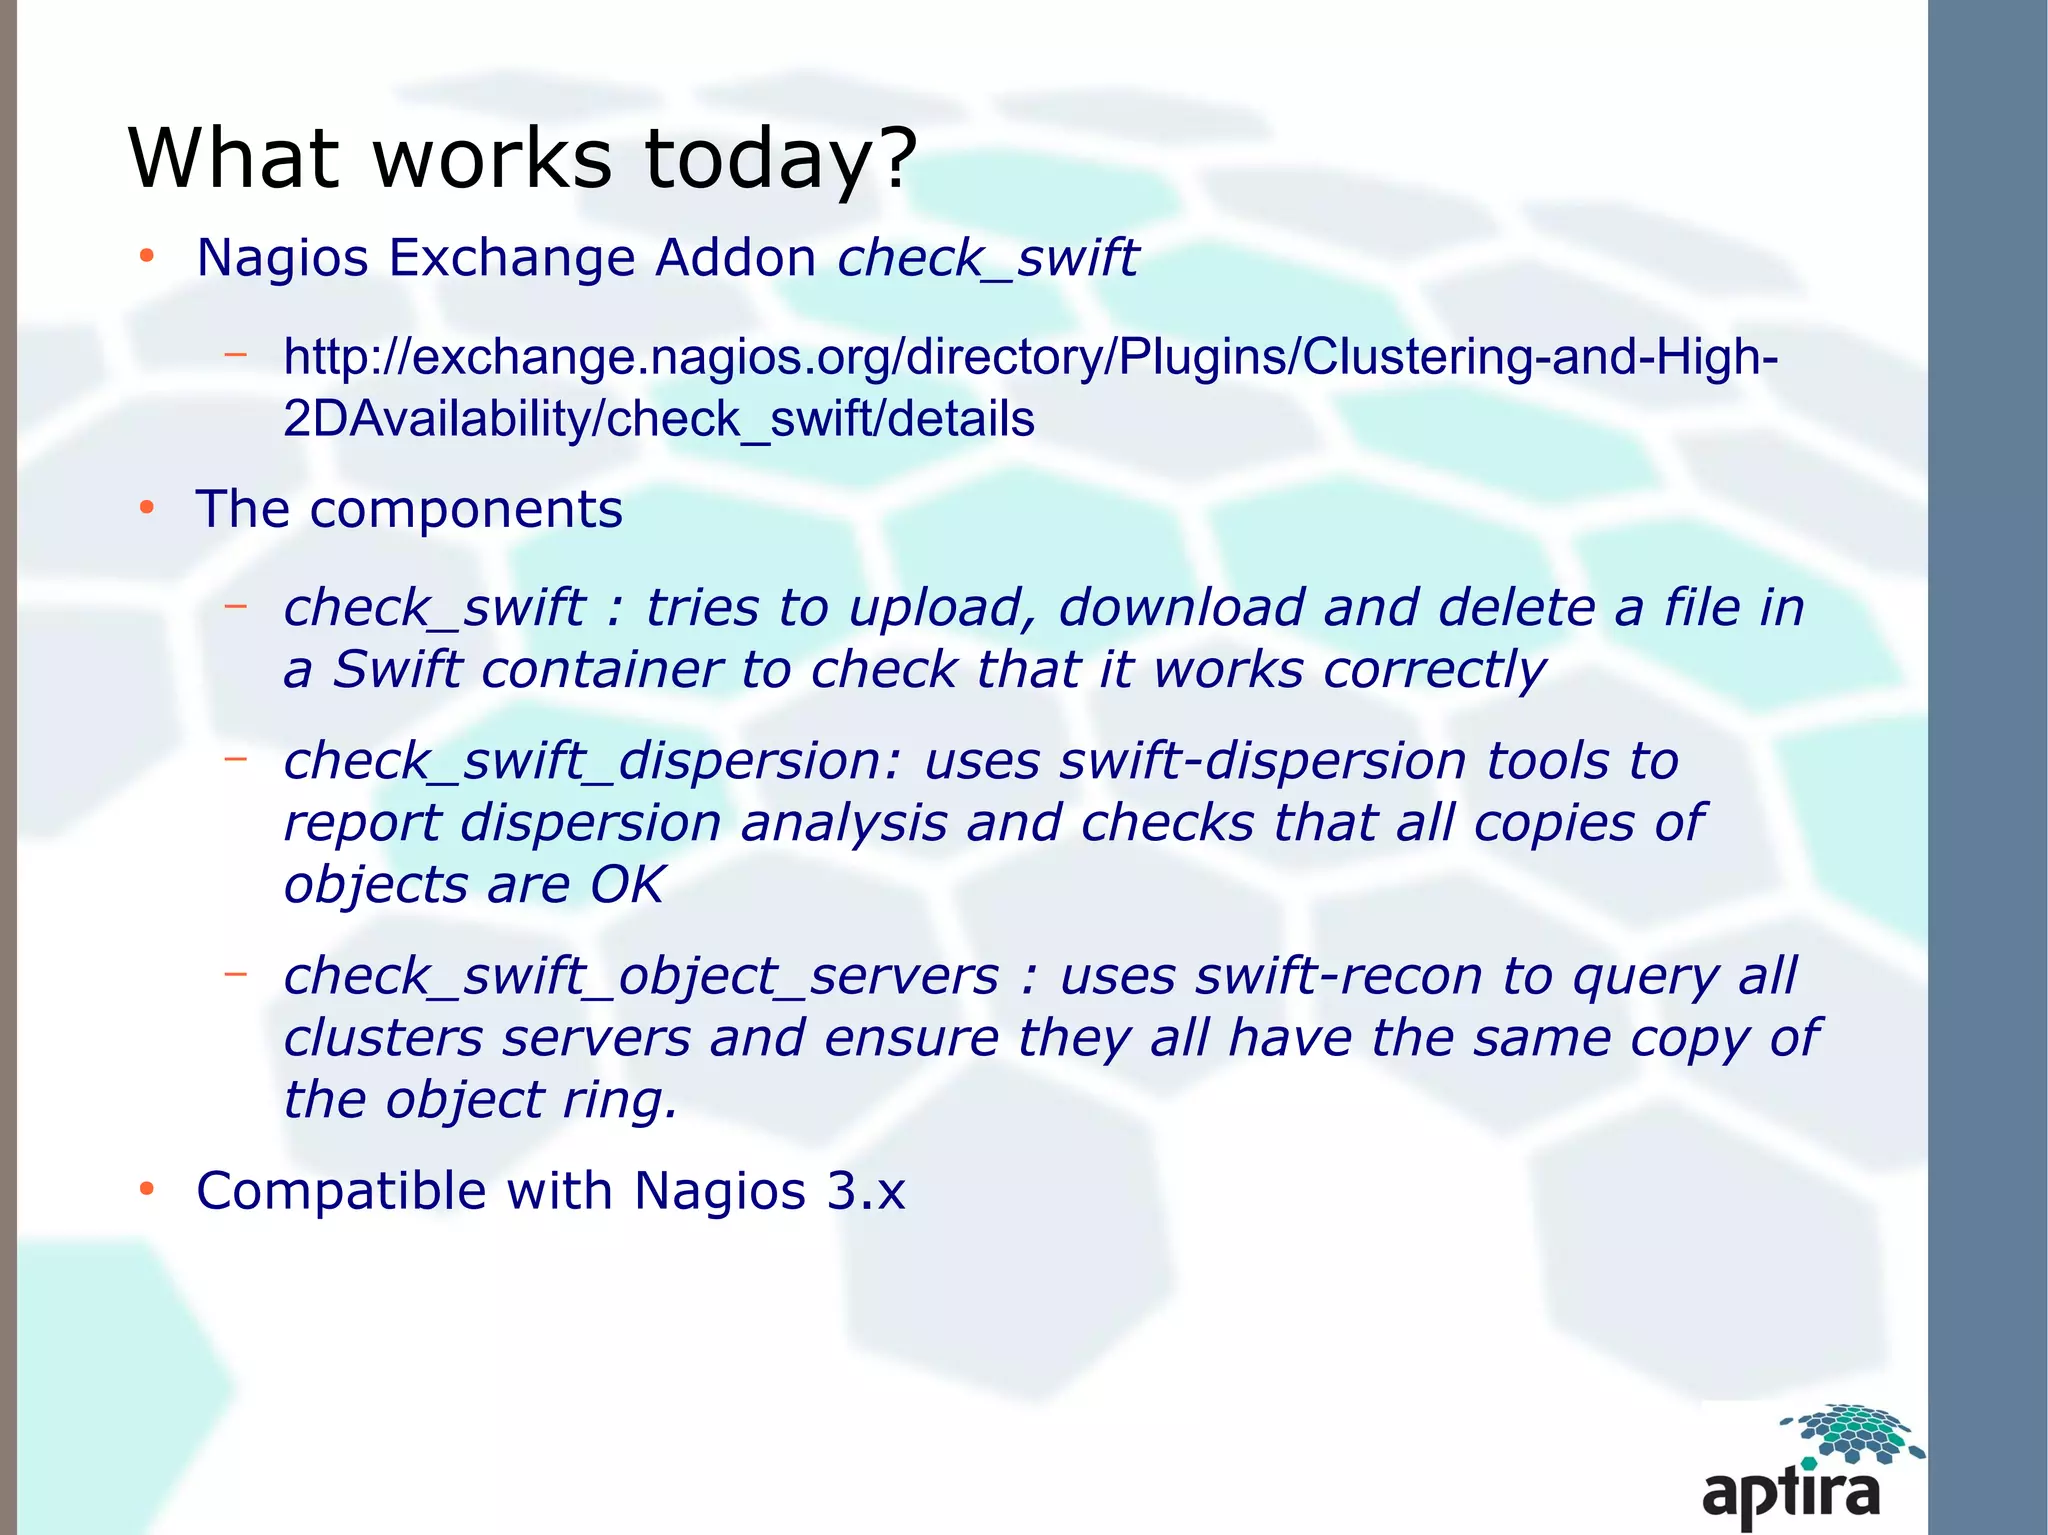
Aptira
OpenStack Architecture and
       Monitoring


        Indian Openstack users group
                5th May 2012
Agenda
 ●
     Explain OpenStack Swift Architecture
 ●
     Look at key components to be monitored
 ●
     Look at various options available that work
     today
OpenStack Architecture
Swift Components
•   Proxy Server
•   The Ring
•   The Object Server/Storage nodes
•   Account Server
•   Replication
•   Updaters and Auditors
What to monitor?
●
    Hardware failure
●
    Operating System failure
●
    Swift Cluster health
●
    Swift Cluster telemetry
Hardware Failure and Operating Systems
●
    Hard drive failure detection in Swift
      
          Use swift-drive-audit


Other Common metrics like
•


      •
          CPU usage
      •
          RAM usage
      •
          Network usage etc.
OpenStack Swift Cluster health monitoring
●
    Use swift-dispersion-report tool
      
          Based on config file /etc/swift/dispersion.conf
Cluster Telemetry and Monitoring
●
    swift-recon middleware
The Swift Recon middleware can provide general machine stats
(load average, socket stats, /proc/meminfo contents, etc.) as
well as Swift-specific metrics:


      
          The MD5 sum of each ring file.
      
          The most recent object replication time.
      
          Count of each type of quarantined file: account,
          container, or object.
      
          Count of “async_pendings” (deferred container updates)
          on disk.
Swift-Recon
Config section to be added in object-server.conf


Following information available
What works today?
●
    A lot of development going on around OpenStack in the community. Existing
    enterprise grade systems have written modules for OpenStack


●
    Nagios
●
    Zenoss
What works today?
●
    Nagios Exchange Addon check_swift
     –   http://exchange.nagios.org/directory/Plugins/Clustering-and-High-
         2DAvailability/check_swift/details
●
    The components
     –   check_swift : tries to upload, download and delete a file in
         a Swift container to check that it works correctly
     –   check_swift_dispersion: uses swift-dispersion tools to
         report dispersion analysis and checks that all copies of
         objects are OK
     –   check_swift_object_servers : uses swift-recon to query all
         clusters servers and ensure they all have the same copy of
         the object ring.
●
    Compatible with Nagios 3.x
What works today?
●
    Zenoss Zen Pack Open Stack Swift
     –   https://github.com/zenoss/ZenPacks.zenoss.OpenStackSwift
●
    All of the monitoring currently performance is done through
    the optional swift-recon API endpoint that can be enabled on
    all of your Swift object servers. Before using this ZenPack you
    must install and configure swift-recon on your Swift object
    servers.
●
    Compatible with versions 3.2 to 4.0
Questions?
The End

Aptira presents OpenStack swift architecture and monitoring

  • 1.
    Aptira OpenStack Architecture and Monitoring Indian Openstack users group 5th May 2012
  • 2.
    Agenda ● Explain OpenStack Swift Architecture ● Look at key components to be monitored ● Look at various options available that work today
  • 3.
  • 4.
    Swift Components • Proxy Server • The Ring • The Object Server/Storage nodes • Account Server • Replication • Updaters and Auditors
  • 5.
    What to monitor? ● Hardware failure ● Operating System failure ● Swift Cluster health ● Swift Cluster telemetry
  • 6.
    Hardware Failure andOperating Systems ● Hard drive failure detection in Swift  Use swift-drive-audit Other Common metrics like • • CPU usage • RAM usage • Network usage etc.
  • 7.
    OpenStack Swift Clusterhealth monitoring ● Use swift-dispersion-report tool  Based on config file /etc/swift/dispersion.conf
  • 8.
    Cluster Telemetry andMonitoring ● swift-recon middleware The Swift Recon middleware can provide general machine stats (load average, socket stats, /proc/meminfo contents, etc.) as well as Swift-specific metrics:  The MD5 sum of each ring file.  The most recent object replication time.  Count of each type of quarantined file: account, container, or object.  Count of “async_pendings” (deferred container updates) on disk.
  • 9.
    Swift-Recon Config section tobe added in object-server.conf Following information available
  • 10.
    What works today? ● A lot of development going on around OpenStack in the community. Existing enterprise grade systems have written modules for OpenStack ● Nagios ● Zenoss
  • 11.
    What works today? ● Nagios Exchange Addon check_swift – http://exchange.nagios.org/directory/Plugins/Clustering-and-High- 2DAvailability/check_swift/details ● The components – check_swift : tries to upload, download and delete a file in a Swift container to check that it works correctly – check_swift_dispersion: uses swift-dispersion tools to report dispersion analysis and checks that all copies of objects are OK – check_swift_object_servers : uses swift-recon to query all clusters servers and ensure they all have the same copy of the object ring. ● Compatible with Nagios 3.x
  • 12.
    What works today? ● Zenoss Zen Pack Open Stack Swift – https://github.com/zenoss/ZenPacks.zenoss.OpenStackSwift ● All of the monitoring currently performance is done through the optional swift-recon API endpoint that can be enabled on all of your Swift object servers. Before using this ZenPack you must install and configure swift-recon on your Swift object servers. ● Compatible with versions 3.2 to 4.0
  • 13.