Download to read offline

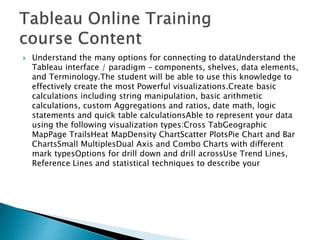
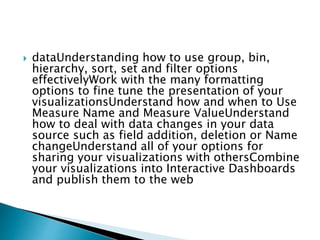


rstrainings is an institute offering online and classroom training for technology professionals and students, focusing on software and tech skill development. The document outlines a comprehensive Tableau training course covering data connections, visualizations, calculations, and dashboard building. Key topics include using the Tableau interface, creating various visualization types, and sharing work effectively.