Download to read offline
![International Journal of VLSI design & Communication Systems (VLSICS) Vol.3, No.1, February 2012
DOI : 10.5121/vlsic.2012.3110 119
SYSTEM ON PROGRAMMABLE CHIP FOR
PERFOMANCE ESTIMATION OF LOOM
MACHINE
Gurpreet Singh1
, Ajay Kumar Roy2
, Surekha K S3
, S Pujari4
1
Infosys, Chandigarh, India
jatt_gurpreet@yahoo.com
2
Infosys, Hyderabad, India
ajayroy70@yahoo.co.in
3
Army Institute of Technology, Dighi, Pune, India
surekhaks@yahoo.com
4
SUIIT, Sambalpur University, sambalpur, Odisha, India
sspujari@hotmail.com
ABSTRACT
System on programmable chip for the performance estimation of loom machine, which calculates the
efficiency and meter count for weaved cloth automatically. Also it calculates the efficiency of loom
machine. Previously the same was done using manual process which was not efficient. This article is
intended for loom machines which are not modern.
KEYWORDS
Loom machine, efficiency, meter count
1. INTRODUCTION
Now a days the loom machines used are very sophisticated and costly [1] [8][9][11]. So small
factories running loom machine are not able to purchase those costly loom machines. So we
thought of upgrading the older loom machines which are still in use in small factory like one in
Kolhapur, a city in the state of Maharashtra, India. We are making it easier to calculate the
performance parameters like efficiency calculation, meter calculation etc. Traditionally
calculation of efficiency is a complete manual process. Here overall meters of cloth weaved by a
machine in one shift will be considered. For calculations of efficiency there were various
disadvantages like loss of data, error due to machine stoppage, manual error etc.
In current PC based electronic system loom machine there are certain advantages over traditional
system. But in spite of that there are several disadvantages like PC should always be ON,
complete utilization of PC is not done, and the need of skilled labors.
In the new proposed system we are using VLSI technology instead of microprocessor. This
system has an optional PC interface which will be used for data storage. Since the PC interface is
optional, system functioning will be independent of PC. This system has a user friendly keyboard
which can be operated by any person. It is not mandatory that the operator should have prior
knowledge of PC.](https://image.slidesharecdn.com/3112vlsics10-180829114235/85/SYSTEM-ON-PROGRAMMABLE-CHIP-FOR-PERFOMANCE-ESTIMATION-OF-LOOM-MACHINE-1-320.jpg)
![International Journal of VLSI design & Communication Systems (VLSICS) Vol.3, No.1, February 2012
DOI : 10.5121/vlsic.2012.3110 119
SYSTEM ON PROGRAMMABLE CHIP FOR
PERFOMANCE ESTIMATION OF LOOM
MACHINE
Gurpreet Singh1
, Ajay Kumar Roy2
, Surekha K S3
, S Pujari4
1
Infosys, Chandigarh, India
jatt_gurpreet@yahoo.com
2
Infosys, Hyderabad, India
ajayroy70@yahoo.co.in
3
Army Institute of Technology, Dighi, Pune, India
surekhaks@yahoo.com
4
SUIIT, Sambalpur University, sambalpur, Odisha, India
sspujari@hotmail.com
ABSTRACT
System on programmable chip for the performance estimation of loom machine, which calculates the
efficiency and meter count for weaved cloth automatically. Also it calculates the efficiency of loom
machine. Previously the same was done using manual process which was not efficient. This article is
intended for loom machines which are not modern.
KEYWORDS
Loom machine, efficiency, meter count
1. INTRODUCTION
Now a days the loom machines used are very sophisticated and costly [1] [8][9][11]. So small
factories running loom machine are not able to purchase those costly loom machines. So we
thought of upgrading the older loom machines which are still in use in small factory like one in
Kolhapur, a city in the state of Maharashtra, India. We are making it easier to calculate the
performance parameters like efficiency calculation, meter calculation etc. Traditionally
calculation of efficiency is a complete manual process. Here overall meters of cloth weaved by a
machine in one shift will be considered. For calculations of efficiency there were various
disadvantages like loss of data, error due to machine stoppage, manual error etc.
In current PC based electronic system loom machine there are certain advantages over traditional
system. But in spite of that there are several disadvantages like PC should always be ON,
complete utilization of PC is not done, and the need of skilled labors.
In the new proposed system we are using VLSI technology instead of microprocessor. This
system has an optional PC interface which will be used for data storage. Since the PC interface is
optional, system functioning will be independent of PC. This system has a user friendly keyboard
which can be operated by any person. It is not mandatory that the operator should have prior
knowledge of PC.](https://image.slidesharecdn.com/3112vlsics10-180829114235/75/SYSTEM-ON-PROGRAMMABLE-CHIP-FOR-PERFOMANCE-ESTIMATION-OF-LOOM-MACHINE-1-2048.jpg)
![International Journal of VLSI design & Communication Systems (VLSICS) Vol.3, No.1, February 2012
120
2. BLOCK DIAGRAM
The block diagram is as shown in figure 1.
3. EXPLANATION OF BLOCK DIAGRAM
3.1. HALL-EFFECT PROXIMITY SWITCH SENSOR (HP)
Non-contact magnetic sensor proximity switch produces a digital output. The output switches
between logic low (operate point) and logic high (release point) with presence and absence of a
magnet as a target. The difference between the magnetic operate and release points are called the
hysteresis of the device. The built-in hysteresis circuitry allows clean switching of the output even
in the presence of external mechanical vibration and electrical noise [2].
3.2. SENSOR
The sensor as shown in figure no. 1 is connected to the rotating shaft and for that signal is
generated and then it is amplified and converted to square wave using signal conditioning circuit,
and it is given to FPGA.
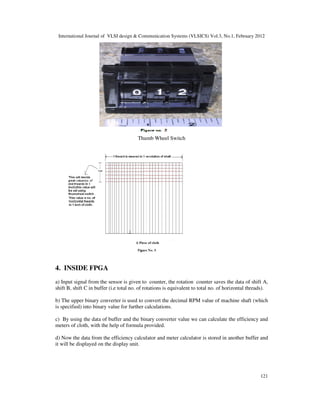
3.3. THUMB WHEEL SWITCH
This will decide the pick value. We will be using thumbwheel switch (3 wheels) and it will decide
the density of Horizontal threads per inch [3]. A typical thumbwheel switch is shown in figure no.
2
3.4. KEYBOARD
The keyboard is connected to the FPGA which contains the labels shift A, shift B and shift C,
now by pressing the “efficiency button” it will display the efficiency.
3.5 DISPLAY UNIT
For display we are using seven segment display as shown in the modified block diagram . See
figure no. 4.
3.6. DATA OUT PC: UART
The Universal Asynchronous Receiver / Transmitter (UART) controller is the key component of
the serial communications subsystem of a computer. The UART takes bytes of data and transmits
the individual bits in a sequential fashion.we are using only the serial transmitter in this project
[4].](https://image.slidesharecdn.com/3112vlsics10-180829114235/85/SYSTEM-ON-PROGRAMMABLE-CHIP-FOR-PERFOMANCE-ESTIMATION-OF-LOOM-MACHINE-2-320.jpg)
![International Journal of VLSI design & Communication Systems (VLSICS) Vol.3, No.1, February 2012
122
4.1. Rotation Counter
This will count the no of rotations of the shaft
4.2. Binary Converter
It is used to convert the decimal RPM value of machine shaft (which is specified) into binary
value for further calculation.
4.3. Buffer for Storing Total Rotation Data
These will store the total no of rotations of shaft (i.e. total no of Horizontal threads used in
particular shift).
BUFFER VALUE IS:
999*60* SHIFT HOURS (999 is max. speed of shaft in rpm)
MAX BUFFER VALUE IS 719280
4.4. Efficiency Calculator
This will calculate the efficiency
Efficiency = [Count value/ (rpm* 60 * shift hours)]*100
4.5. Meter Calculator
It will calculate the total length of cloth in meter.
Meter = Count value / (pick value *39.37)
5. DESIGN APPROACH
i. In this we will be using FPGA XC3S200 FT256 kit with in built serial port [5].
ii. We will mount sensors, thumbwheel switch, and all other on a zero PCB
iii. Data will be sent to PC using a serial cable
iv. Seven segment display will be used to show current meter calculations
v. At the end of shift, just by pressing efficiency button one can get efficiency value](https://image.slidesharecdn.com/3112vlsics10-180829114235/85/SYSTEM-ON-PROGRAMMABLE-CHIP-FOR-PERFOMANCE-ESTIMATION-OF-LOOM-MACHINE-4-320.jpg)
![International Journal of VLSI design & Communication Systems (VLSICS) Vol.3, No.1, February 2012
123
Figure No. 4. MODIFIED BLOCK DIAGRAM
6. SOFTWARE REQUIREMENTS
[1] VHDL or Verilog programmer & Editor
[2] Xilinx ISE
[3] Modelsim
7. HARDWARE REQUIREMENTS
[1] FPGA XC3S200 FT256
[2] PC with RS-232 cable.
[3] General FPGA Kit.
[4] RPM Counter Proximity Sensor
[5] Signal Conditioner
[6] Thumbwheel switch
[7] Seven Segment Led Display Unit
[8] Push Button switches](https://image.slidesharecdn.com/3112vlsics10-180829114235/85/SYSTEM-ON-PROGRAMMABLE-CHIP-FOR-PERFOMANCE-ESTIMATION-OF-LOOM-MACHINE-5-320.jpg)
![International Journal of VLSI design & Communication Systems (VLSICS) Vol.3, No.1, February 2012
125
9. FUTURE SCOPE
[1] GENERALIZED KIT: hardware can be modified itself on the kit.
[2] Data stored on PC can be made available on internet[10][12] for its remote usage
[3] Can include various other issues related to loom machine such as:
a) Speed control of loom machine b) Selection of horizontal threads
10. CONCLUSION
The system uses VLSI technology instead of microprocessor. PC is used as an optional interface
and will be used for data storage. Since the PC interface is optional, the system functioning is
independent of PC. The user friendly keyboard used in the system can be operated by any person.
It is not mandatory that the operator should have prior knowledge of PC. System on
programmable chip (SOPC) for performance estimation of loom machine, calculates the
efficiency and meter count for weaved cloth automatically. Previously same was done using
manual process which was not efficient. The data available on PC can be made available on
internet for remote usage.
REFERENCES
[1] Encarta Encyclopedia
[2] http://en.wikipedia.org/wiki/Hall_effect_sensor
[3] http://www.space1.com/Artifacts/Space_Shuttle_Artifacts/Thumbwheel
Switch/thumbwheel_switch.html
[4] http://www.freebsd.org/doc/en/articles/serial-uart/
[5] http://www.xilinx.com/
[6] VHDL cook Book by peter J. ashenden
[7] Design of VLSI systems by Dr Daniel J. MLYNEK
[8] Eric Targerson & Frank W Paul, “Vision guided Robotic fabric manipulation for apparel
Manufacturing”, IEEE Control Systems magazine, Vol. 8, pp. 14-20, 1988
[9] Sari-Sarraf H,Goddard C J S, “Vision system for on-loom fabric inspection”, IEEE Textile Fiber &
film Industry Technical conference, pp. 801-810,1998
[10] Chun-Hong wang, Chun-Ying Wu, “ Study on Loom’s monitor system based on DSP & CAN
bus”, International Conference on Computer Engineering & Technology(ICCET), Vol 4, pp. v4-
591-v4-594, April 2010
[11] Zhenhua Zhao, Weifa Yang, Na wang, Zijie Xu, “ A hardware design of defect detection system in
cloth belt based on Machine vision”, International conference on Electrical & Control
Engineering(ICECE), pp. 62-65, June 2010
[12] Wayi Zhangi, Qiangsong Zhao, Liang Liao, “ Development of a real time machine vision system
for detecting defects of cord fabrics”, International Conference on Computer Application & system
Modeling (ICCASM), Vol. 12, pp. v12-539-v12-543, Oct 2010](https://image.slidesharecdn.com/3112vlsics10-180829114235/85/SYSTEM-ON-PROGRAMMABLE-CHIP-FOR-PERFOMANCE-ESTIMATION-OF-LOOM-MACHINE-7-320.jpg)

The document presents a system on a programmable chip aimed at automating the performance estimation of loom machines by calculating efficiency and meter count for weaved cloth. This system replaces the traditional manual process, thereby minimizing errors and enhancing efficiency, particularly for older loom machines in small factories. It employs VLSI technology, a user-friendly interface, and optional PC connectivity for data storage, making it accessible for operators without prior PC knowledge.


