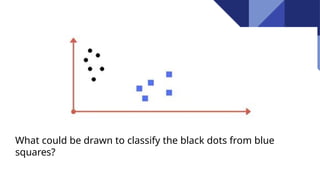
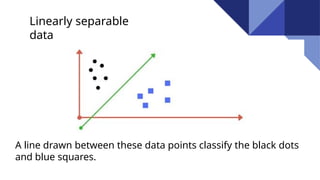
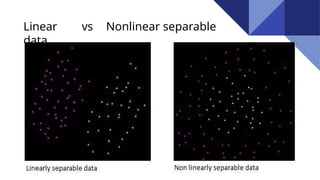
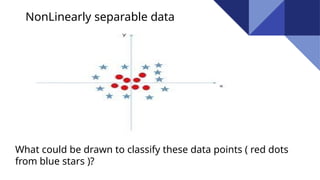
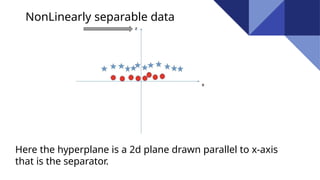
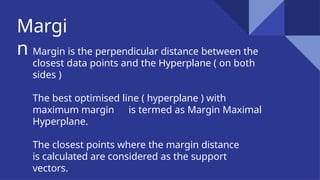
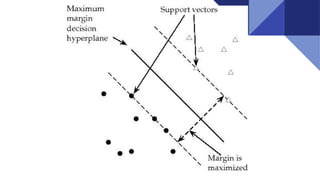
Support Vector
Machine
Classification , Regression and Outliers
detection
Introductio
n SVM
A Support Vector
Machine (SVM) is a
discriminative classifier
which intakes training
data (supervised
learning), the algorithm
outputs an optimal
hyperplane which
categorizes new
examples.
What could be drawn to classify the black dots from blue
squares?
A line drawn between these data points classify the black dots
and blue squares.
Linearly separable
data
Linear vs Nonlinear separable
data
What could be drawn to classify these data points ( red dots
from blue stars )?
NonLinearly separable data
Here the hyperplane is a 2d plane drawn parallel to x-axis
that is the separator.
NonLinearly separable data
Non Linear data ( type 2 )
Raw Data Line as
Hyperplane
For the previous data the line , if used as
a
Hyperplane
● Two black dots also fall in category
of blue squares
● Data separation is not perfect
● It tolerates some outliers in
the classification
This type of separator best provides the
classification.
But
● It is quite difficult to train a model like this .
● This is termed as Regularisation parameter.
Tuning
Parameter
s
SVM
1.
Kernel
2. Regularizatio
n
3. Gamma
4. Margin
Margi
n Margin is the perpendicular distance between the
closest data points and the Hyperplane ( on both
sides )
The best optimised line ( hyperplane ) with
maximum margin is termed as Margin Maximal
Hyperplane.
The closest points where the margin distance
is calculated are considered as the support
vectors.
Applications :
1. Face detection
2. Text and hypertext categorization
3. Classification of images
4. Bioinformatics
5. Handwriting recognition
6. Protein fold and remote homology
detection
7. Generalized predictive control(GPC)
Let’s code now
Data used : Iris from Sklearn
Plots : Matplotlib
File : svm_final.py
Link to code : Click
here for code
Thank
You

SVM introduction for machine learning engineers

  • 1.
    Support Vector Machine Classification ,Regression and Outliers detection
  • 2.
    Introductio n SVM A SupportVector Machine (SVM) is a discriminative classifier which intakes training data (supervised learning), the algorithm outputs an optimal hyperplane which categorizes new examples.
  • 3.
    What could bedrawn to classify the black dots from blue squares?
  • 4.
    A line drawnbetween these data points classify the black dots and blue squares. Linearly separable data
  • 5.
    Linear vs Nonlinearseparable data
  • 6.
    What could bedrawn to classify these data points ( red dots from blue stars )? NonLinearly separable data
  • 7.
    Here the hyperplaneis a 2d plane drawn parallel to x-axis that is the separator. NonLinearly separable data
  • 8.
    Non Linear data( type 2 ) Raw Data Line as Hyperplane
  • 9.
    For the previousdata the line , if used as a Hyperplane ● Two black dots also fall in category of blue squares ● Data separation is not perfect ● It tolerates some outliers in the classification
  • 10.
    This type ofseparator best provides the classification. But ● It is quite difficult to train a model like this . ● This is termed as Regularisation parameter.
  • 11.
  • 12.
    Margi n Margin isthe perpendicular distance between the closest data points and the Hyperplane ( on both sides ) The best optimised line ( hyperplane ) with maximum margin is termed as Margin Maximal Hyperplane. The closest points where the margin distance is calculated are considered as the support vectors.
  • 14.
    Applications : 1. Facedetection 2. Text and hypertext categorization 3. Classification of images 4. Bioinformatics 5. Handwriting recognition 6. Protein fold and remote homology detection 7. Generalized predictive control(GPC)
  • 15.
    Let’s code now Dataused : Iris from Sklearn Plots : Matplotlib File : svm_final.py Link to code : Click here for code
  • 16.