Downloaded 309 times

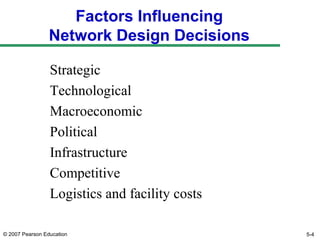


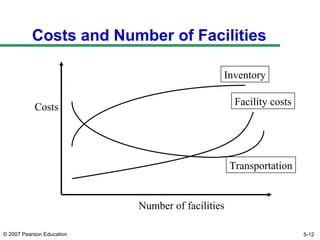
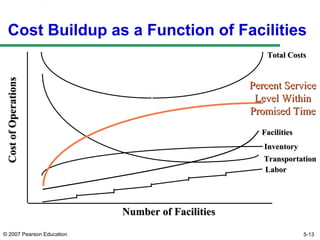
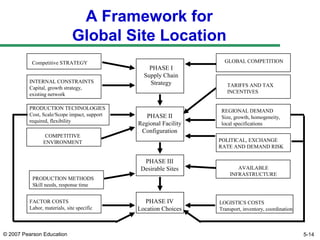

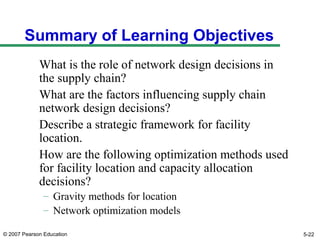

The document discusses network design in supply chain management, including factors influencing network design decisions, frameworks for facility location, and optimization methods. It covers the roles of facility location, capacity allocation, market allocation, and supply allocation in network design. Optimization methods addressed are gravity methods for location modeling and network models for allocating demand to facilities, locating facilities, and configuring networks while minimizing costs.